[Cheryl, Daniel, Jenne, Keita, Nutsinee, Kiwamu]
As planned, we locked PRMI with the carrier light resonant. At the very end of the test, we had one good (but short) lock in which the PRC power reached 90% of that for the full interferometer case.
Here is a time line for the last good lock stretch.
- Locking started at 23:35 UTC
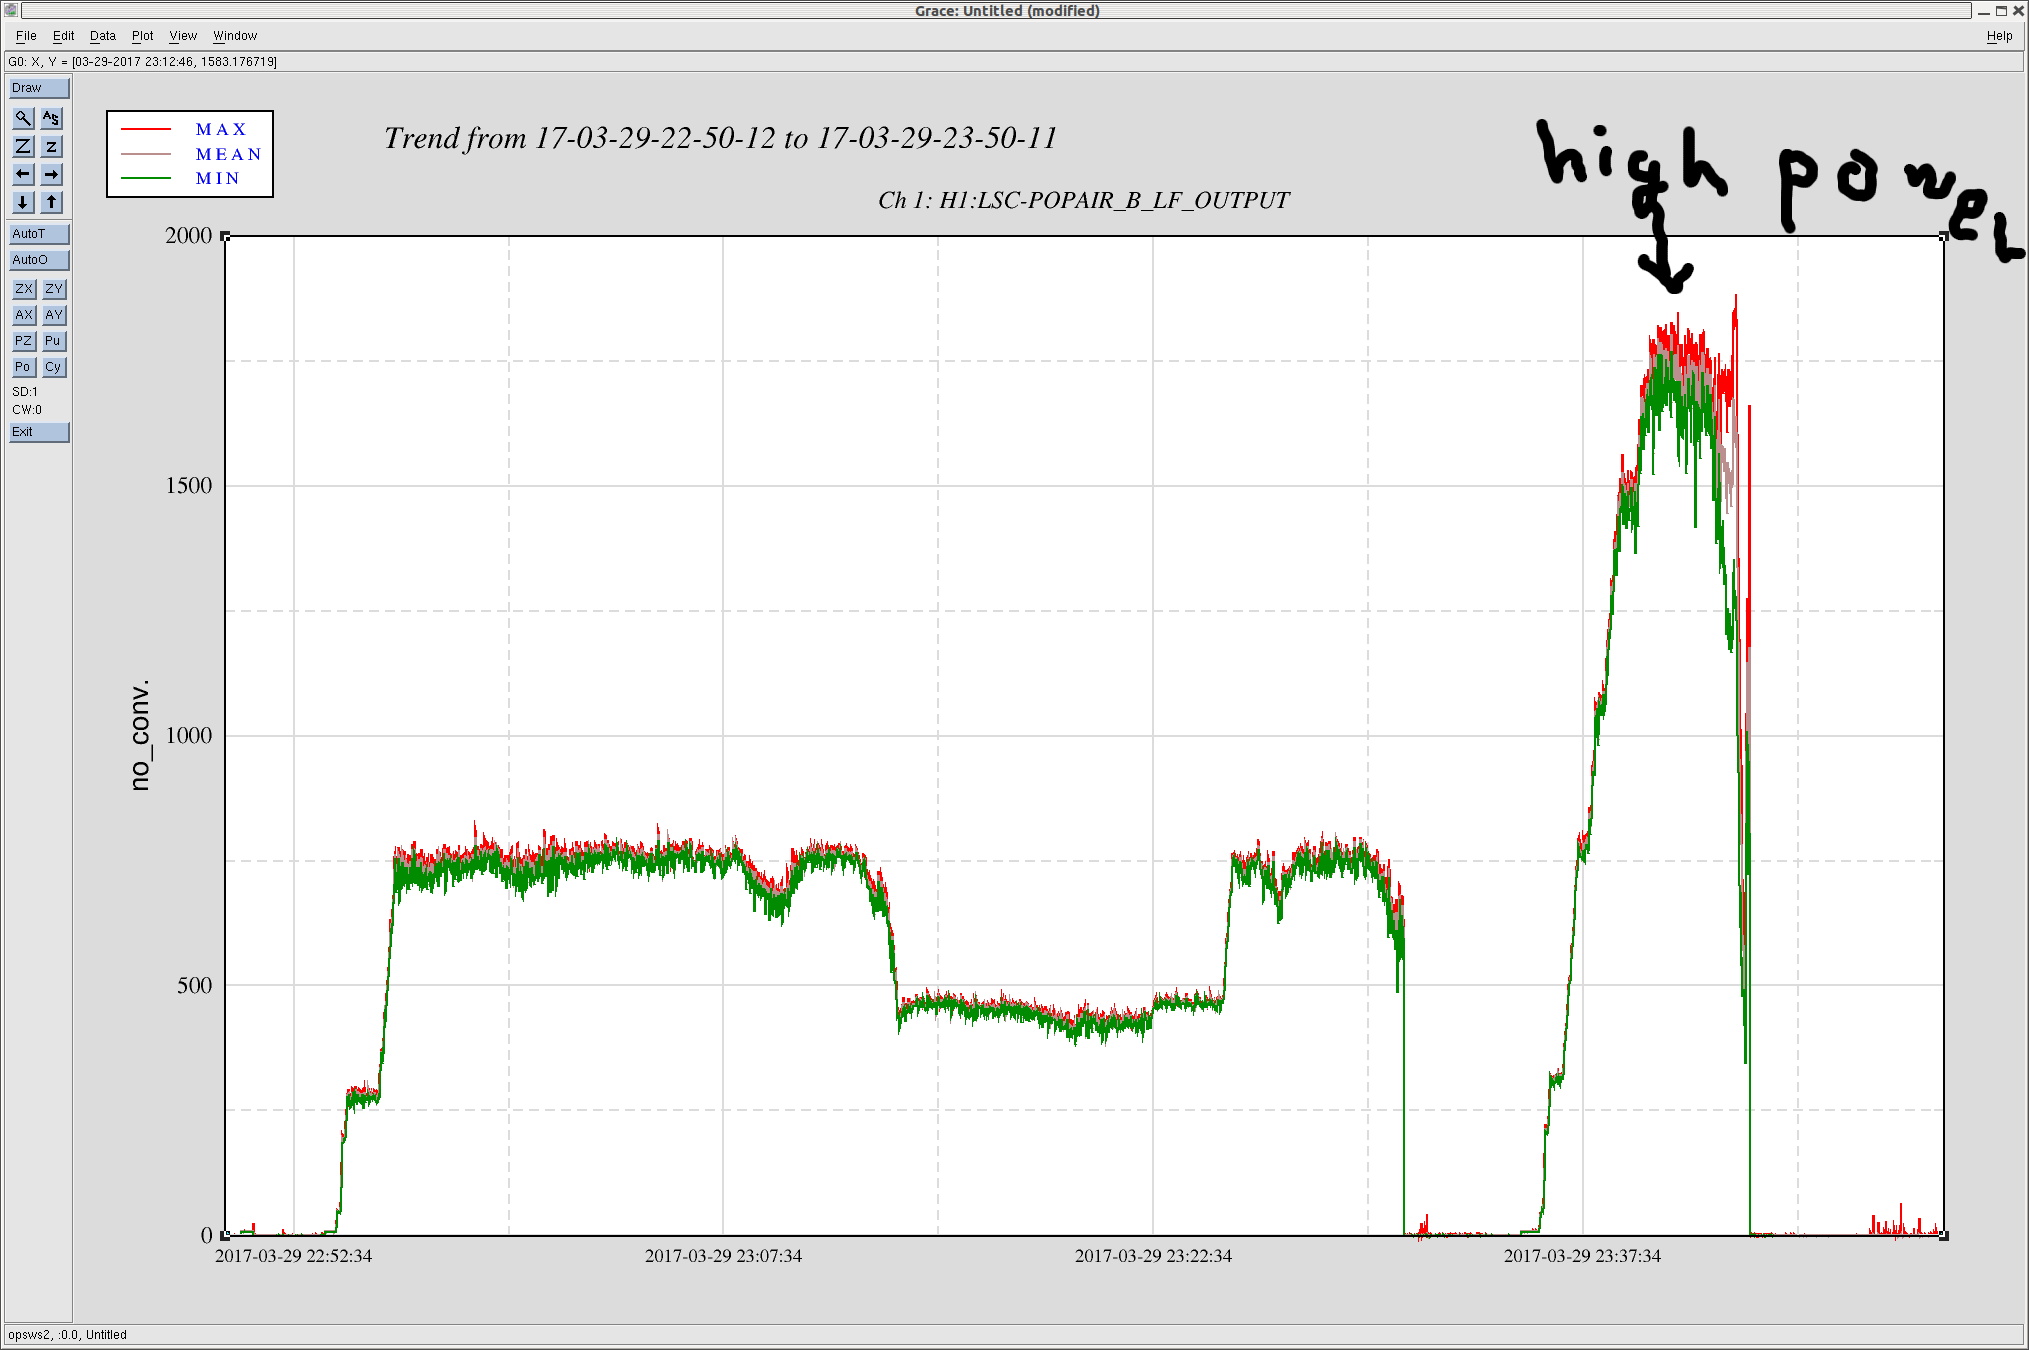
- The highest power was achieved (PSL = 57 W) at 23:40 UTC
- Lock was lost at 23:43 UTC
See the attached for trend of POP_A_LF. Assuming a power recycling gain of 30 for the full interferometer, we can estimate the usual PRC power to be 30-ish W * 30 = 900 W during O2. Today we achieved 90% of it according to POP_A_LF. Therefore 900 W * 0.9 = 810 W. Considering the 50% splitting ratio at the BS, ITMX receives ~400 W during the last high power test today. In addition, we had a number of lock stretches that lasted longer but with smaller PSL power prior to the last high power test.
Also, technically speaking, MICH wasn't locked at a dark fringe. Instead it was locked at a slightly brighter fringe using the variable finesse technique (35198). Also also, during the last test, Daniel and Keita unplugged a BNC cable from the trigger PD by HAM6 which triggers the fast shutter in HAM6 such that the shutter can stay closed throughout the test to prevent some optics from damaging. After we finished today's test, Daniel put the cable back in so that we can go back to interferometer locking.
Hartmann sensor test results:
The last lock was initialized at 1174865790, reached full power approximately 210s afterwards and then was lost around 1174866190.
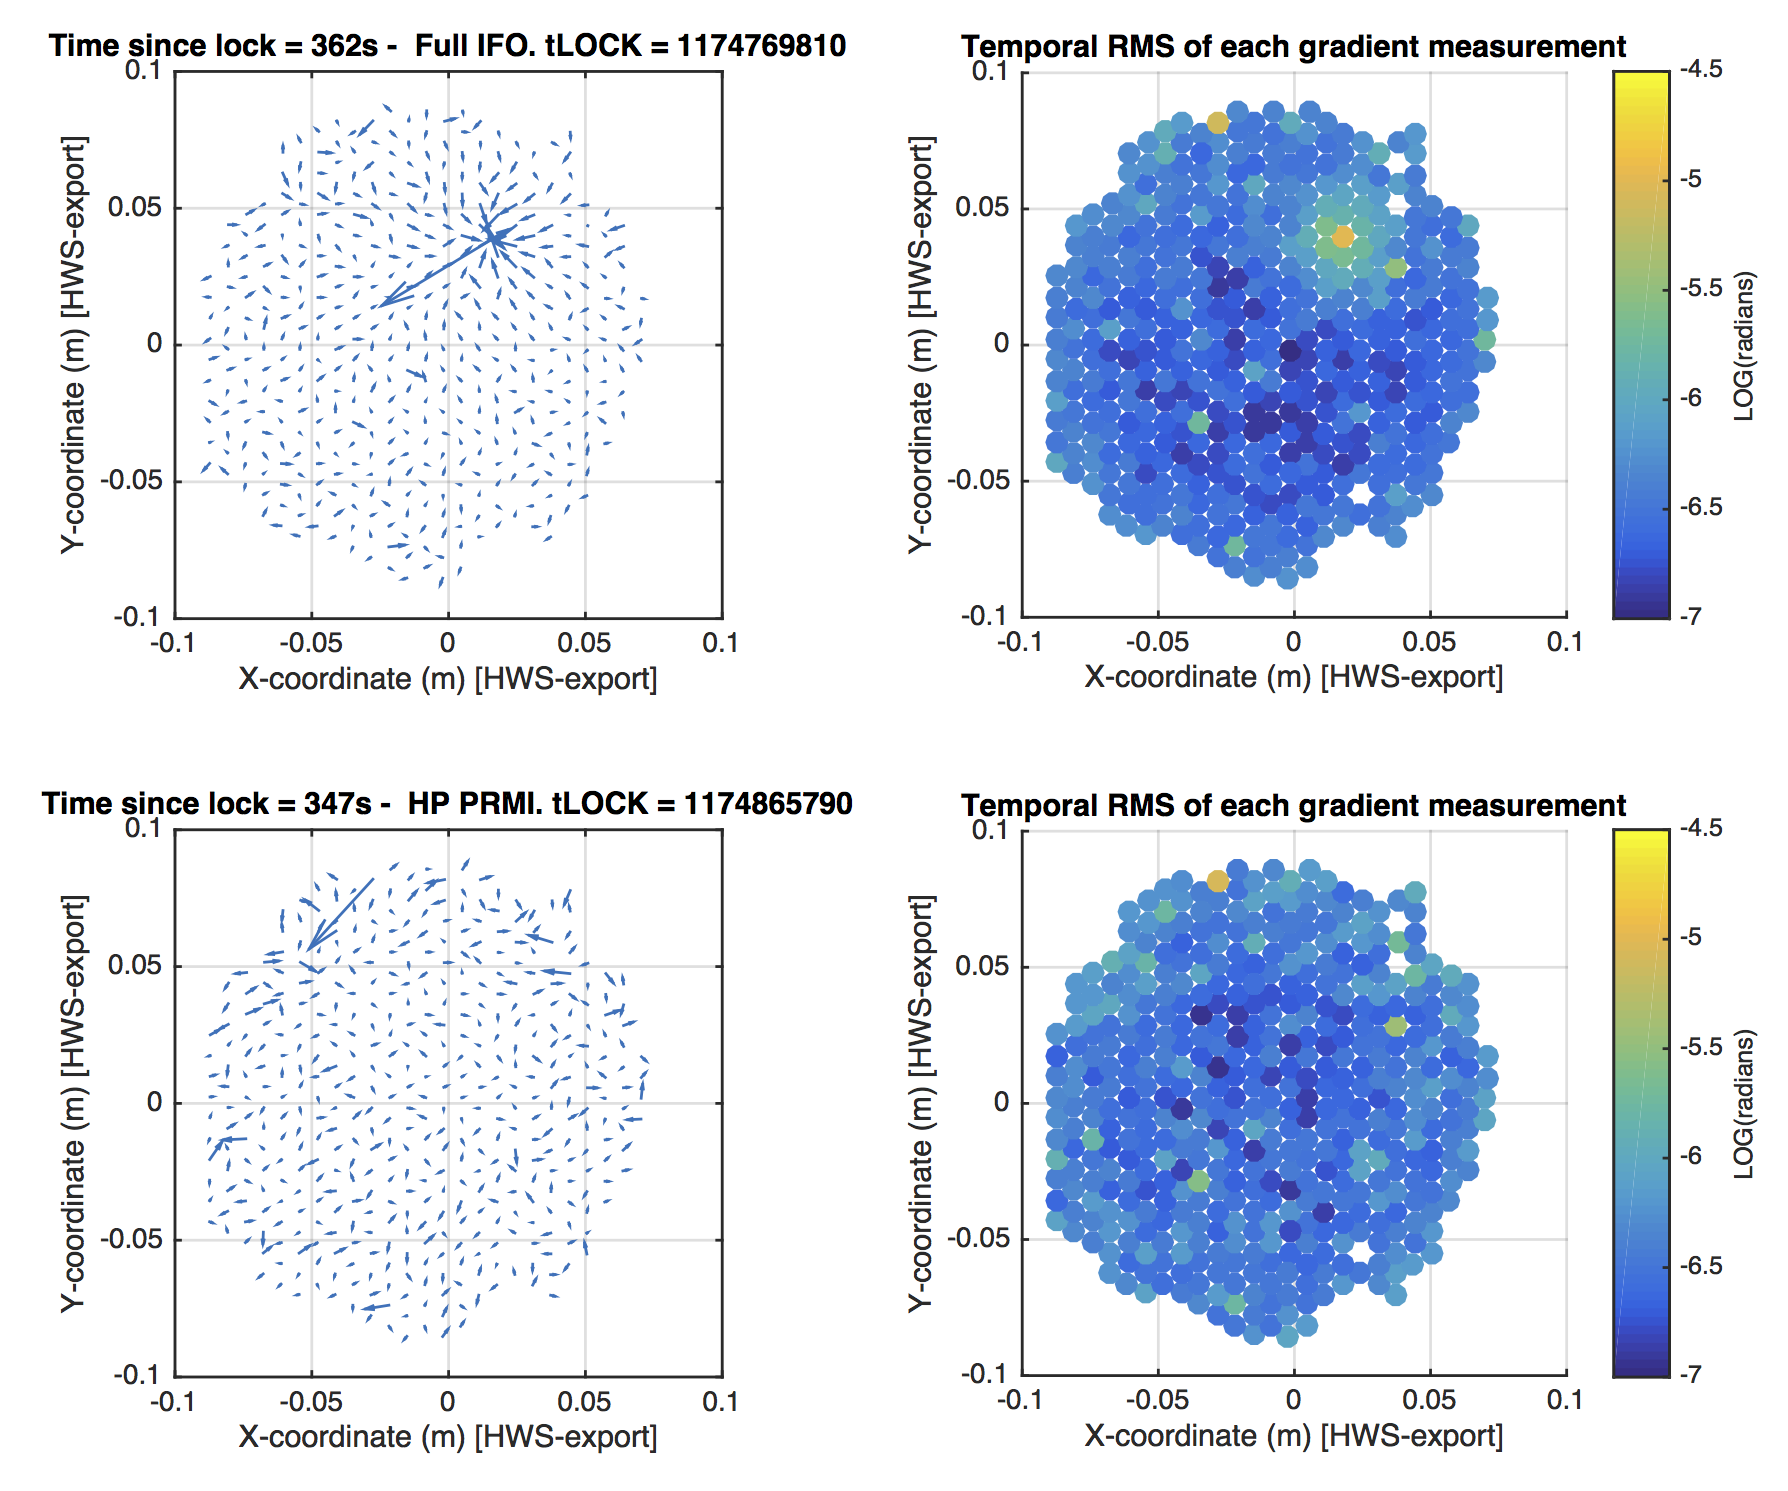
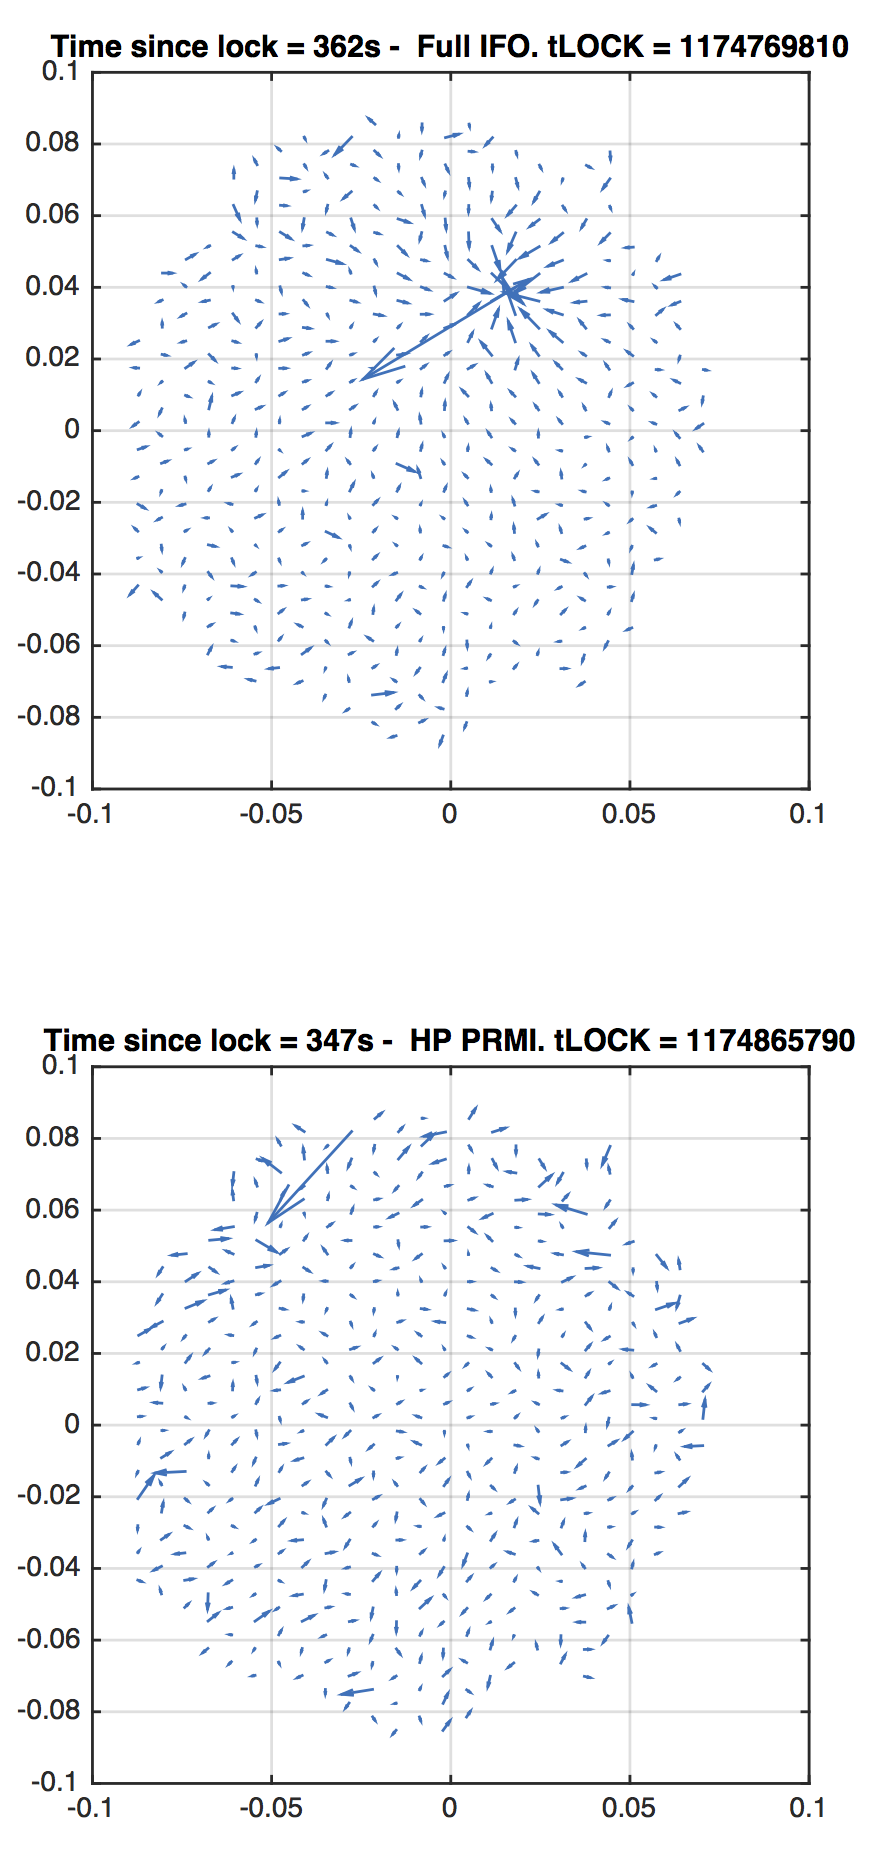
I've plotted the gradient field data for the PRMI test, 350s after locking (cleaning up errant spots). For reference, I've also plotted the gradient field data for the full IFO, 360s after locking. The arrows in both cases are scaled such that they represent almost exactly the same length gradients in the two plots.
The bottom line: the full IFO shows the thermal lens. The high power PRMI does not.

Here's a GIF animation from the time segment for your amusement. There's so little data point that the animation has to be slowed down a bit. The last 120s was some optic misalignment leading to the lockloss.
I'm adding the following plot to show the uncertainty in each of the individual measurements in the HWS gradient field. This should help guide your eye as to which data points are noisy relative to their neighbours. In other words, here is the spatial sensitivity of the Hartmann sensor. This is in the raw exported coordinate system of the Hartmann sensor (that is, scaled to the ITM size but not oriented and not centered).
For example, notice that the point around [-0.03, 0.08] is unusually noisy. So the large arrow associated with it is not signal but noise.
For each data point, the RMS in the gradient of that data point is determined for the 600-1000s of data that is available. That is, for each data point:
U_i = d(WF)/dx, V_i = d(WF)/dy, where i is the i-th measurement of that data point.
RMS = SQRT(VAR(U) + VAR(V))
Note that RMS of the gradient data near the thermal lens is larger because of the presence of signal, not noise.