alexander.urban@LIGO.ORG - posted 11:24, Monday 10 April 2017 (35437)
C00 vs. C01 Frame Type Comparison Available
A. Urban, on behalf of the calibration group
The full suite of summary pages comparing C01 data against the online C00 frames are available here (requeres LIGO.ORG credentials). Note, these pages currently cover data between 30 November 2016 and 10 March 2017, inclusive.
Notes:
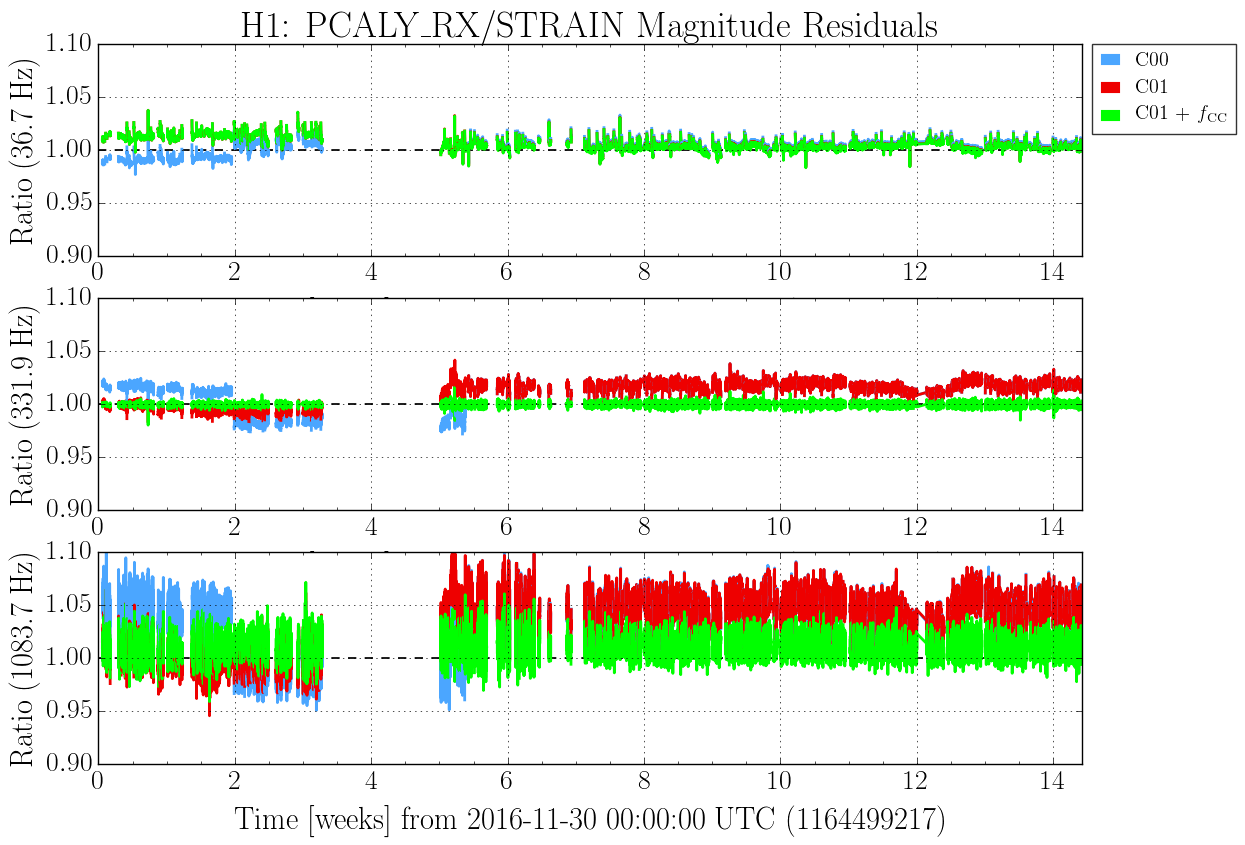
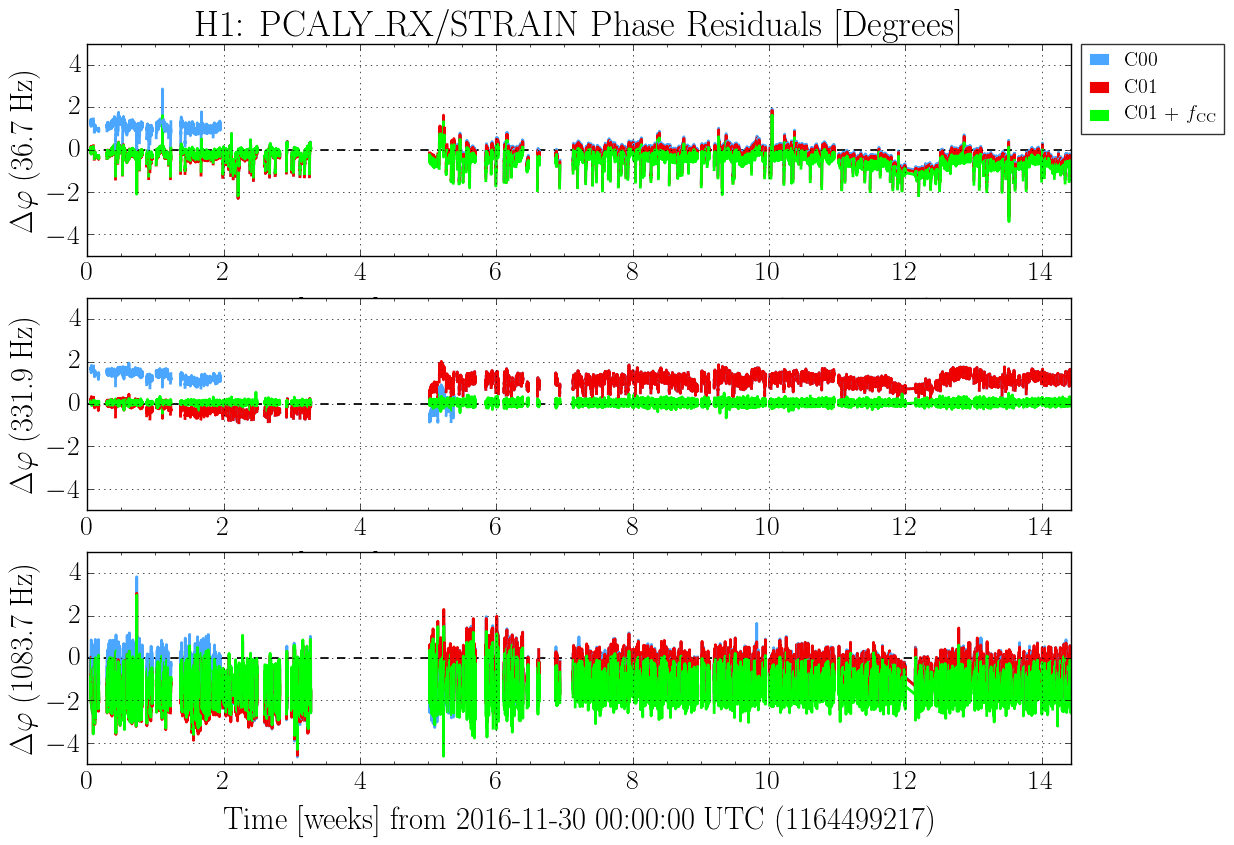
- The front page, linked to above, contains a number of goodies. Probably the most important is a full set of timeseries trends of PCAL/h(t), showing both magnitude and phase, at both interferometers. The blue trace shows C00 data, the red trace shows C01, and the green trace corrects C01 for the time-varying coupled cavity pole frequency, which is tracked online. The plots made for Hanford data are attached below. (As expected, tracking f_CC puts the magnitude of these line ratio trends to unity at 331.9 and 1083.7 Hz, although there is a phase offset above 1 kHz.)
- Also on the front page is a link to an overview of C01 analysis segments. I put this together based on email traffic in the CBC group, in which some PyCBC people were wondering how segments affect the searches.
- There are daily summaries between 30 November and 10 March at both instruments. These are organized into four tabs: a summary showing ASD ratios, BNS range, and segment information; a snapshot of kappa timeseries trends; a higher-level view of the BNS range (including its derivative with respect to frequency and the cumulative fraction of SNR over frequency); and a fourth tab showing zoomed-in plots at each PCAL line.
- At the request of several people, each page now also links back to the homepage.
The scripts I used to generate some of these plots live in the calibration SVN repo and use GWPy (which can be sourced on any of the LDAS clusters by sourcing the gwpy.env script in that repo). The rest of it was all done using the gwsumm, the same infrastructure used to make Duncan's DetChar summary pages. (To see how a specific page was made, you can always hit "How was this page generated?" at the bottom of the page.)
Images attached to this report