[Heather Fong, Sheila Dwyer]
Over the last few months, Sheila and I have been trying to find correlations between auxiliary channels and LHO's sensitivity range. In order to do so, we first made changes to the OAF BLRMS range channels by adding notch filters such that they can track changes to the SENSMON range (see alog 33437). After we made these changes, the summed OAF BLRMS range contributions now have a linear relationship with the SENSMON range, with their units roughly calibrated to be Mpc.
I then wrote a Python script that does the following:
- Loads in desired auxiliary channel data (using NDS and GWpy) for a specified period of time (we analyze minute trends)
- Calculates the Pearson correlation coefficient (PCC) between auxiliary channels and the OAF BLRMS range channels in order to determine how linearly correlated the channels are
- Plots and saves the channels with the highest PCC (aux channels vs. OAF BLRMS range and aux channels vs. time)
Attached to this entry are examples of the aux channels vs. OAF BLRMS range for the time period of Feb 24 2017 to Apr 10 2017 (45 days, H1 observing mode only). The complete list of channels that were analyzed are attached under the file name 'BLRMS_channel_list.txt'. With the exception of the OAF channels, both mean and RMS channels were analyzed. For ~360 channels over a time range of 45 days, this script takes ~2 hours to complete, where the data retrieval from NDS is the bottleneck. The Python script has been uploaded to the LIGO git repository and can be found here:
git clone https://heather-fong@git.ligo.org/heather-fong/BLRMS-channels-correlations.git
where BLRMS_channels_analysis.py is the Python script, and BLRMS_channel_list.txt is an example of channels that can be analyzed.
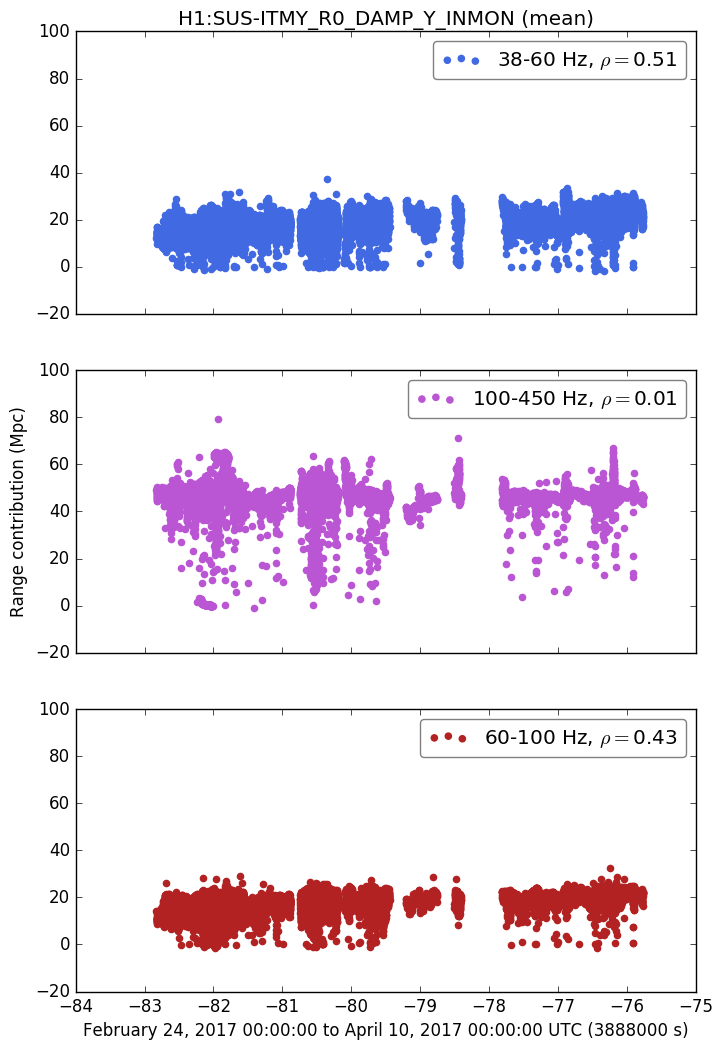
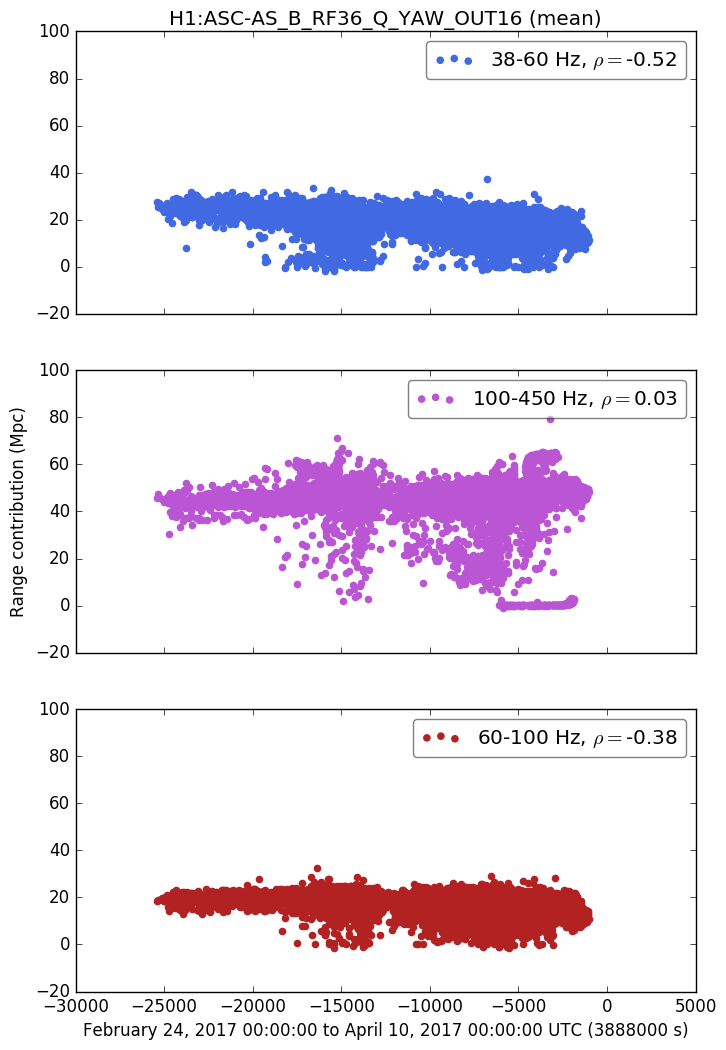
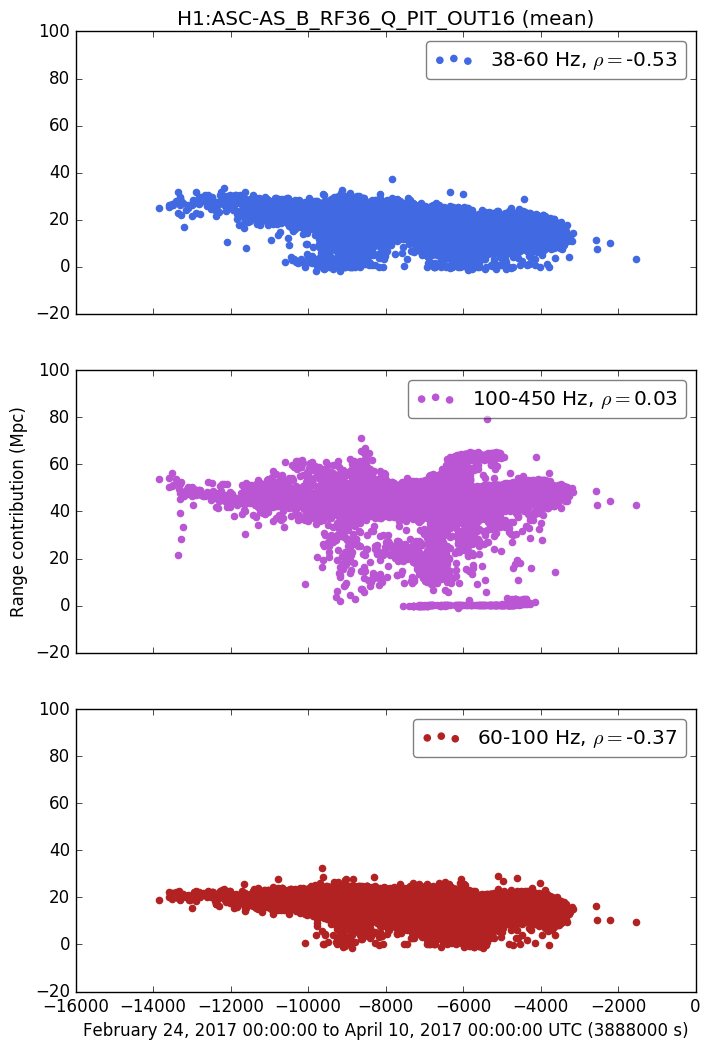
We found the channels with the highest absolute PCC values (and are therefore most correlated with the range) to be the following (plots are attached):
H1:ASC_AS_B_RF36_Q_PIT_OUT16
H1:ASC-AS-B-RF36_Q_YAW_OUT16
H1:SUS-ITMY_R0_DAMP_Y_INMON
Other channels we analyzed that appear to be correlated with the range include:
H1:SUS-ITMX_M0_DAMP_R_INMON (max PCC = -0.5 for 38-60Hz range)
H1:SUS-ITMY_R0_DAMP_L_INMON (max PCC = 0.5 for 38.60 Hz range)
The results of this analysis gives us hints as to which parts of the interferometer are affecting the sensitivity range. In particular, the results suggest that there are problems with the ITMY reaction mass that are not seen in the ITMX reaction mass, and we can, for example, try putting different offsets in ITMY to confirm this.

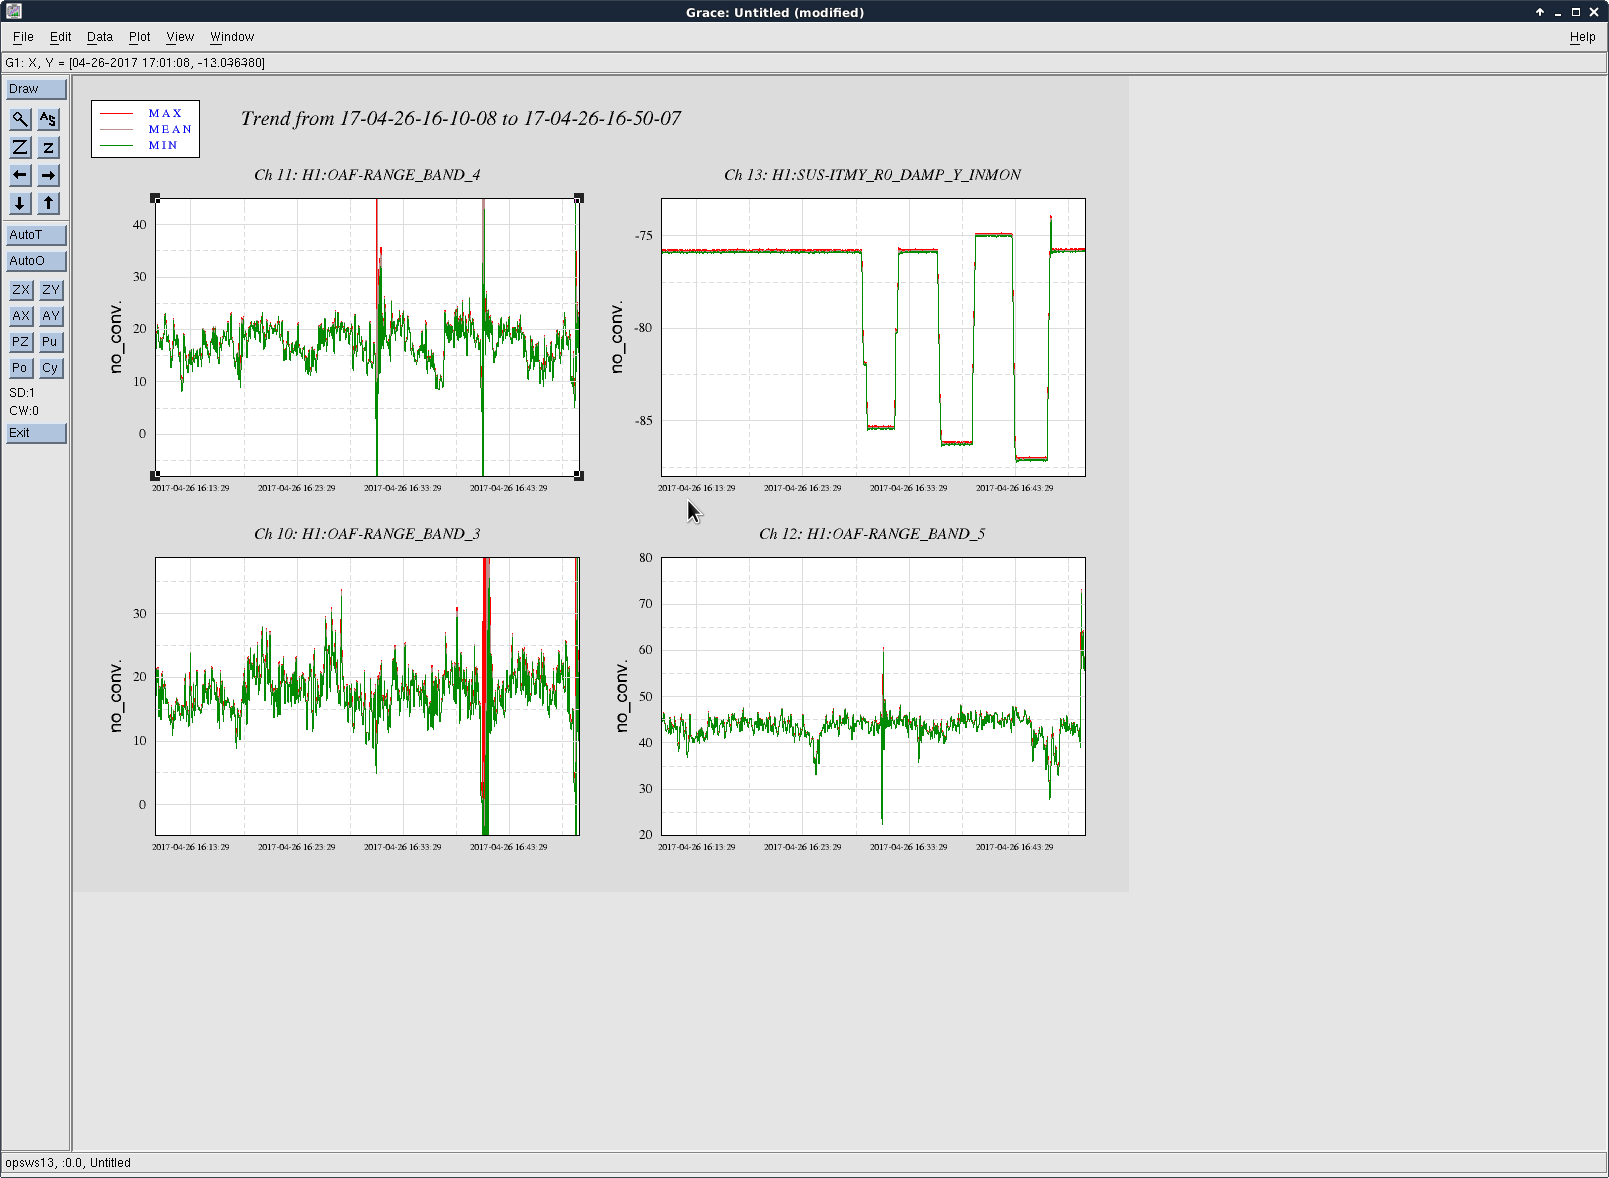
During the commissioning window this morning I tried moving ITMY reaction mass in yaw so that the DAMP Y INMON moved from about -75 to -86 several times, so see if there is any noticable difference in the DARM spectrum. I didn't see anything changing in the spectrum. Attached is a time series of the yaw osem and the DARM BLRMS.