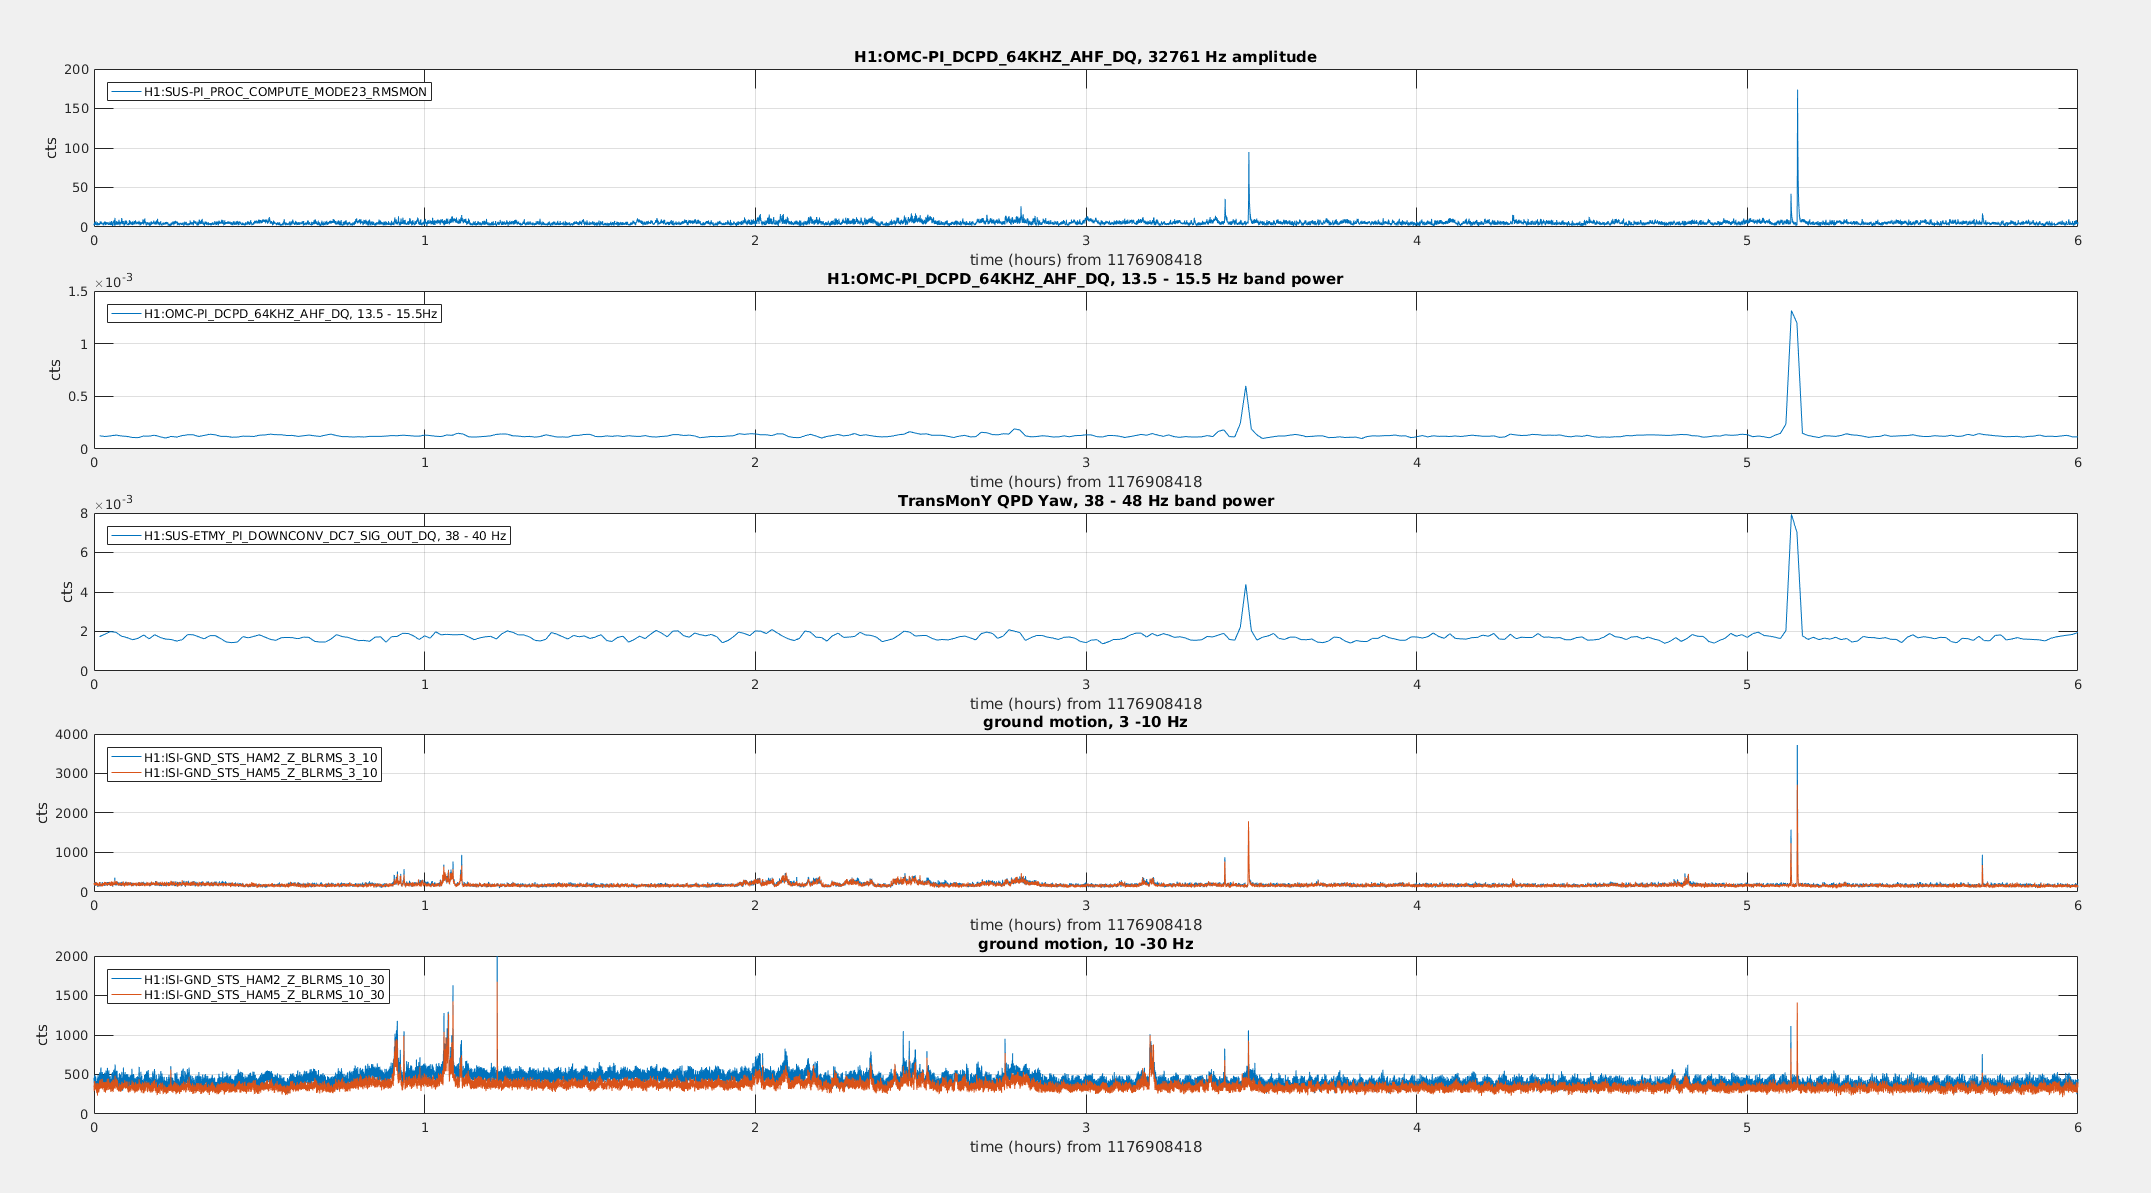
Amplitude of 32761 Hz PI (Mode23 in LHO damping scheme) correlates with 3 - 30 Hz seismic motion. There is also a corresponding comb that rises in the PI OMC channel at 2*(Nyquist - PI frequency), where Nyquist = 32768 Hz and PI freq ~ 32761 Hz.
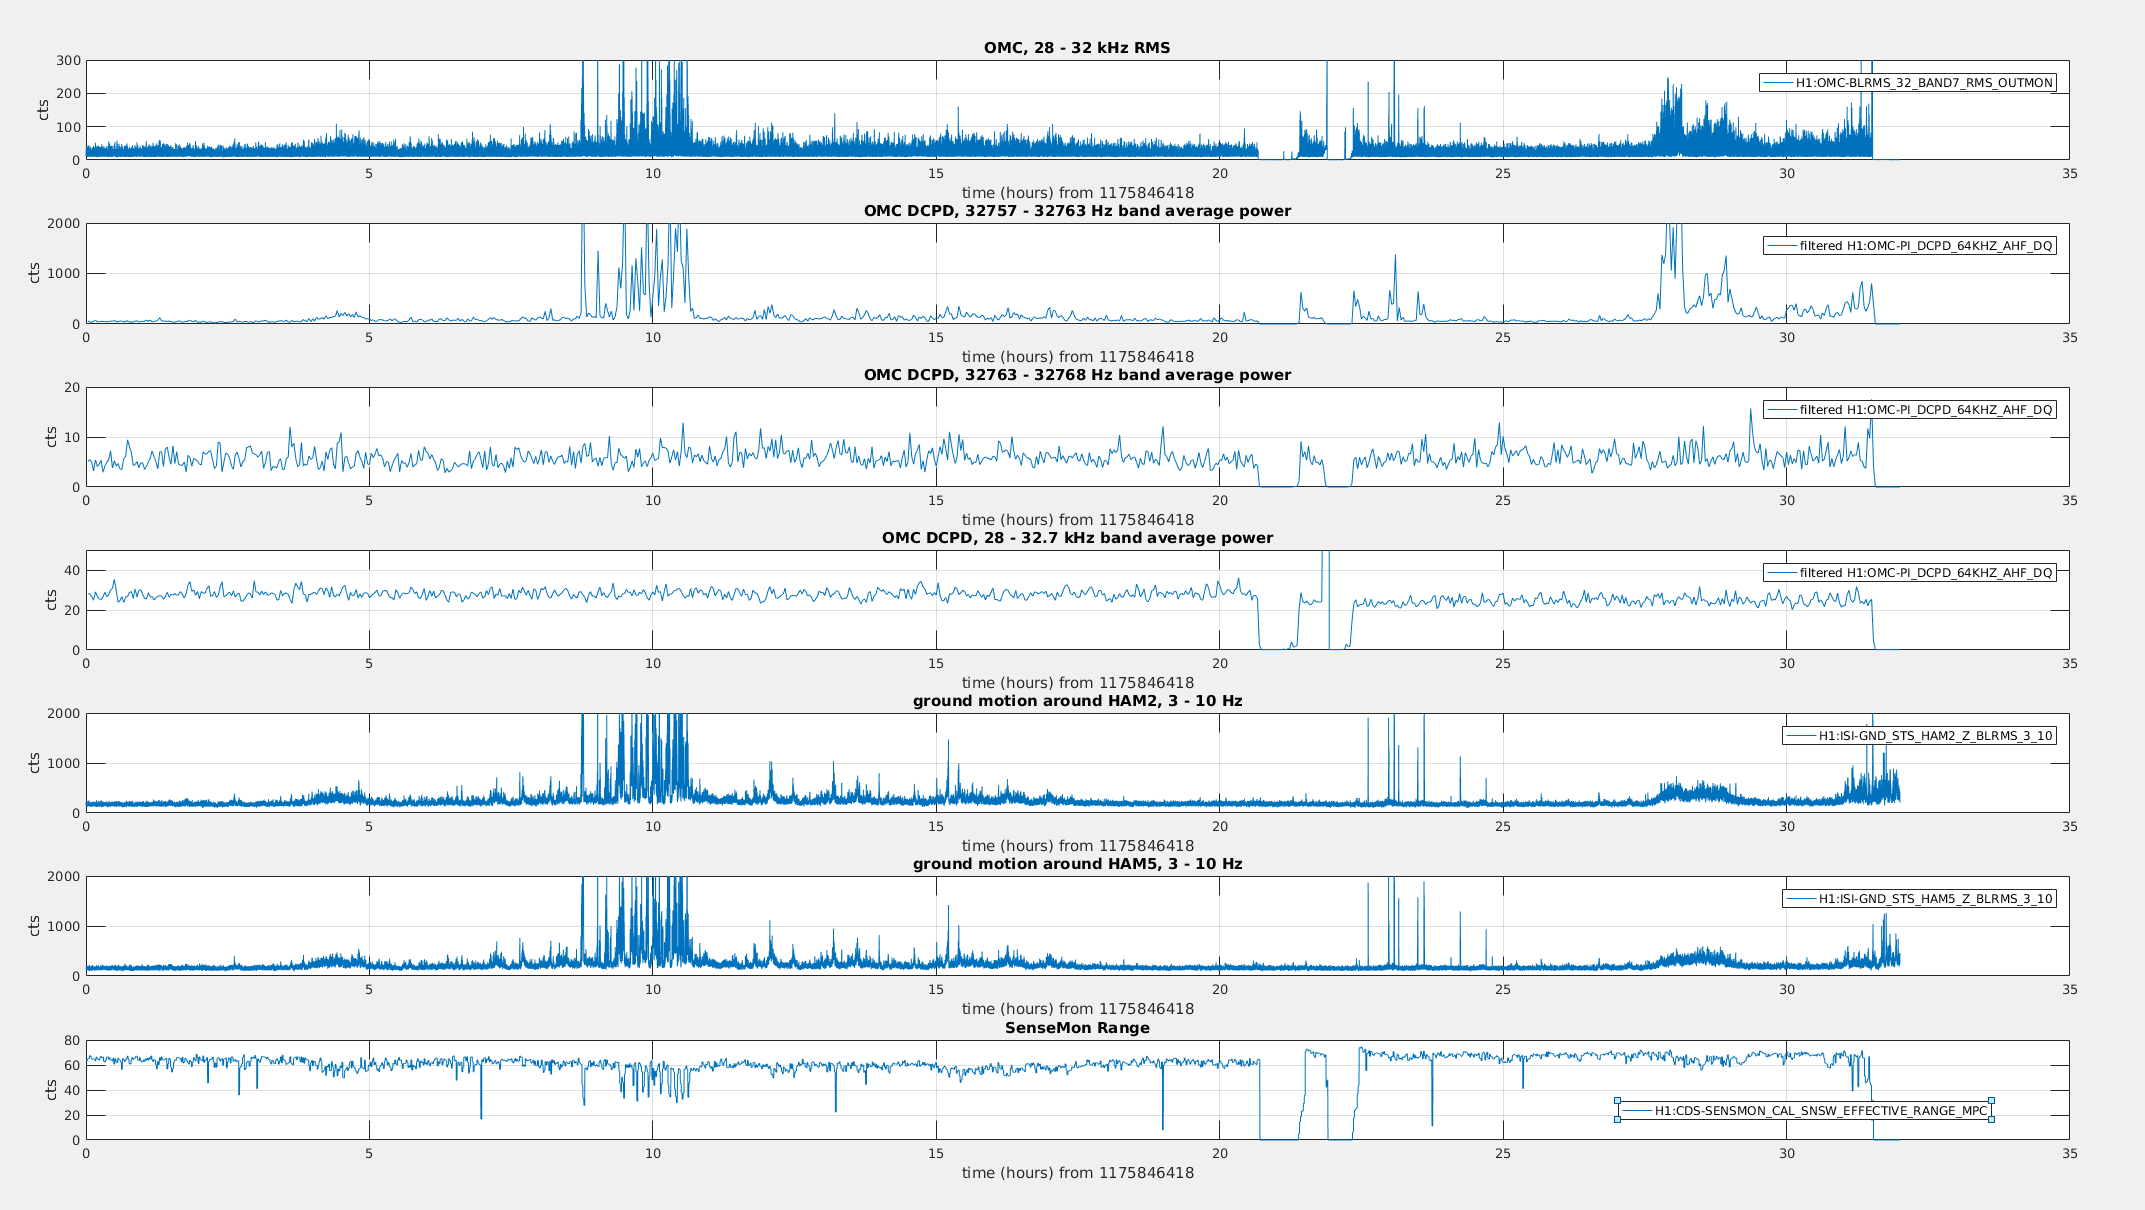
Thanks to the summary pages, I'd noticed that the 28 - 32 kHz PI band somewhat correlated with SenseMon range. I narrowed this correlation down to 3 - 30 Hz seismic motion (which we now know correlates with range due to input beam scattering) and PI ETMY Mode 23 aka ~32761 Hz. Correlation seems to be only with this mode, ruling out electronics coupling since a mode sensed right next door in frequency world has no hardware difference - both are sensed with H1:OMC-PI_DCPD_64KHZ_AHF_DQ. First attachment is 32 hr stretch showing correlation between narrow OMC-PI band, seismic, and range.
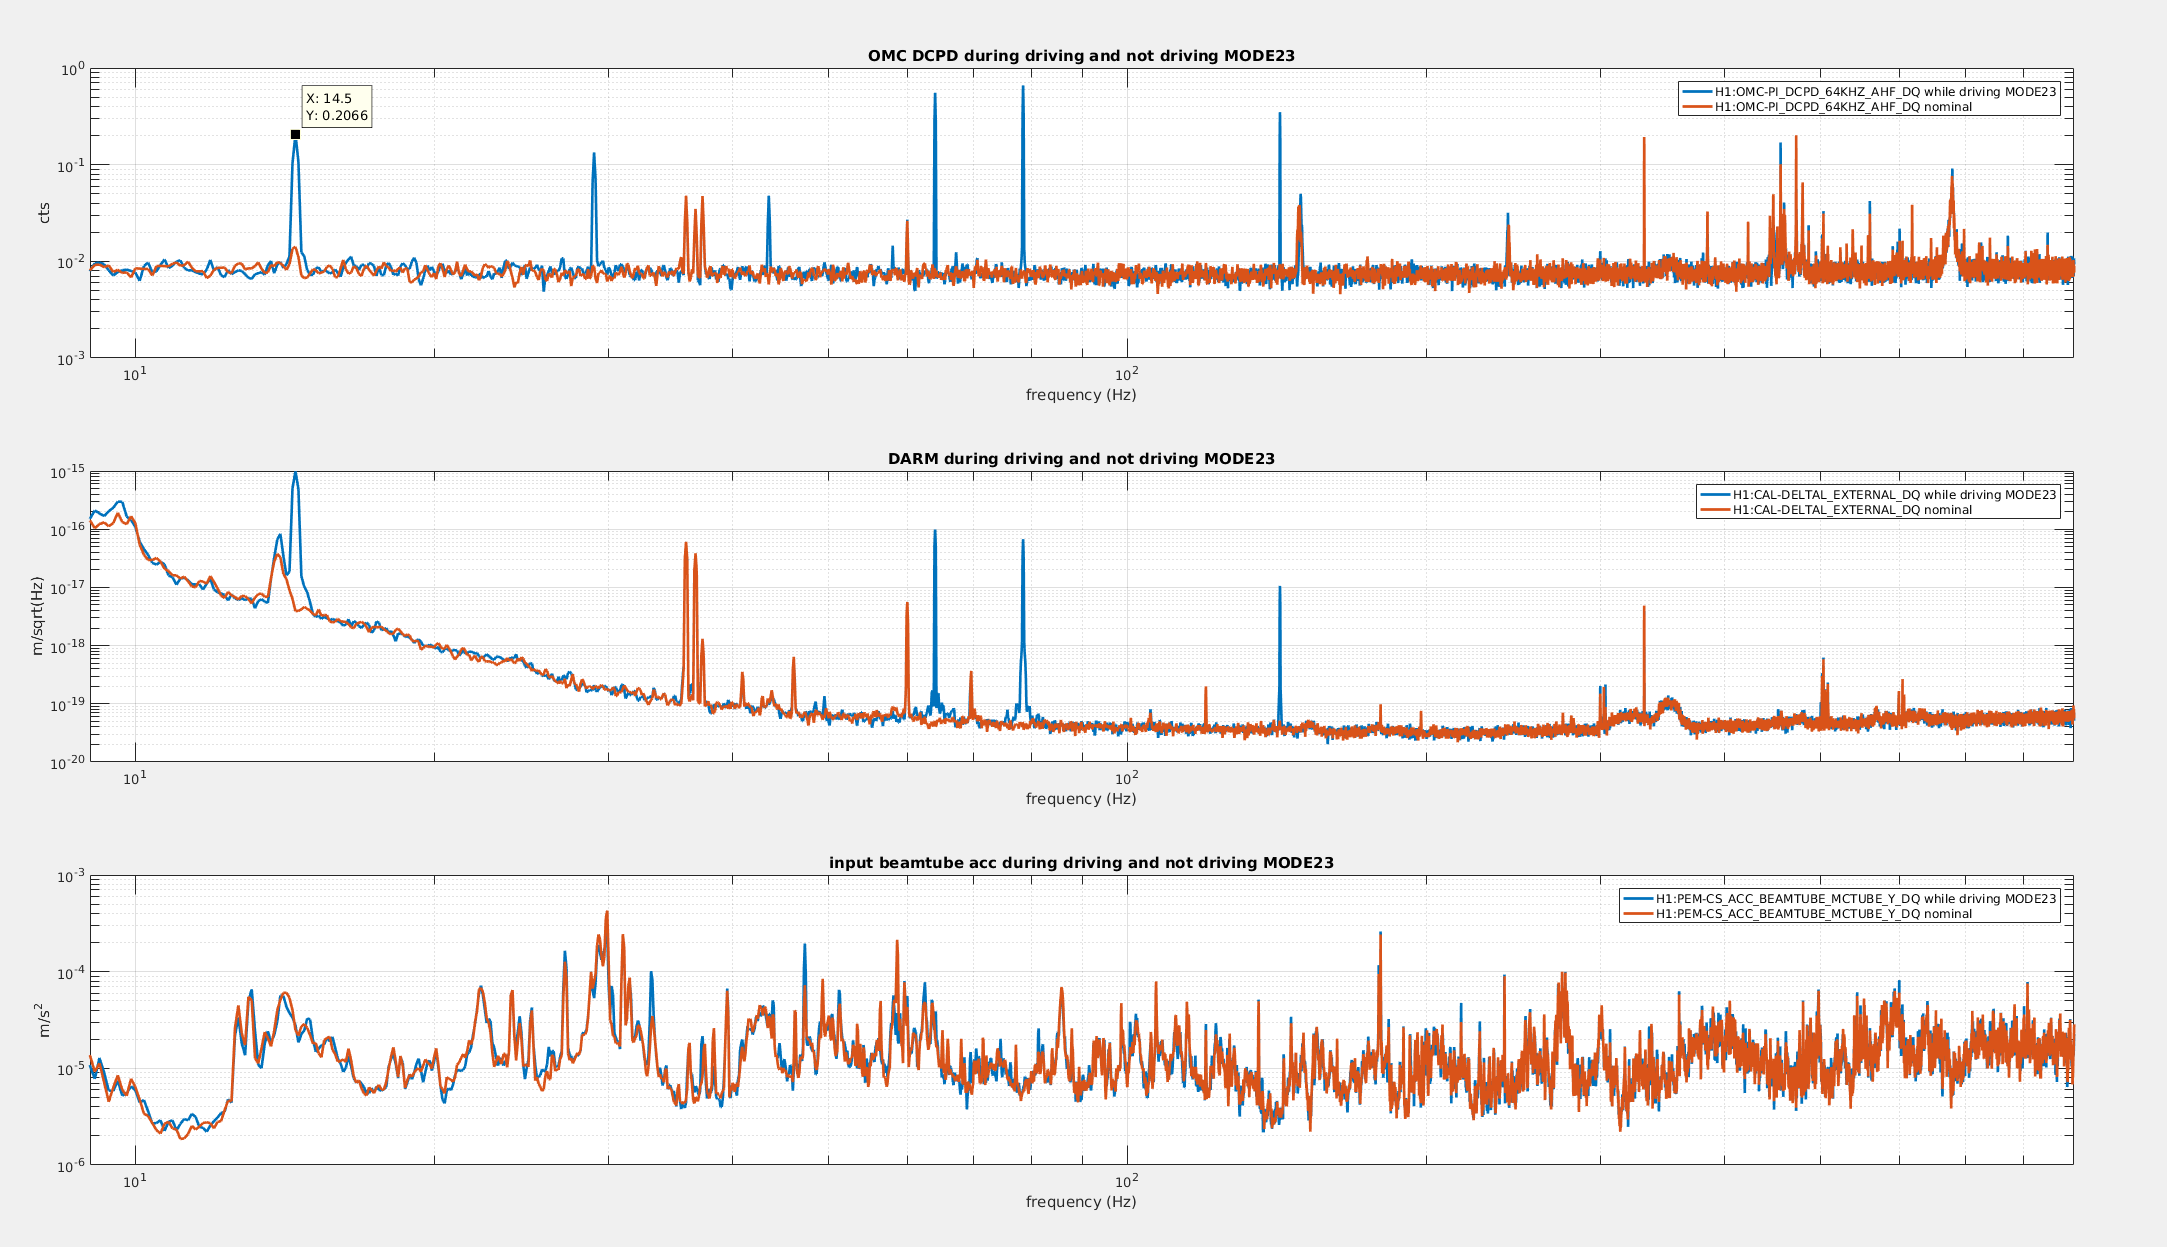
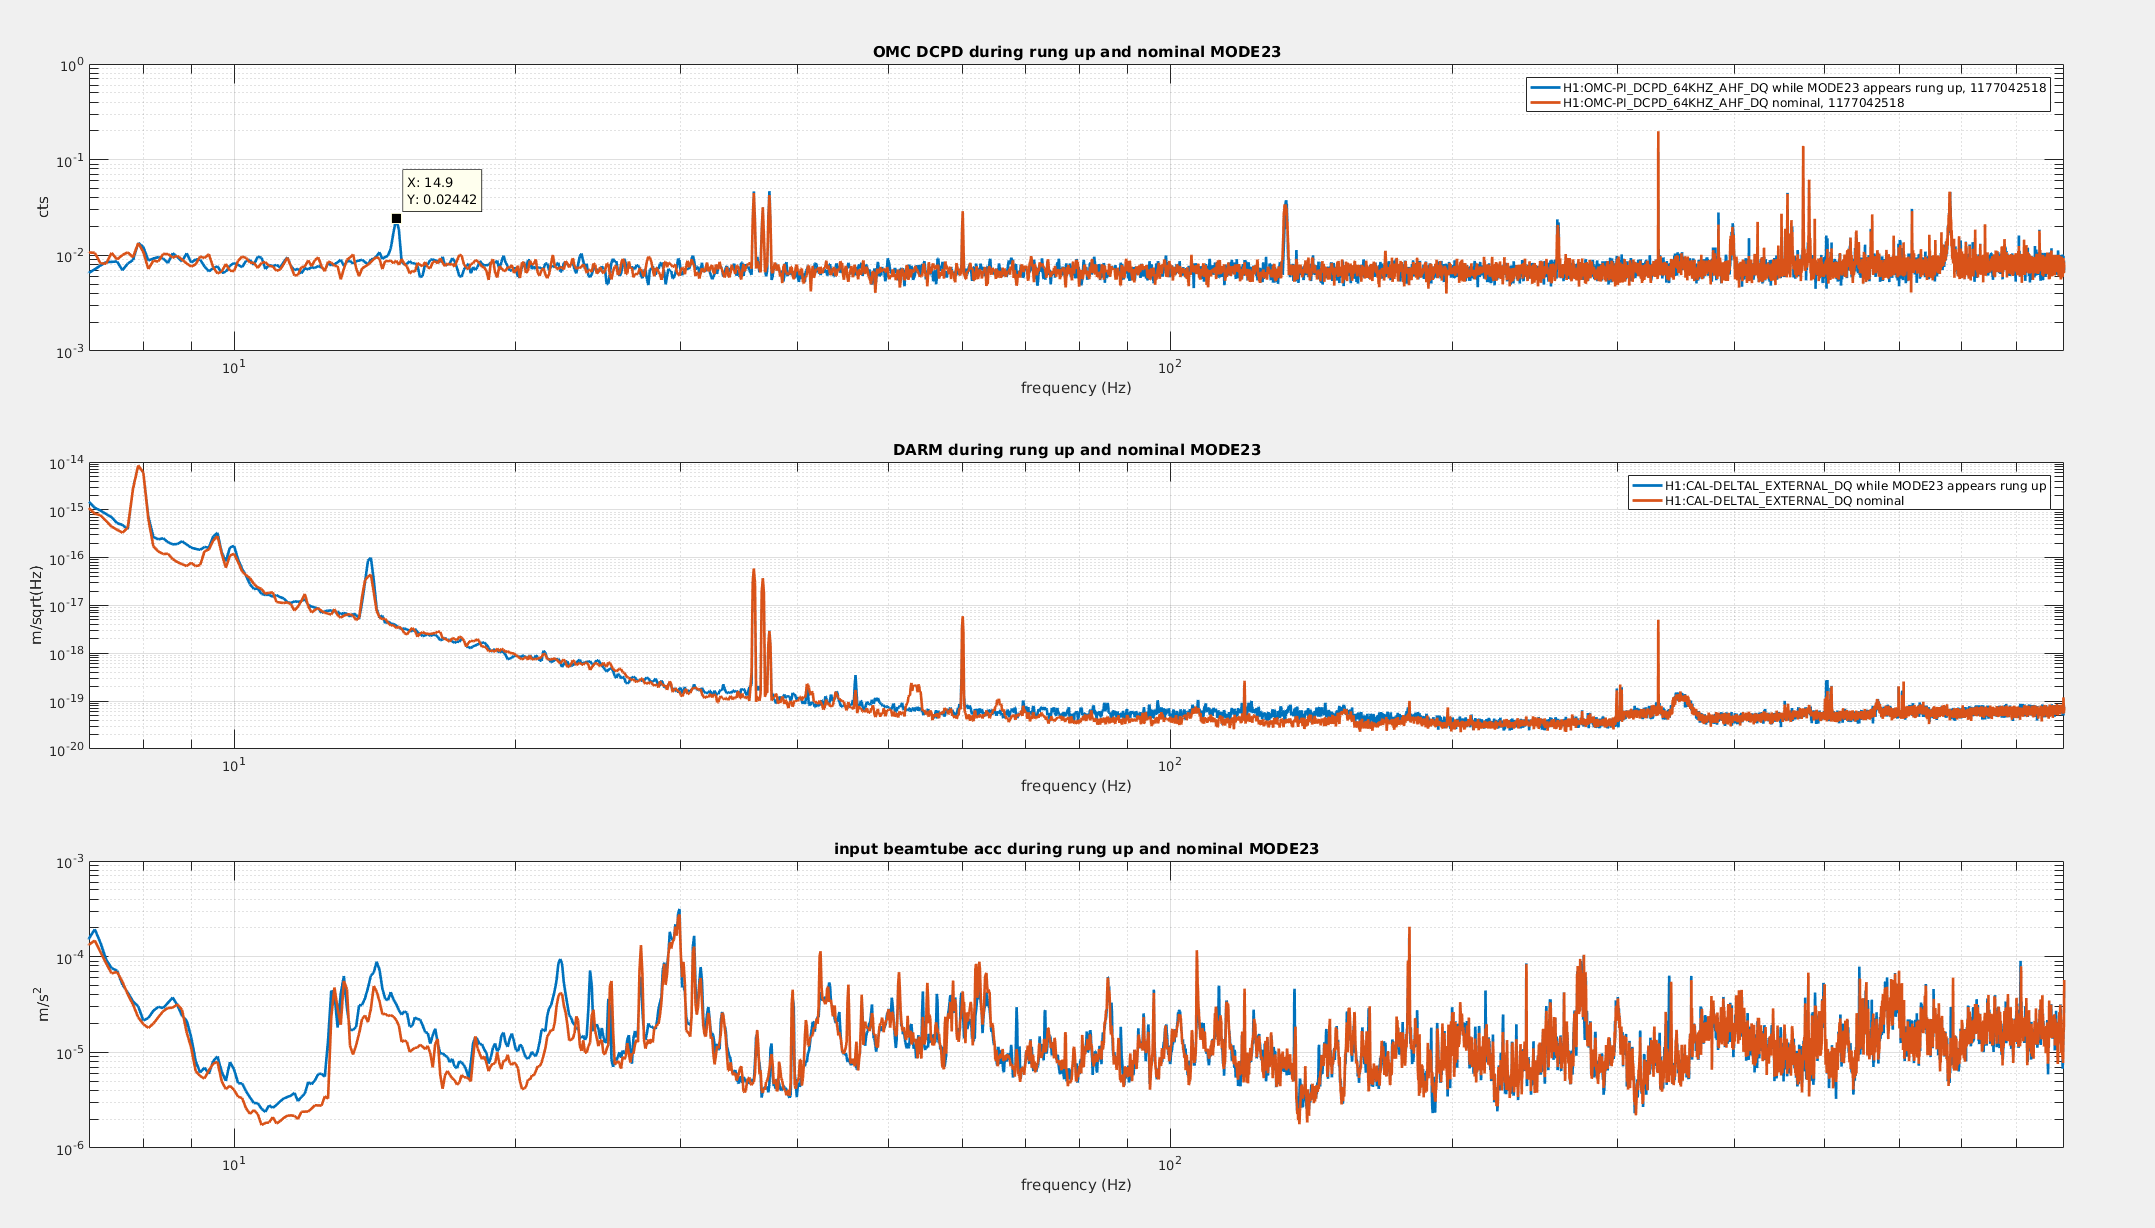
Kiwamu then did a drive/damp test of this mode and found narrow lines appeared in DARM while driving/damping well below saturation. Looking at the OMC channel, he actually saw just the first peak of a 14.5 Hz comb seen in OMC-PI, as well as 64, 78.5, 142.5 Hz lines. Second attachment shows comb while he was driving. This ~15 Hz comb is visible in OMC-PI anytime Mode23 is rung up enough (haven't quantified 'enough' yet) and first peak is always 2x the frequency difference of 32768 Hz (OMC-PI's Nyquist) and Mode23 frequency; I've confirmed this to within .01 Hz. Third attachment shows presence of first peak in comb during a typical day's Mode23 non-driven ring up. I haven't seen the other peaks Kiwamu saw (64, etc.) any other time.
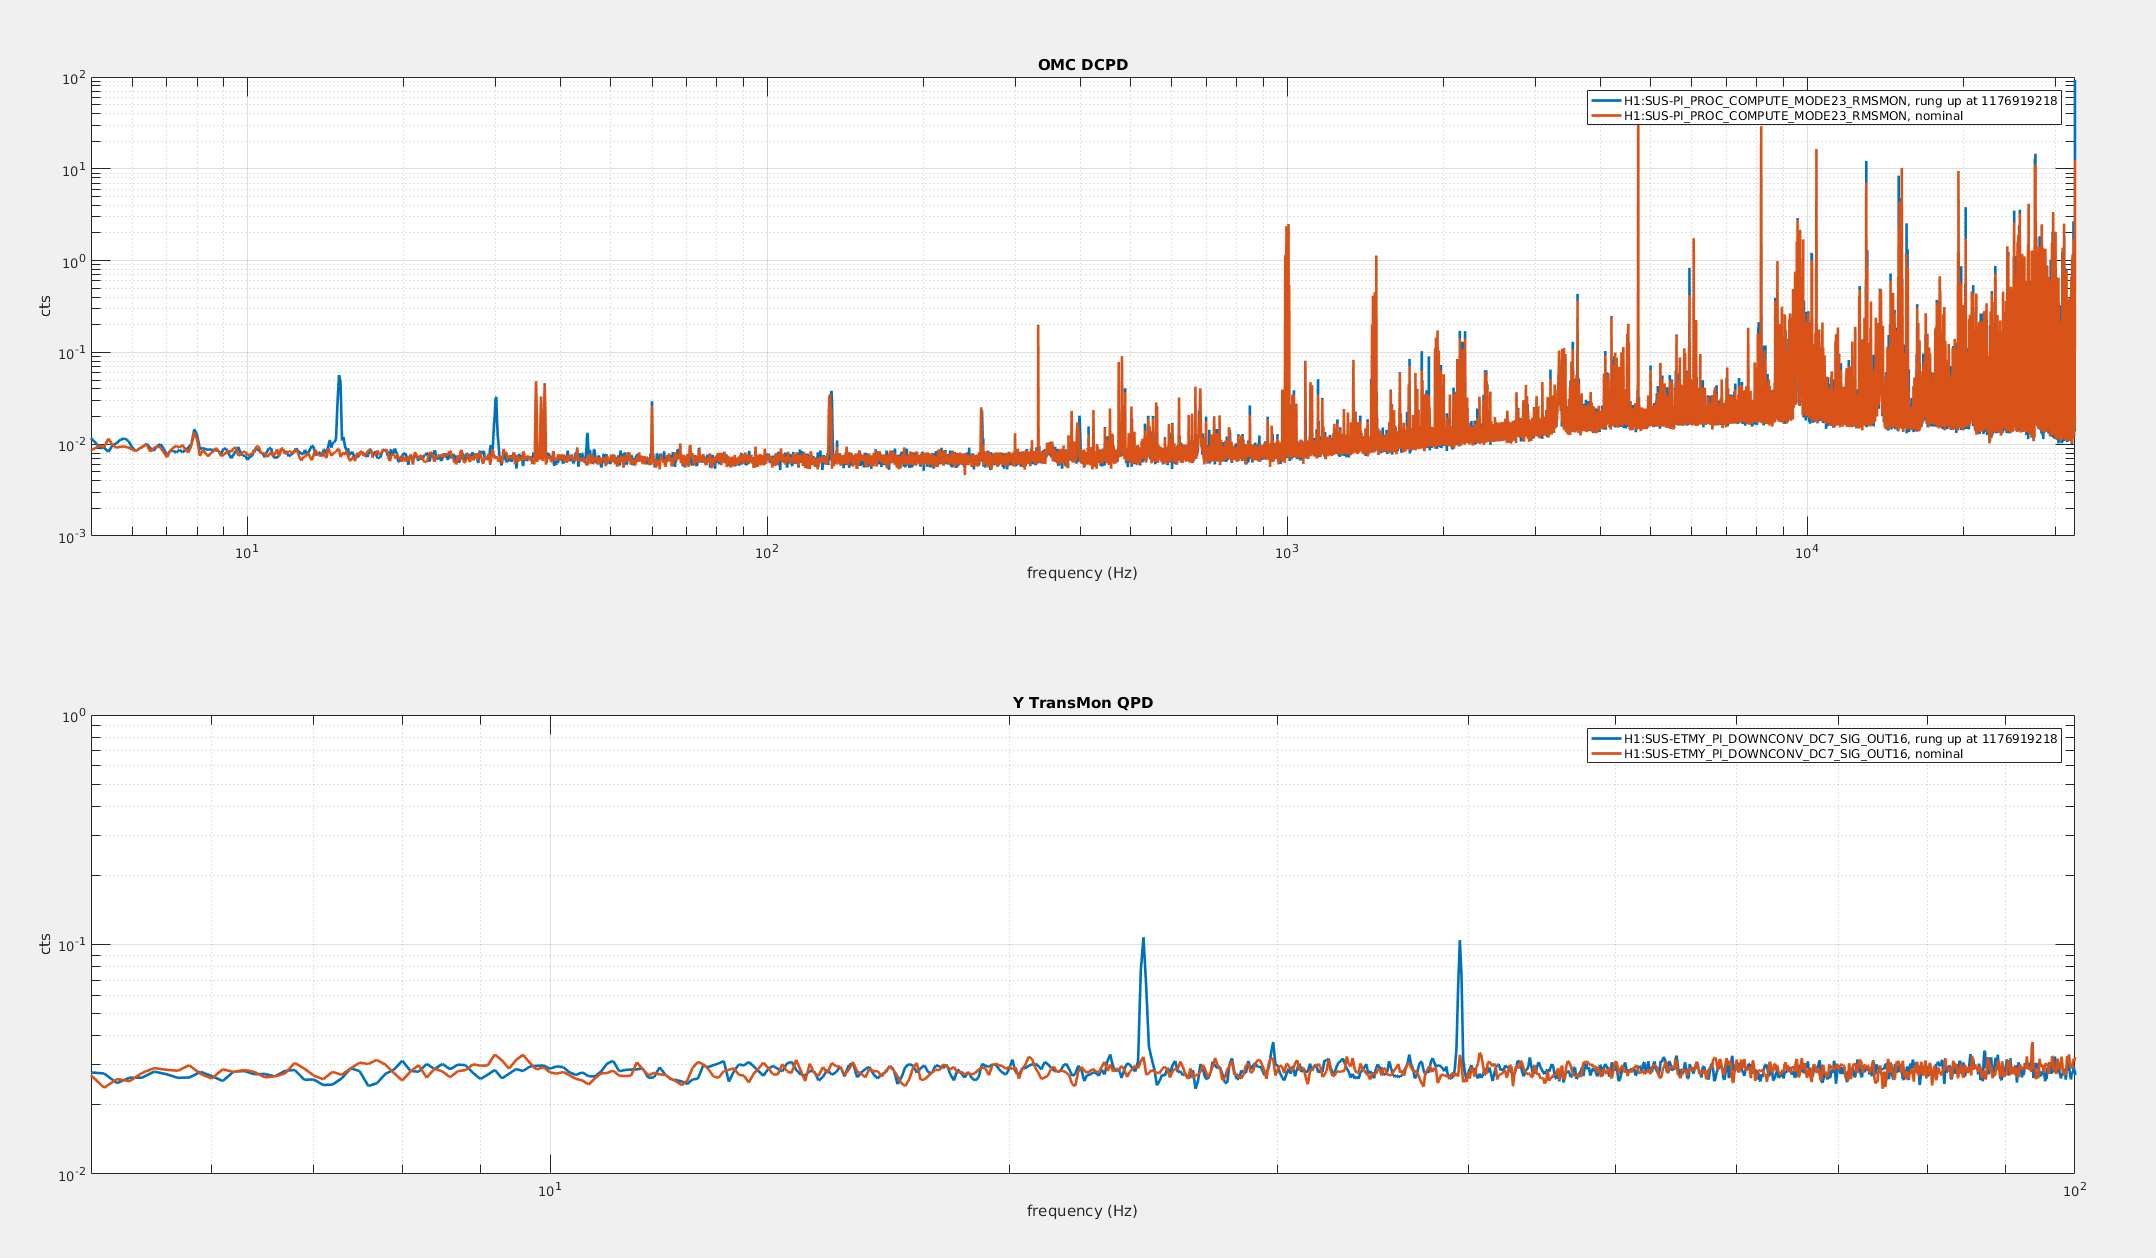
This is an actual mode ringing up (as opposed to just changing in sensing at OMC) as it's seen in the TransMon QPD's (and all feed forward is off for this mode). These have much lower SNR for PI so mode has to be unusually high to see. Fourth attachment shows a recent day with high 3 - 30 Hz seismic activity where amplitude correlations are visible everywhere. Fifth attachment shows spectrum during the peak just after 5 hours in previous attachment. Note that in TransMon channel, signal has been demoded with 32800 Hz, so two peaks are (32800 - 32761) = 39 Hz and (32800 + 32761 - 65536) = 25 Hz.