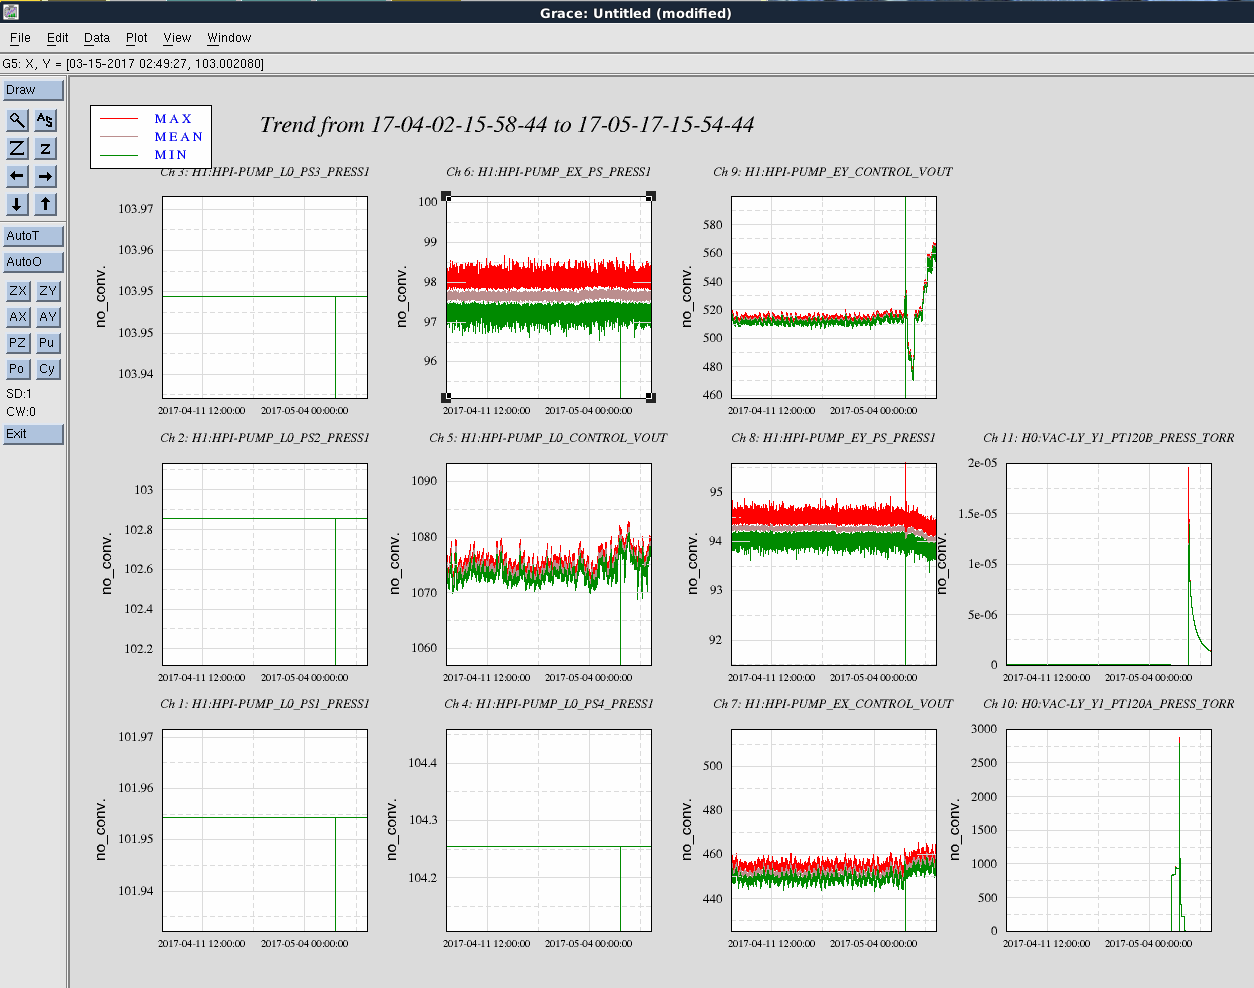
Attached is a trend plot of 45 days for the HEPI pumps. I included the pressure channels from the vertex, where we are currently pumping down after venting to view/clean ITMX. Changes in EY and EX Vout signals coincide with the vent, so possibly due to intentional changes.
Not sure if there were any intentional changes at the end station related to the vent that I'd think would impact these channels. The changes appeared related to post shutdown of the pumps to do the Accumulator charge check and I would be suspicious of the motor restart after the check. However, the pump speed is very dependent on the fluid temperature so looking at the VEA temps reveal a direct correlation with the pump speed, see related FMC log. I'll give facilities a couple more days to smooth things out before more action.