jeffrey.kissel@LIGO.ORG - posted 21:29, Tuesday 23 May 2017 (36360)
Z to RX/RY ISI ST1 CPS Tilt decoupling Measurements
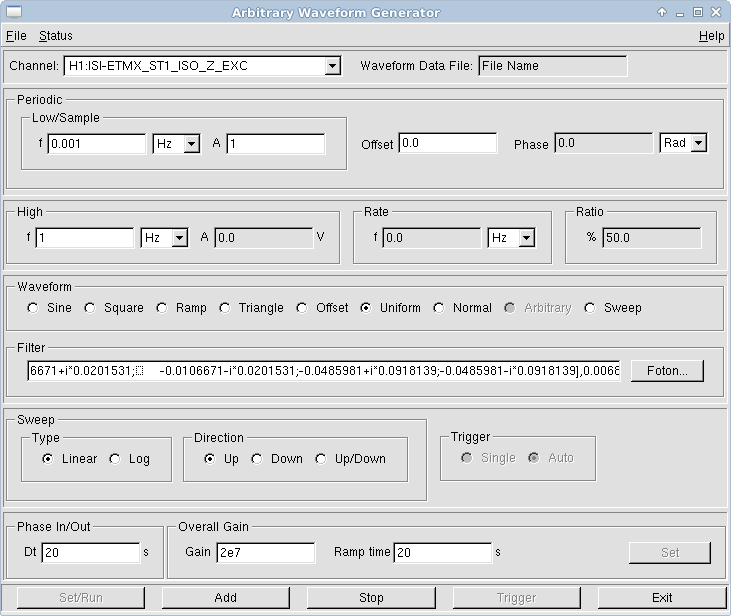
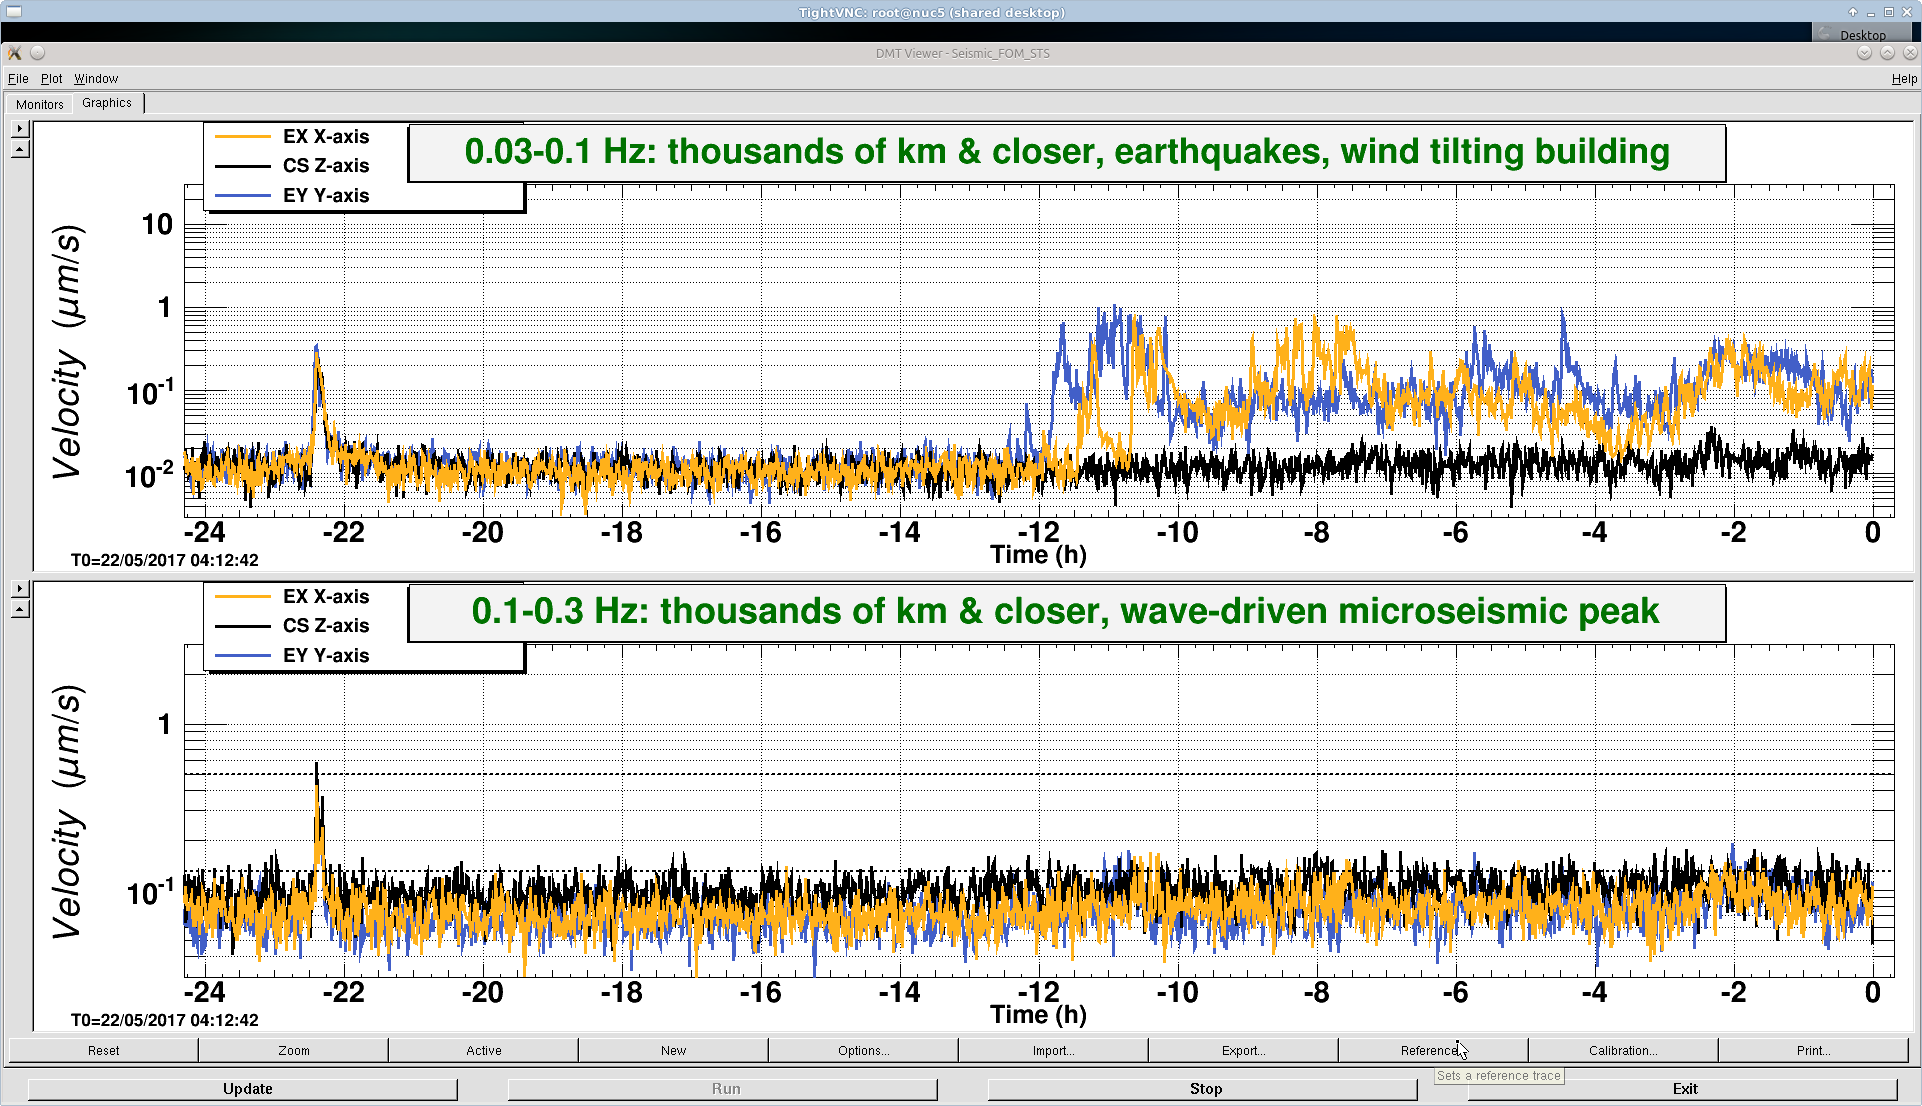
J. Kissel, J. Warner

Since we're running out of time before we re-open the arms, I offered a few of my computational cycles to gather some of the very-low-frequency transfer functions Jim's been trying to get over the past few days.

For the full story of what these transfer functions are and why they're needed, follow along in LHO aLOG 1158.
In summary, the SEI team has found excess low-frequency ST1 Z to X and Y coupling that has coherence with DARM below a few 100 mHz.
    - Krishna surmises that small generator constant / gain mismatch in a given ISIs T240s in the Z direction means
      that some fraction (at the 0.5% level) of the physical Z motion is getting translated into Tilt (RX and RY).
    - Because the ambient/physical RX/RY motion is much smaller than the abmient/physical Z motion (by a factor of
      50-200), then the Z * 0.5% appears to dominate the RX / RY signal at low frequency.
    - This excess errant tilt then couples via the usual g/w^2 into X and Y, pushing the platform errantly in the
      IFO's beam direction, coupling into DARM.
    - However, after some initial data analysis, they found that low frequency RX / RY motion is dominated by Z to
      RX / RY capacitive position sensor misalignment in the ISI.
So, these measurements serve to characterize this CPS misalignment, such that it can be corrected for and *then* we can get down to the T240 Z > RX/RY > X/Y coupling that Krishna suggests.
#it'salwaystilthorizontalcoupling

The first coefficient Jim has been able to calculate during this vent -- the ETMX Z to RX/RY coefficient = -0.0025 (H1:ISI-ETMX_ST1_CPSALIGN_6_4; which Jim admits is an eyeball of Rich's processing of his previous measurement in SEI aLOG 1170). He's shown me some preliminary, as-yet unpublished, data that suggests a reduction of a factor 5-10 (if memory serves), essentially eliminating the CPS misalignment effects. Good!

So, I gather more CPS plant characterization measurements for him so he can do it on every chamber.

The configuration of any given platform during the measurement:
    - CPS dominated, high-frequency blend filters ("Imp_Hi_Blend") on all DOFs for ST1
    - 250mHz,ellip blend filters on ST2 for X, Y, Z, RZ (RX/RY are never isolated)
    - Platform isolated as normal (ETMs / ITMs: fully isolated, BS: ST1 Isolated/ ST2 Damped.)
    - No sensor correction (neither HEPI Z or ISI X/Y)
    - Standard high frequency HEPI L4C ST0 to ST1 FF in all DOFs
    - Standard ST1 L4C/T240 blend FF to ST2 in Z (on ETMs / ITMs, not for isolated/damped BS)
Note, in order to switch *to* the "Imp_Hi_Blend" filters, you must turn off the isolation filters, switch the blends, then re-isolate. Returning from these blends to nominal, you can switch on the fly with the isolation loops closed.

The drive -- using awggui, run the following excitation:
    - 0.001 - 1 Hz Uniform excitation in the desired DOF's ISO bank EXC (e.g. H1:ISI-ETMX_ST1_ISO_RX_EXC)
    - Amplitude of 1 (no offset, not phase)
    - with a fancy-pants band-pass: zpk([0;0;0;0],
                                        [-0.00155743+i*0.0125715;
                                         -0.00155743-i*0.0125715;
                                         -0.0106671+i*0.0201531;
                                         -0.0106671-i*0.0201531;
                                         -0.0485981+i*0.0918139;
                                         -0.0485981-i*0.0918139],
                                        0.0068)
    - Phase In/Out = 20 sec
    - Gain = 1e5 for RX/RY, 2e7 for Z
    - Ramp Time = 20 sec
For as long as you'd like to get enough averages and/or for how much time you have time. I attach a screenshot of an example awggui session.

Here's a table of the measurements I was able to get this evening.
    Start       01:15 UTC    02:15 UTC    03:30 UTC    (All times in the UTC morning of May 24 2017, or PDT evening of May 23 2017)
    End         02:10 UTC    03:10 UTC    04:25 UTC
    Duration    00:55 min    0:55 min     00:55 min

    ETMX        RX (1e5)     Z  (2e7)
    ETMY        RX (1e5)     RY (1e5)
    BS                       Z  (2e7)     RX (1e5)

Notes for Jim / Data Analysts:
    - There's a few minutes padding around all the times while the platform was in the excited configuration, so you may be able to squeak a few more averages out of the data if you're desperate.
    - The ISI BS watchdog tripped as I was ramping off the Z excitation -- did it too quickly; that's why it took me longer to get on to the next RX/RY DOF.
    - Low frequency ground motion has noticable amounts of wind excitation over the entire duration of these measurements; not sure if it impacts the measurement at all, but I figured I'd mention it since that's the frequency region in which you're characterizing the CPS.
    - Sorry -- didn't get ISI BS RY, wanted to go home.

Once measurements were complete, I've restored the platforms to their nominal O2 configuration (as per G1700245):
    - Quite_250, 250 mHz blend filters on ST1 in X Y RX, RY, RZ, with Quite_90, 90 mHz blends on ST1 Z
    - 250mHz,ellip blend filters on ST2 for X, Y, Z, RZ (RX/RY are never isolated)
    - Platform isolated as normal (ETMs / ITMs: fully isolated, BS: ST1 Isolated/ ST2 Damped.)
    - ISI X/Y broadband sensor correction, with assistance from beam-direction BRS where applicable
    - Standard high frequency HEPI L4C ST0 to ST1 FF in all DOFs
    - Standard ST1 L4C/T240 blend FF to ST2 in Z (on ETMs / ITMs, not for isolated/damped BS)
Images attached to this report