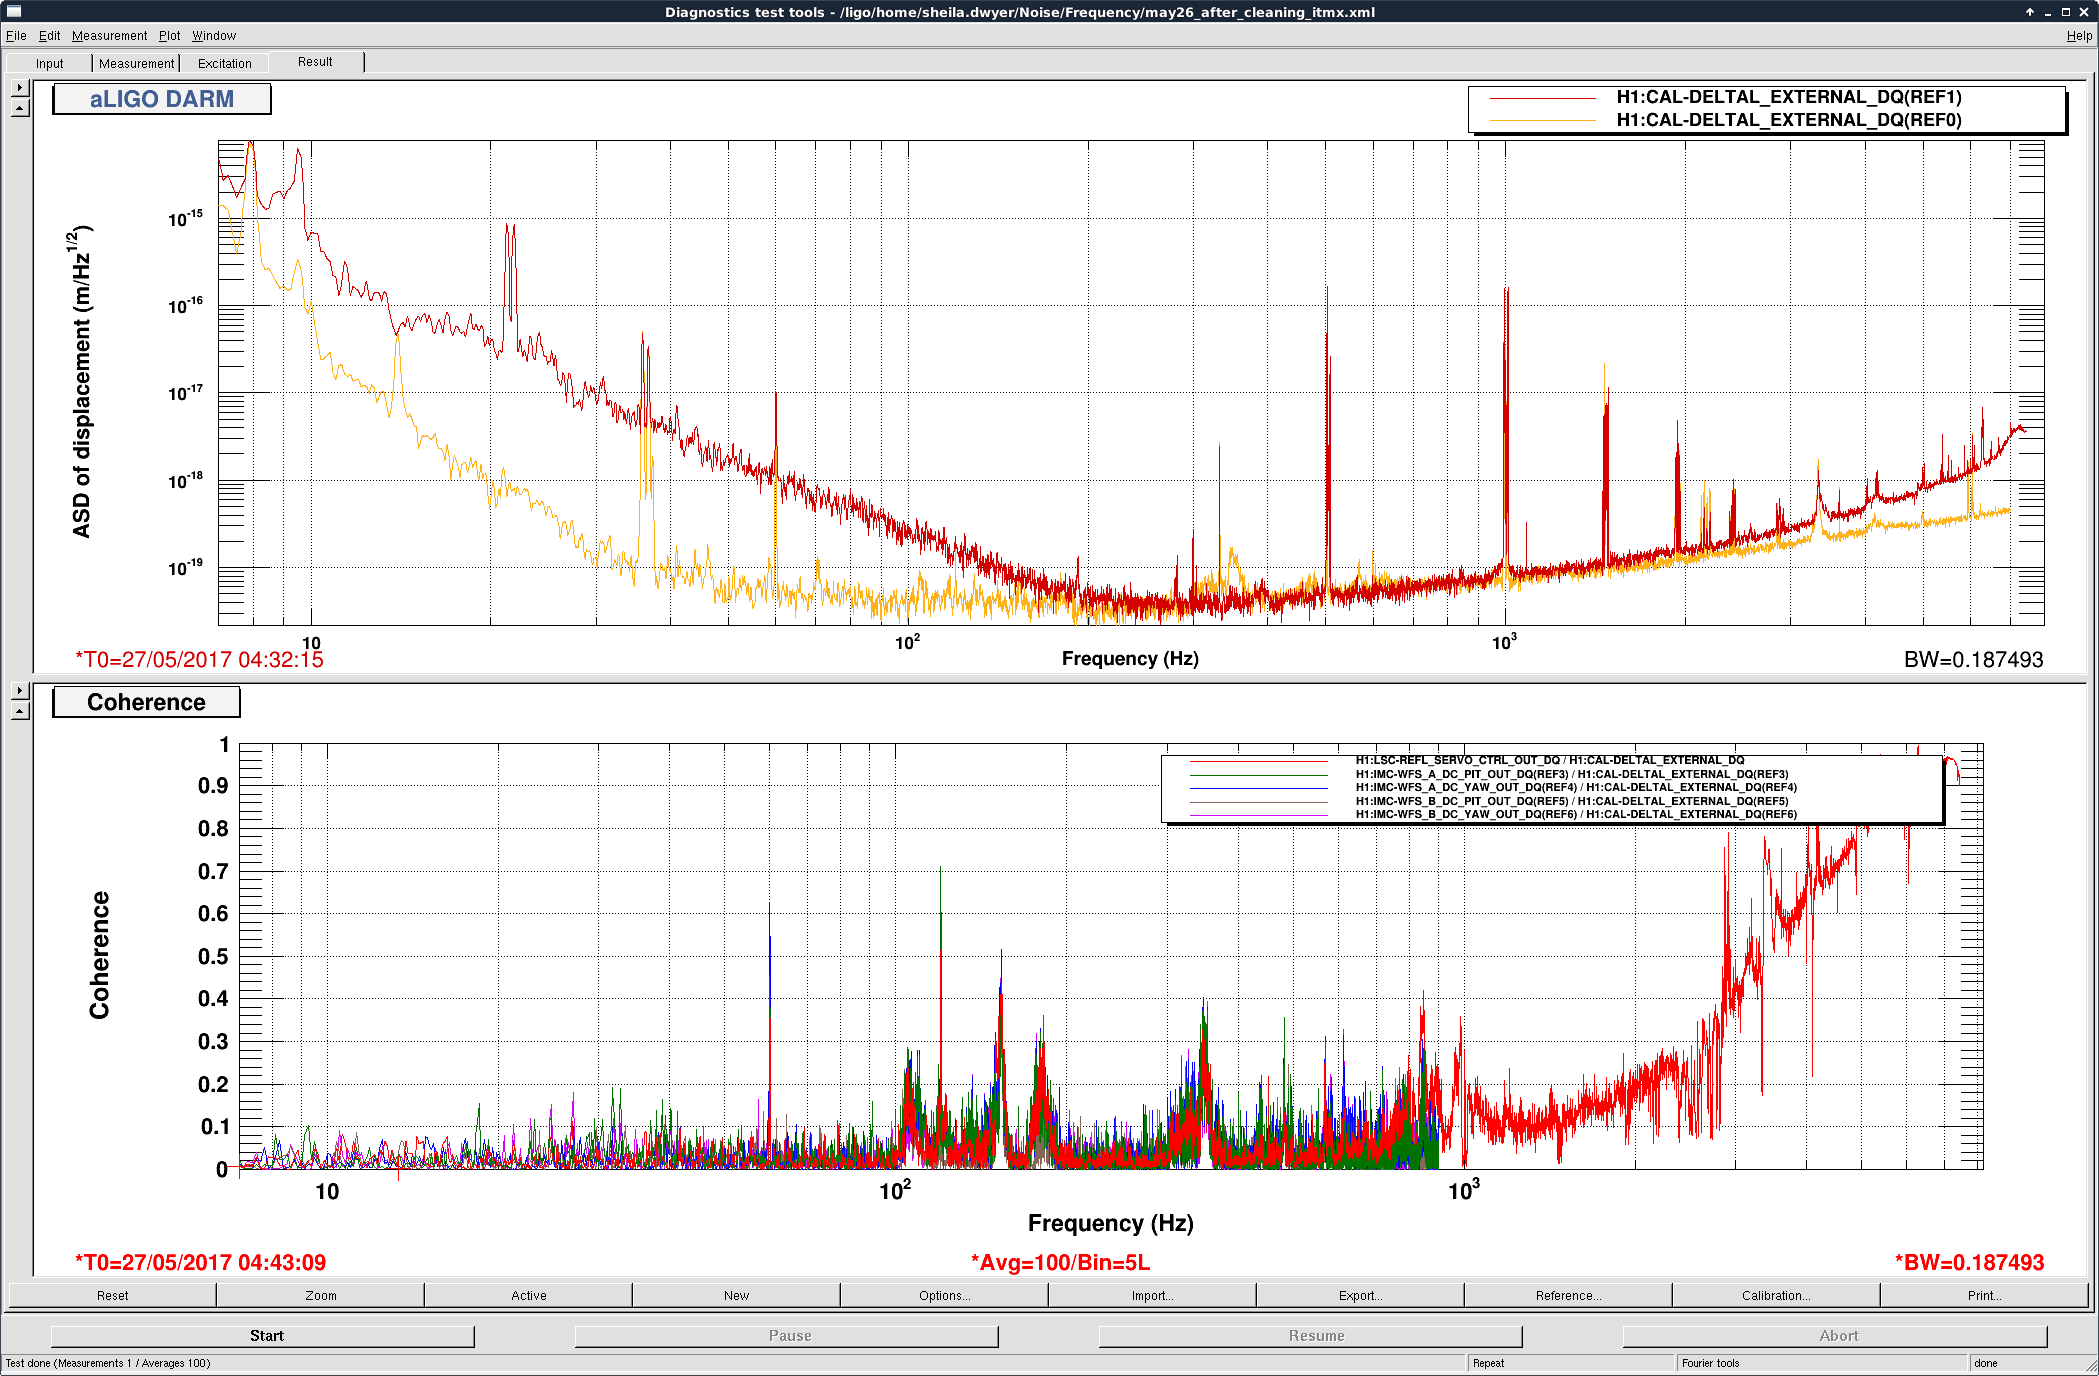
Sheila D., Patrick T.

Reached 26 W at approximately 04:13 UTC. Increased CSOFT gain by 3dB. This seems to have improved the stability. Lines just above 20 Hz are from a2l script. Frequency noise is high above 2kHz. Jitter noise appears better.

- After resetting the alignment references earlier today, we had several lockloses in the state CARM 5PM. Patrick and I got through it once by going slowly, so I have increased the ramp time from 5 seconds to 15.
- The alignment references do seem good: we locked with a recycling gain of 32 and the ASC came on without any problems or pulling the alignment around much.
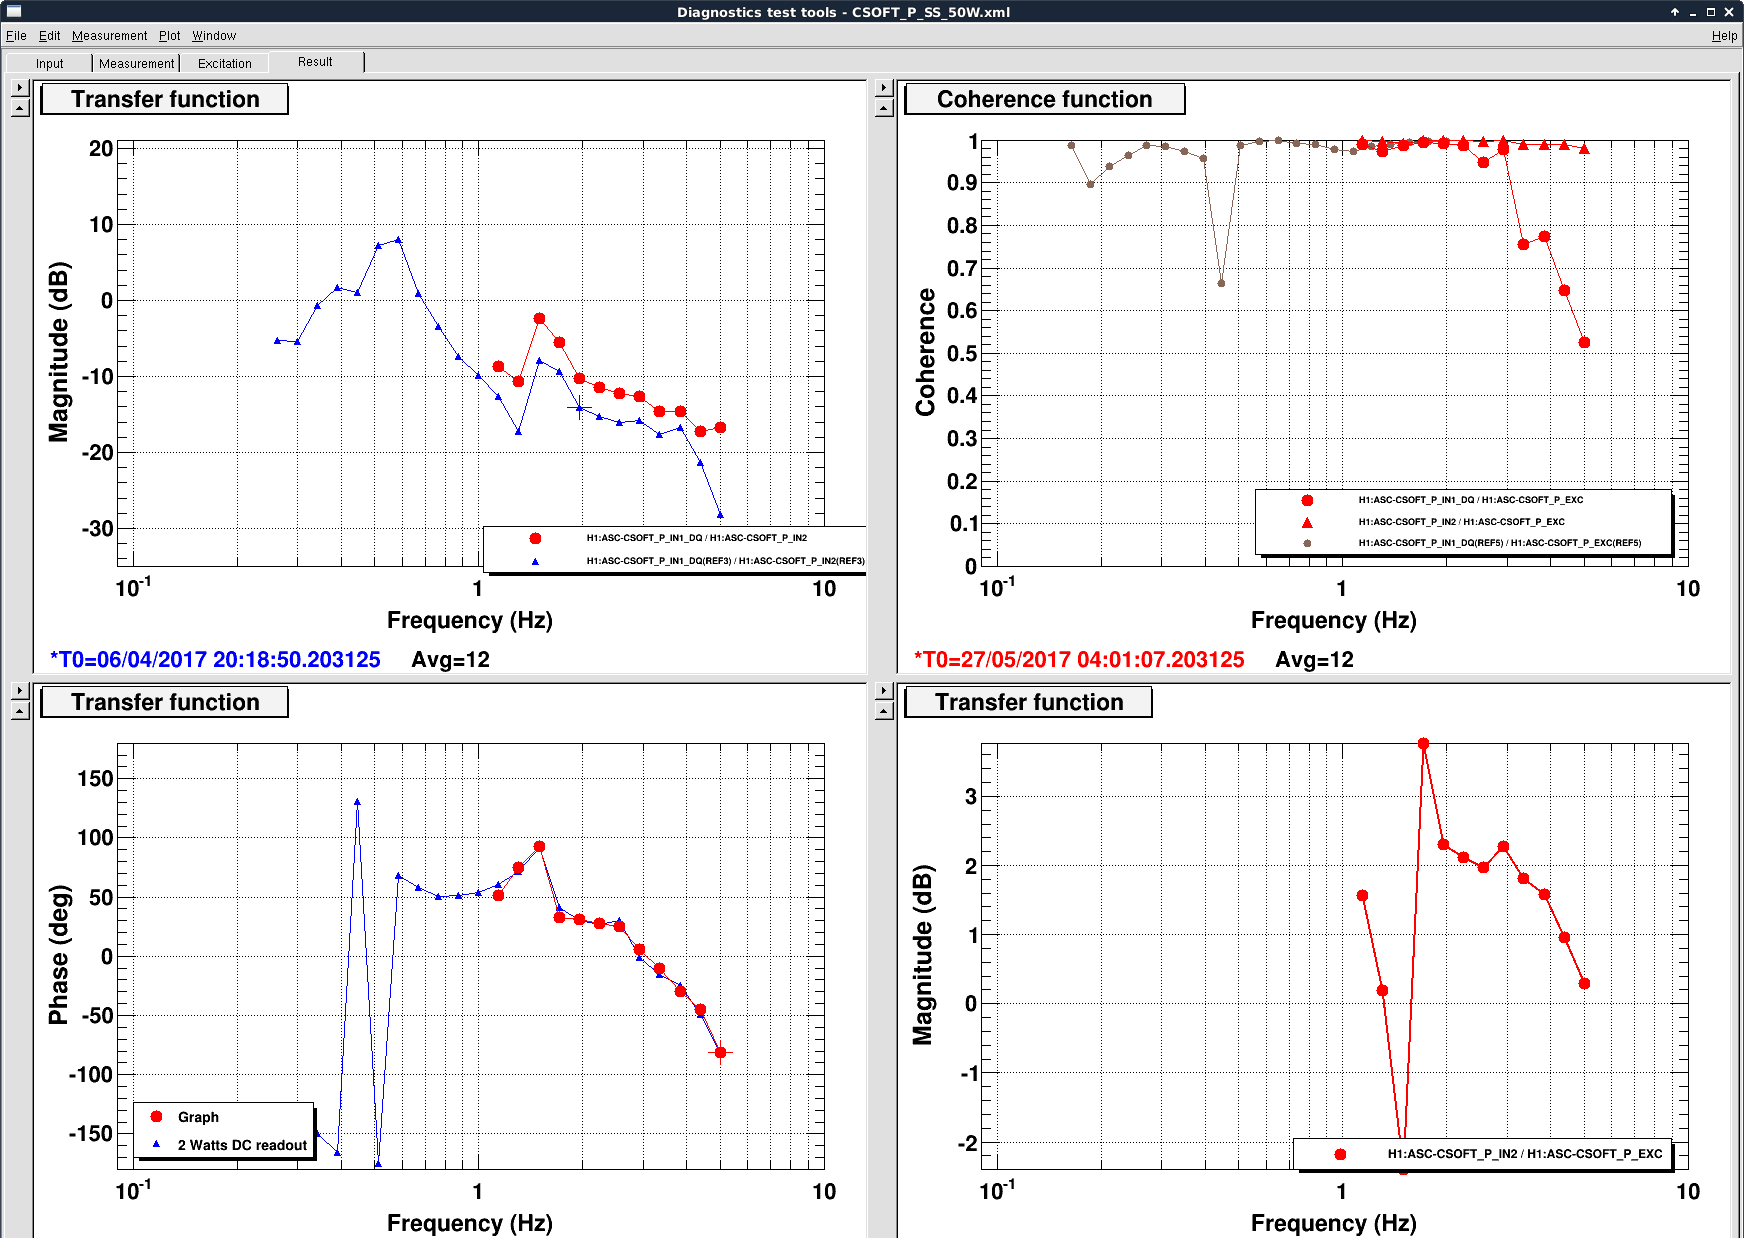
- We increased the CSOFT gain because our first 26Watt lock tonight we lost because of the CSOFT instability. This is in the guardian, the measurement attached shows the reference (gain 0.4 and the new measurement gain 0.6)
- The jitter coupling is much better than it was before the vent. You can compare the coherence that Patrick posted above to the one that Keita posted
- The frequency noise is much worse.
- We ran a2l and after we were satisfied that we weren't going to see the CSOFT instability again we moved on to low noise. We lost lock right after the beam diverters closed, although it could have been due to an alignment problem.
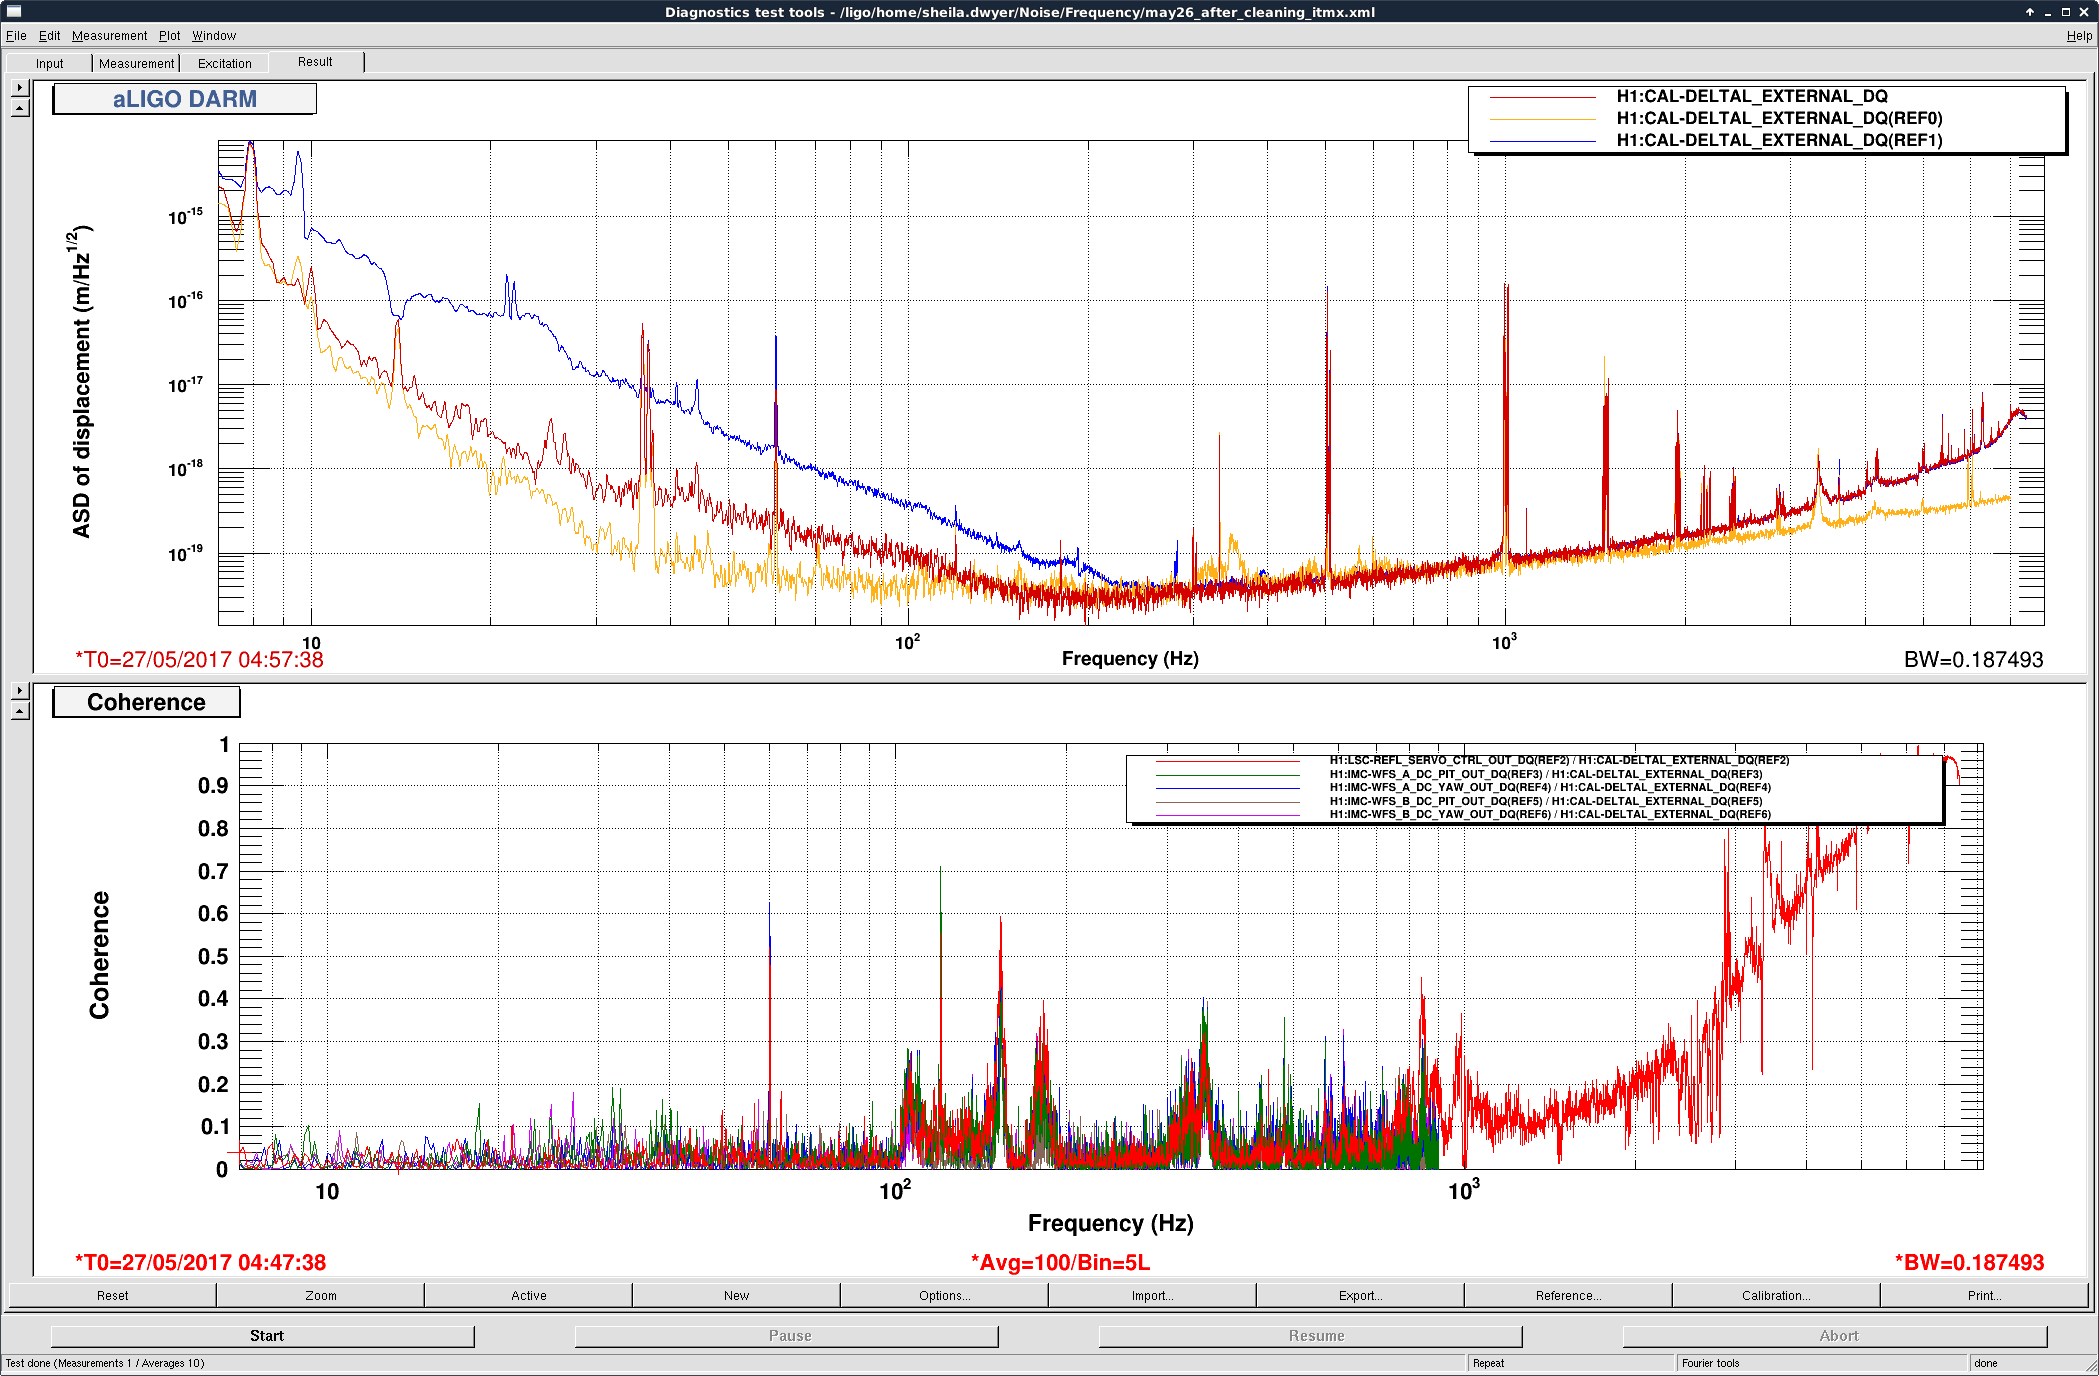
The second screenshot attached is the same as Patricks plot with the best spectrum that we got just before loosing lock.
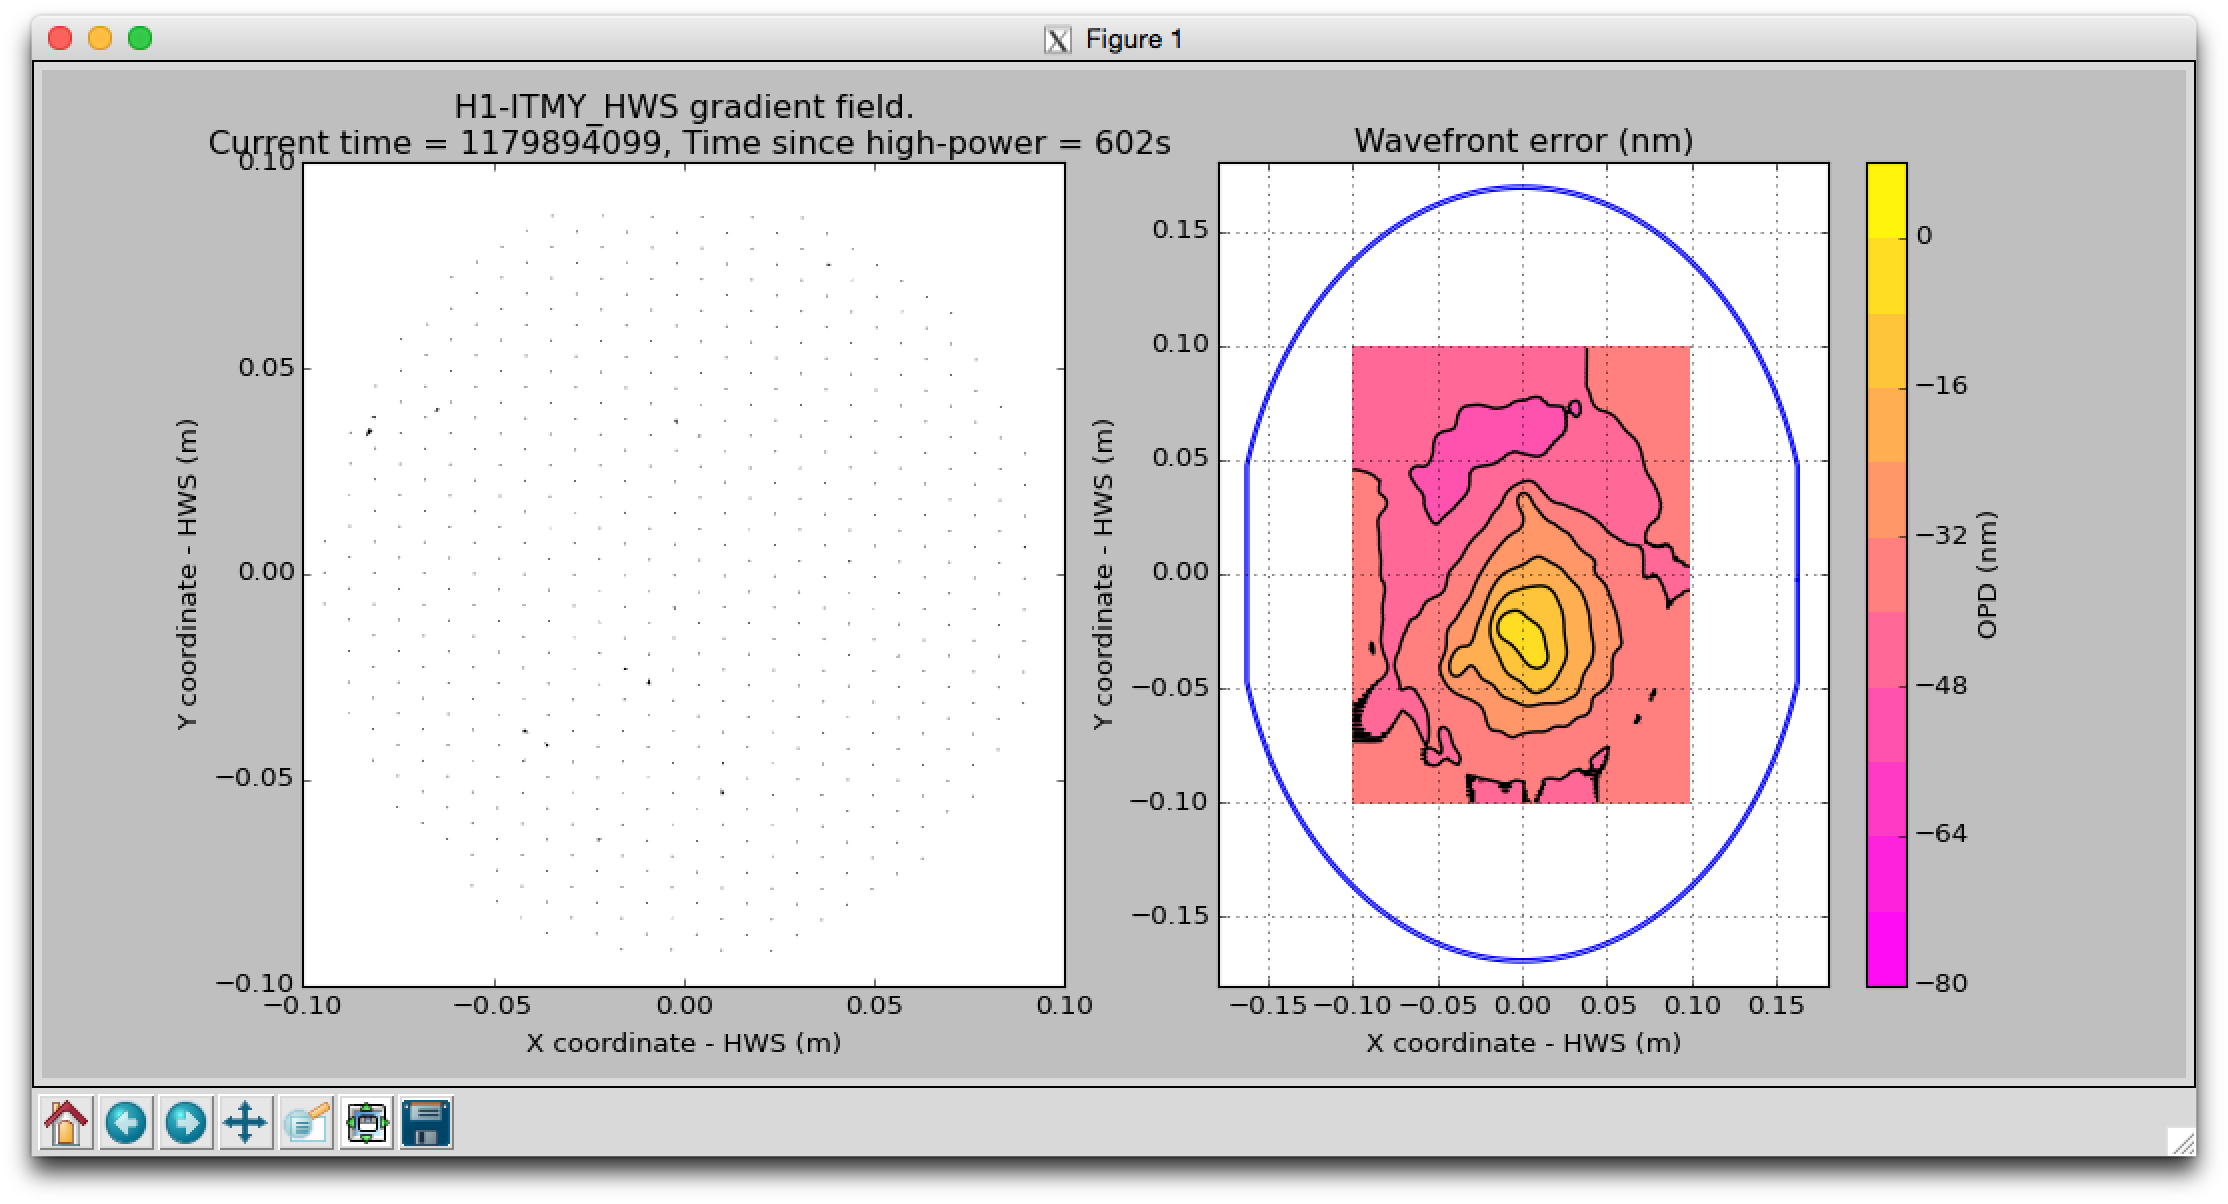
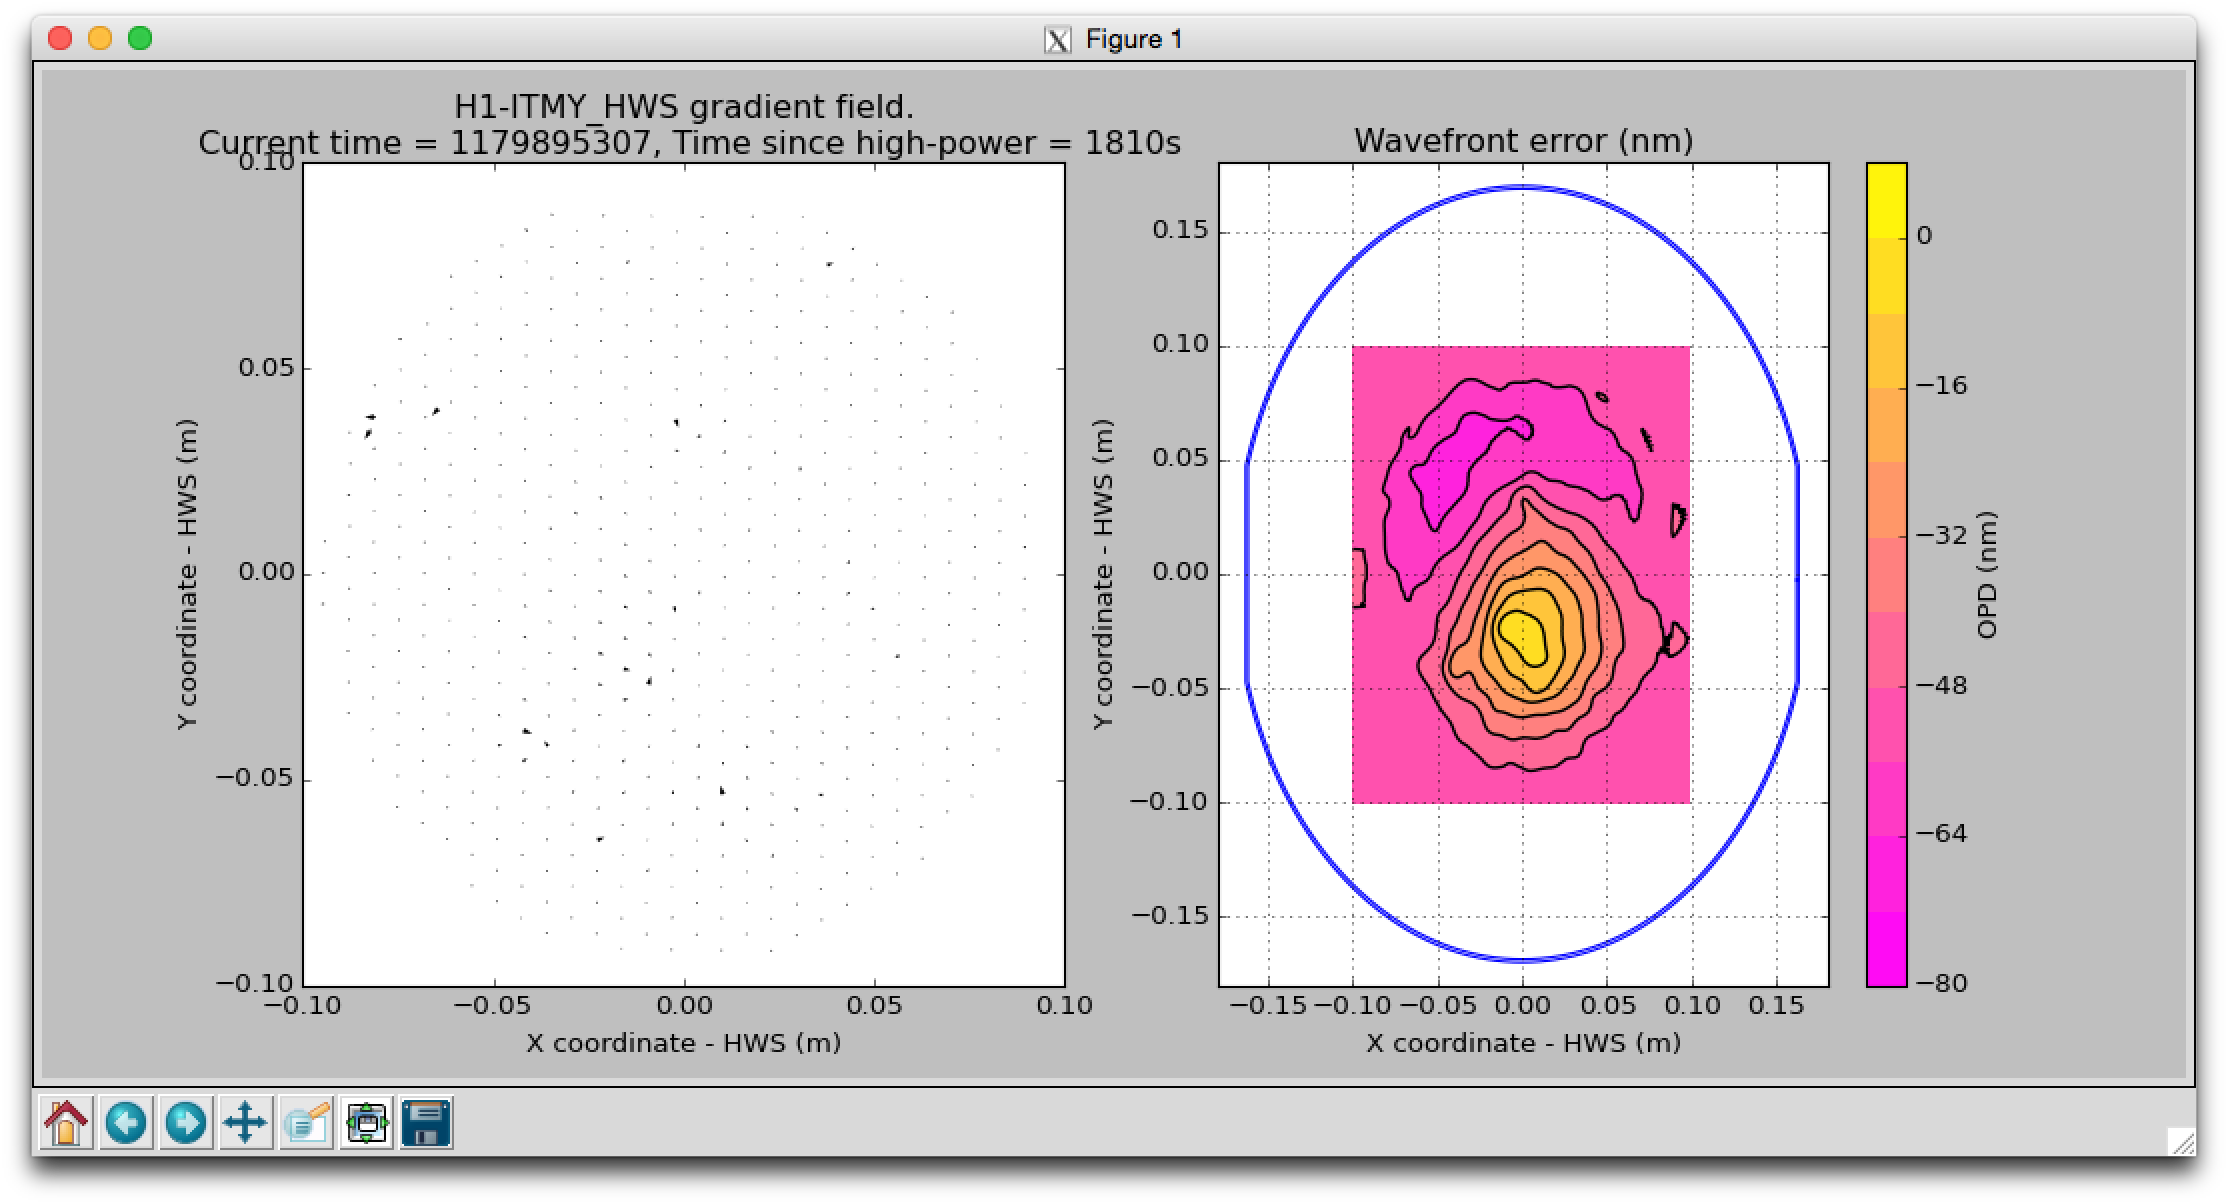
Here are the Hartmann sensor measurements from this time. The ITMY thermal lens looks to be around 10cm in diameter, or roughly the same spatial scale as the IFO beam. This, and the lack of any strong localized features, is consistent with only uniform absorption on this optic.
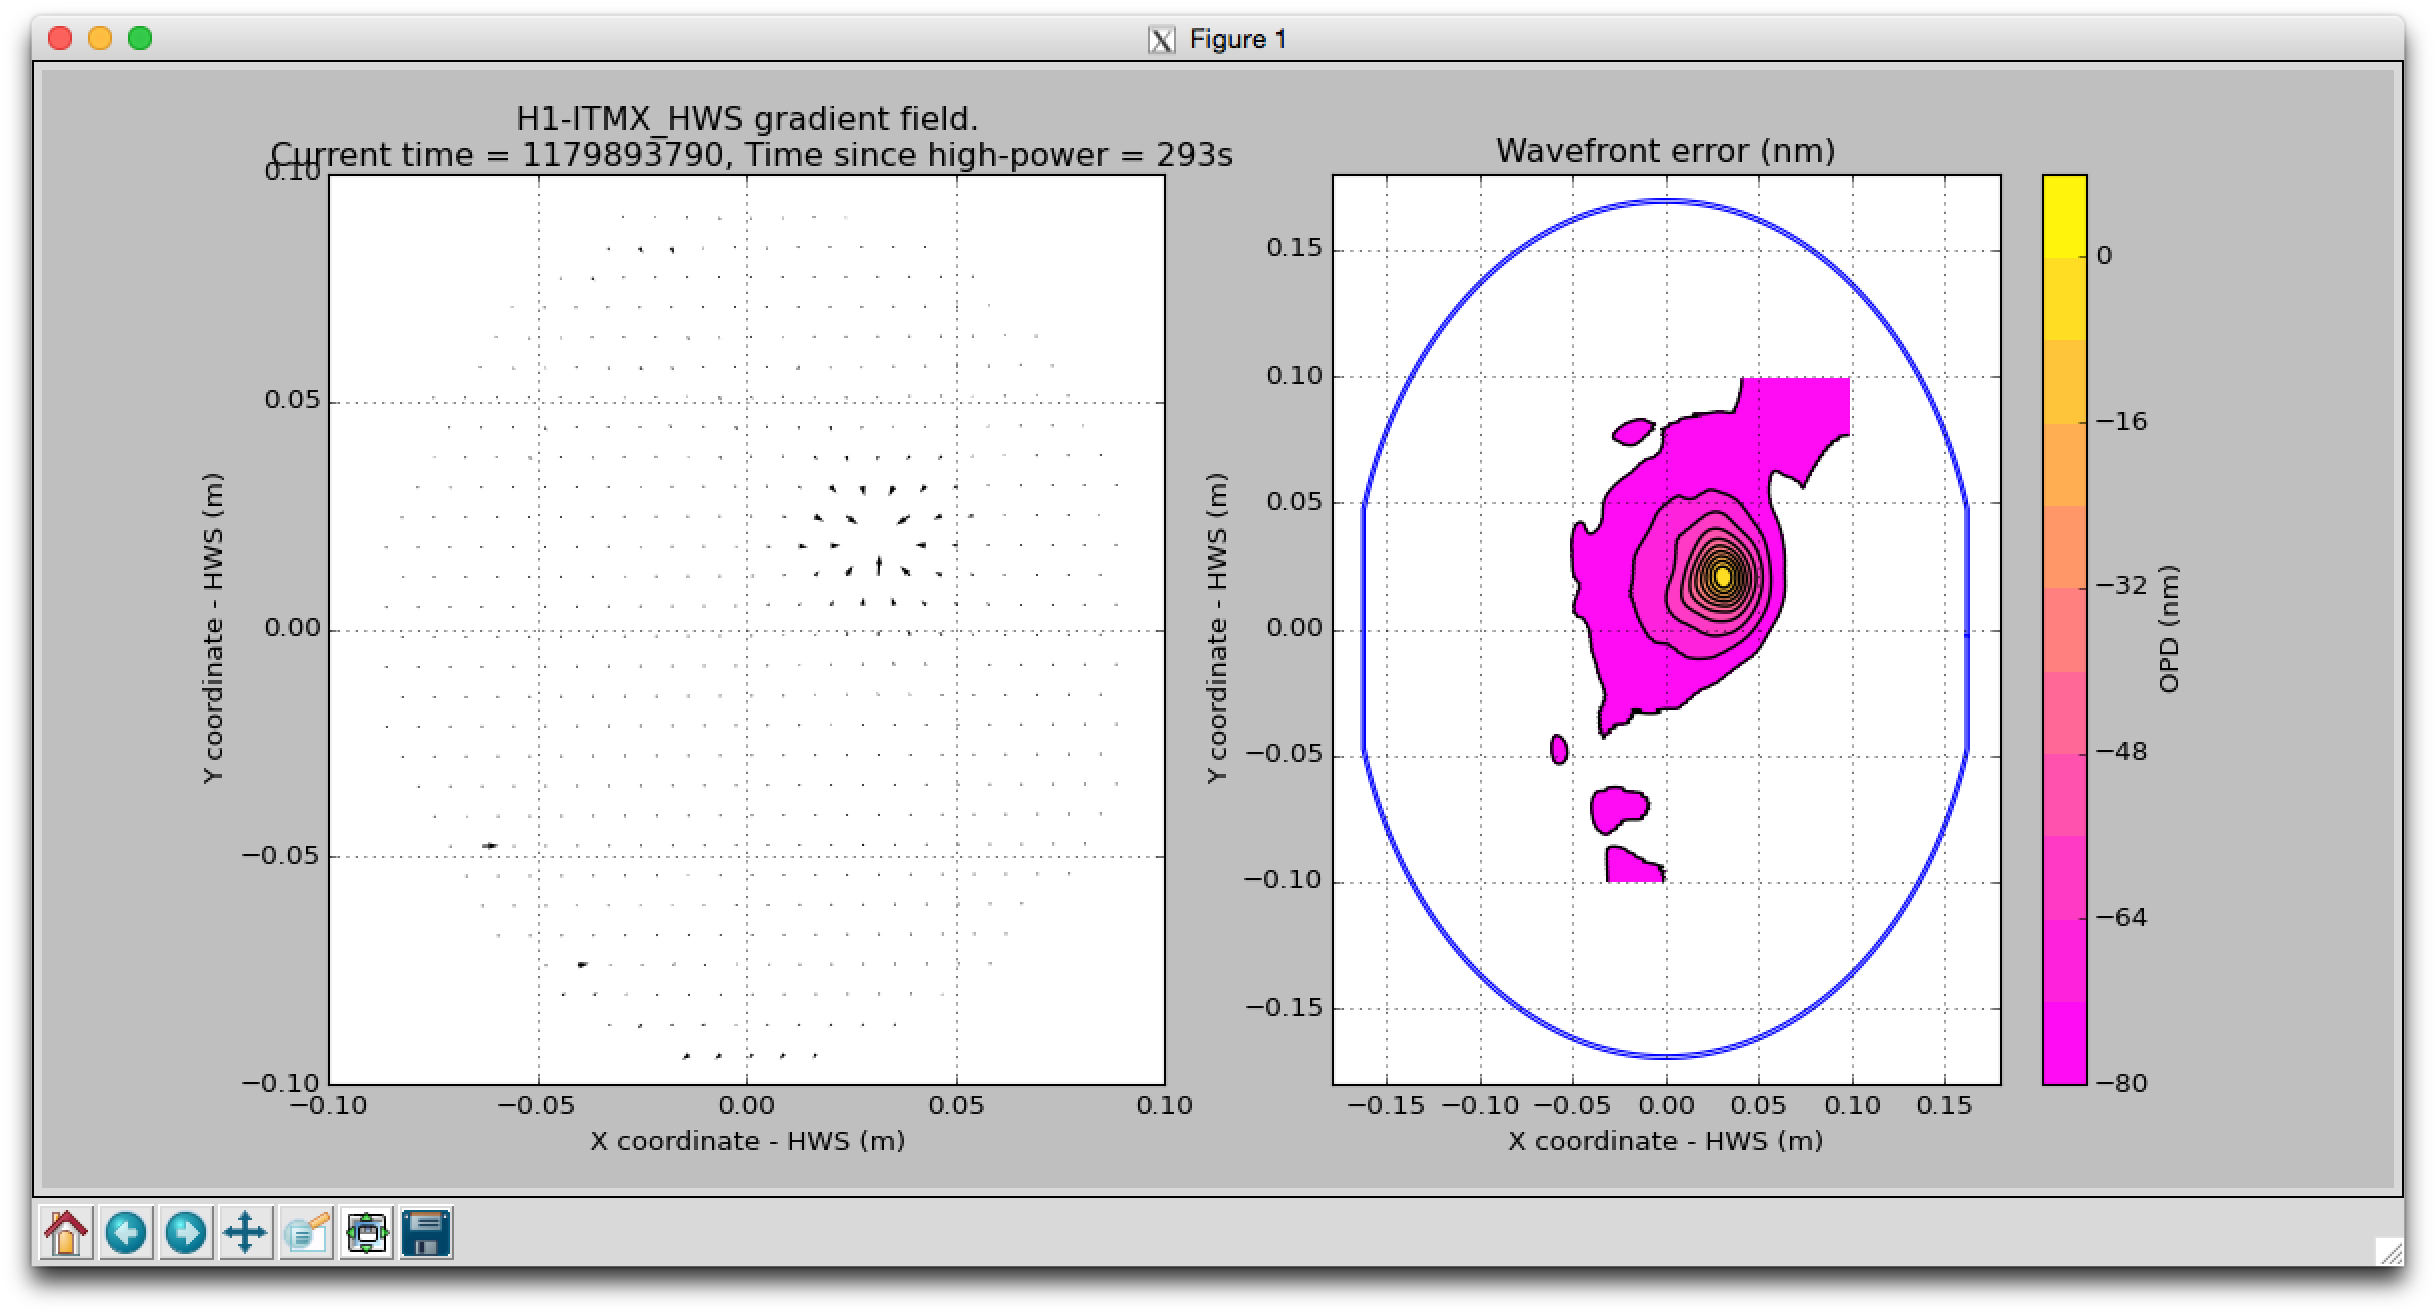
ITMX shows the point absorber again.
Note: we made every effort to center the HWS beams on the optics. As yet, I have not quantified the exact center of each optic in the HWS coordinate system. The plotting code defaults to assuming that the HWS beam is exactly centered but it is feasible that we may be off center by a couple of centimeters.
ITMY-HWS after around 10 minutes
The contour lines are spaced 8nm apart.
ITMY after 30 minutes
The double-pass thermal lens here is around 28 uD. The single-pass thermal lens is about 14 uD.
ITMX after ~5 minutes
Looking at the Seidel coefficients of HWSs X and Y, I see that our TCS pre-loading scheme on ITMY is not doing a great job. It leaves a spherical power of 15 uD as we remove the pre-loaded CO2 power. See the attached. I am not sure why HWSX data is noisier than HWSY.
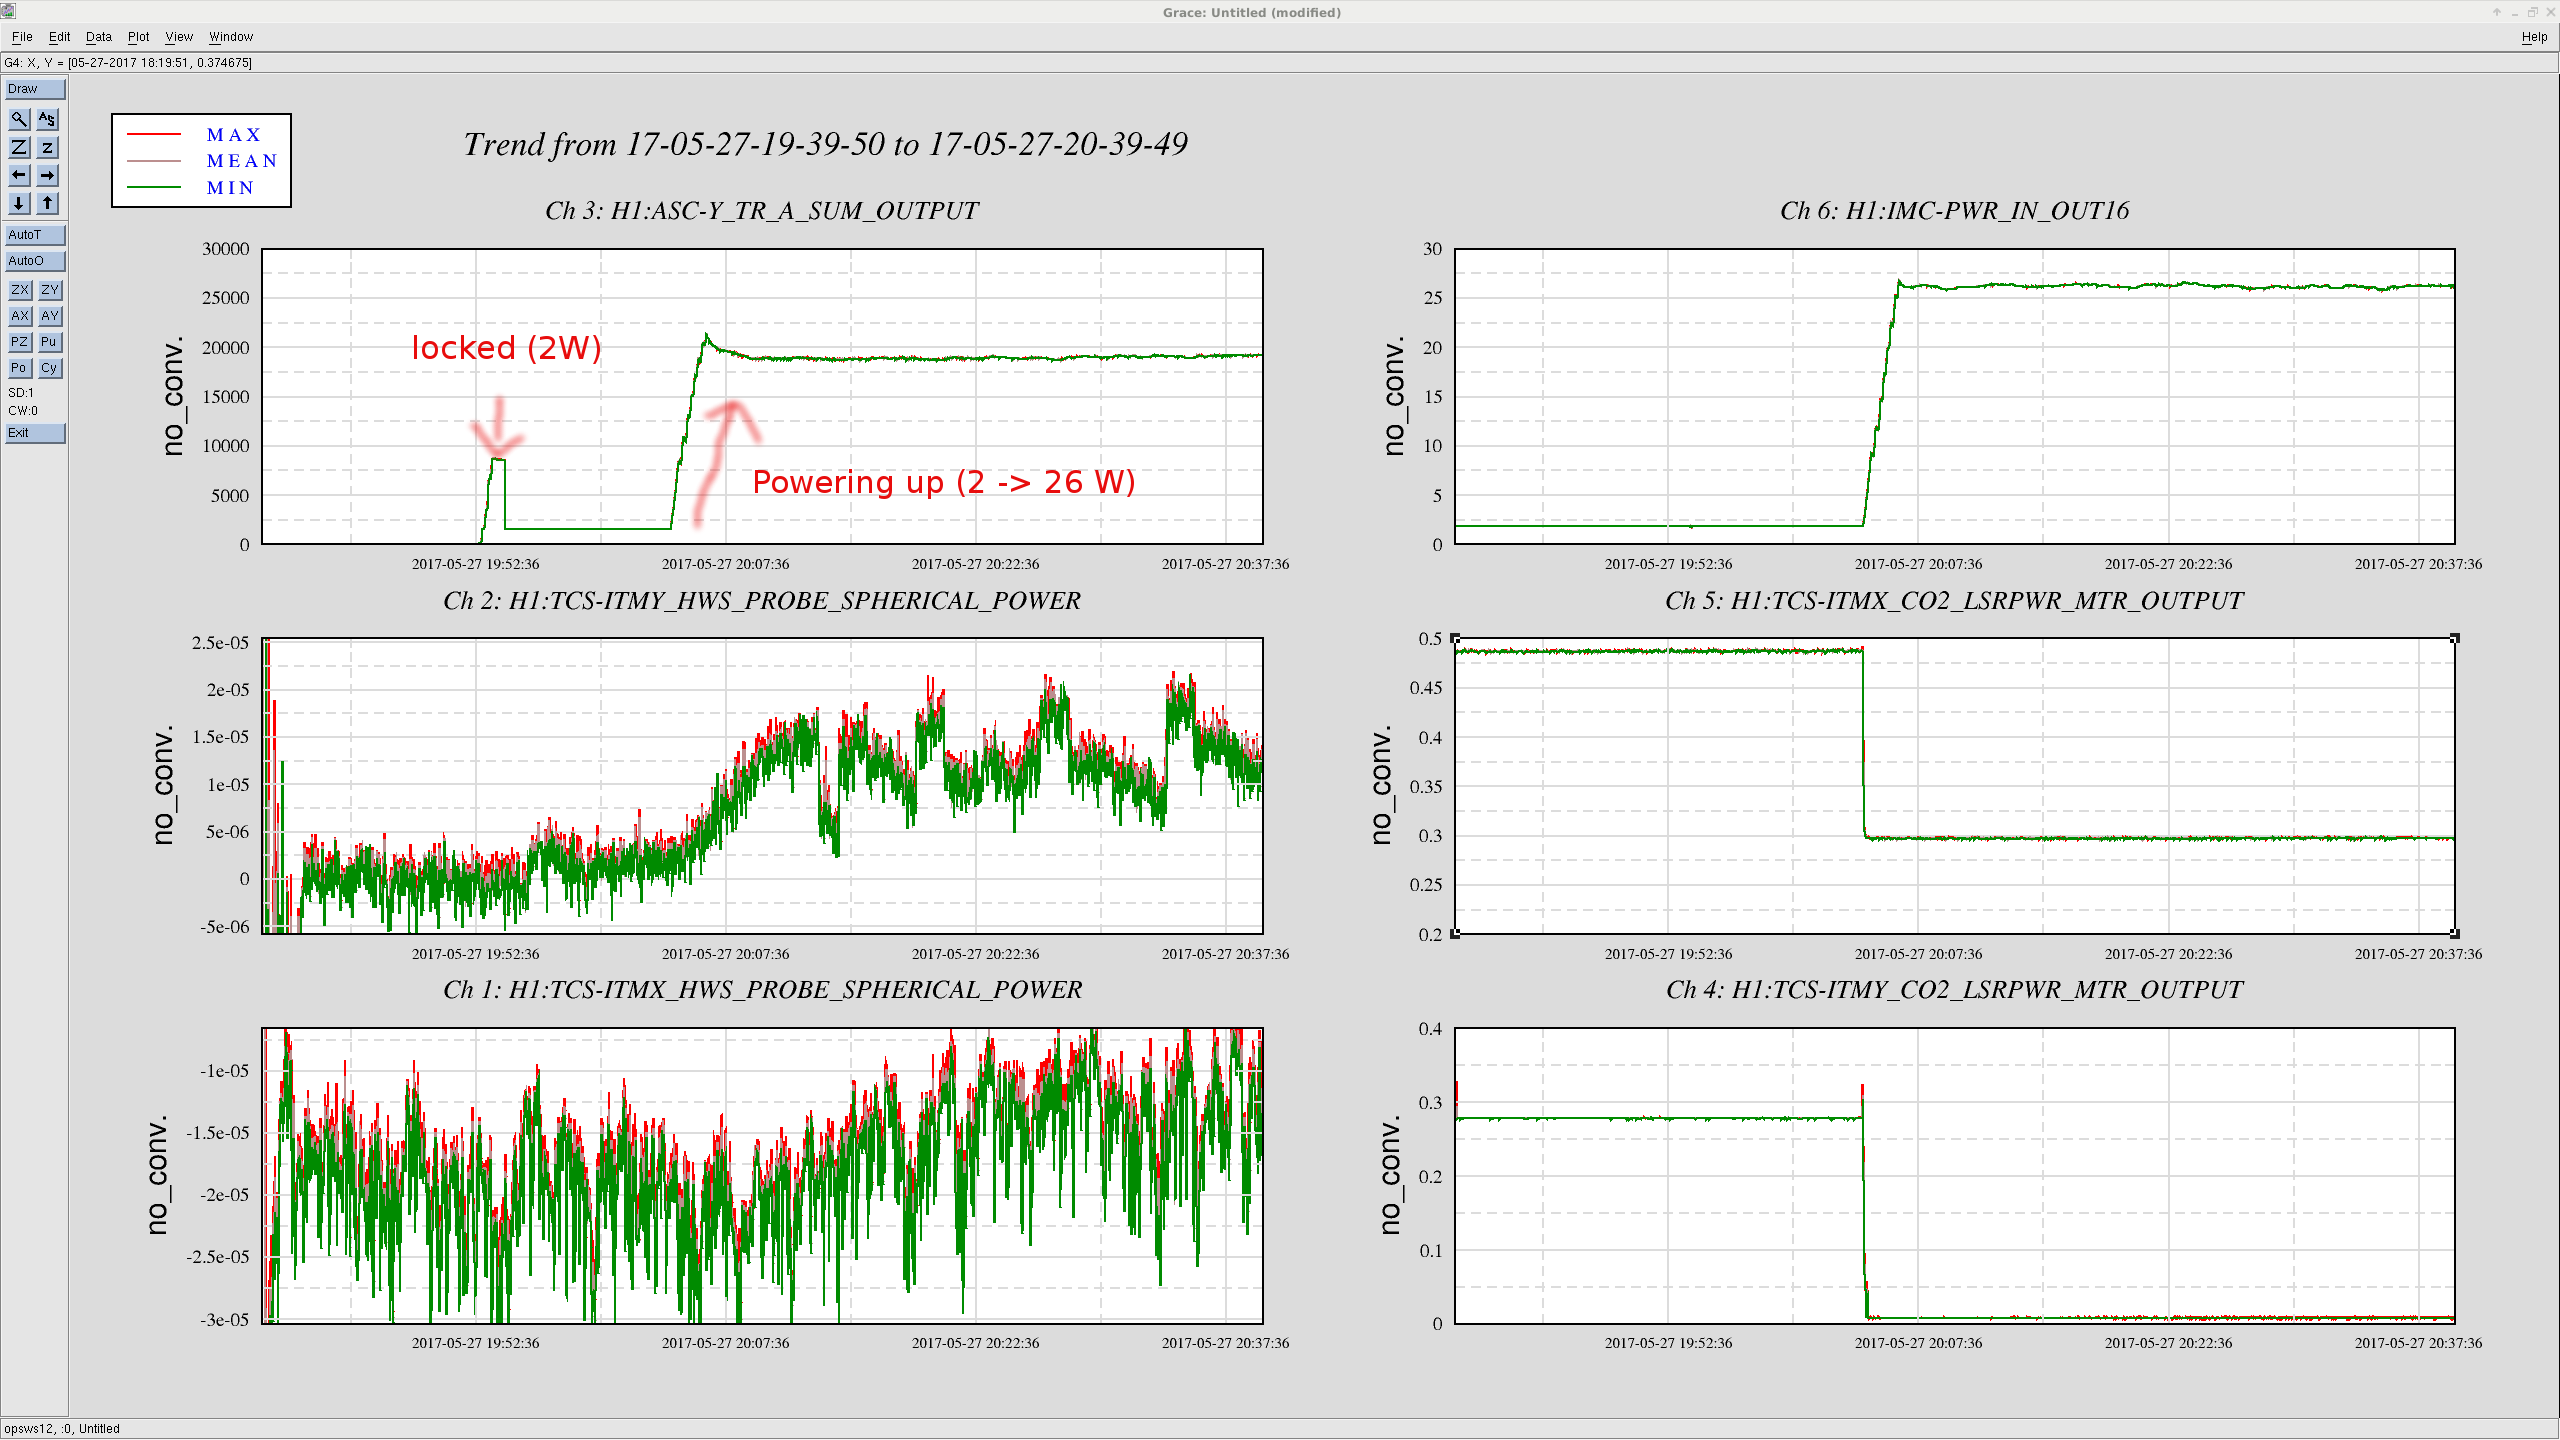
I need to implement a weighted best fit parameter estimator for the HWS Python code. Chances are that HWSX has some noisy centroids that are skewing the measurement. When we weight the parameter fitting by the inverse of the variance of each centroid, we should get a much cleaner estimation of the spherical power.
I will implement that this week.