john.worden@LIGO.ORG - posted 10:30, Tuesday 30 May 2017 (36515)
CP3 consumption before and after fail.
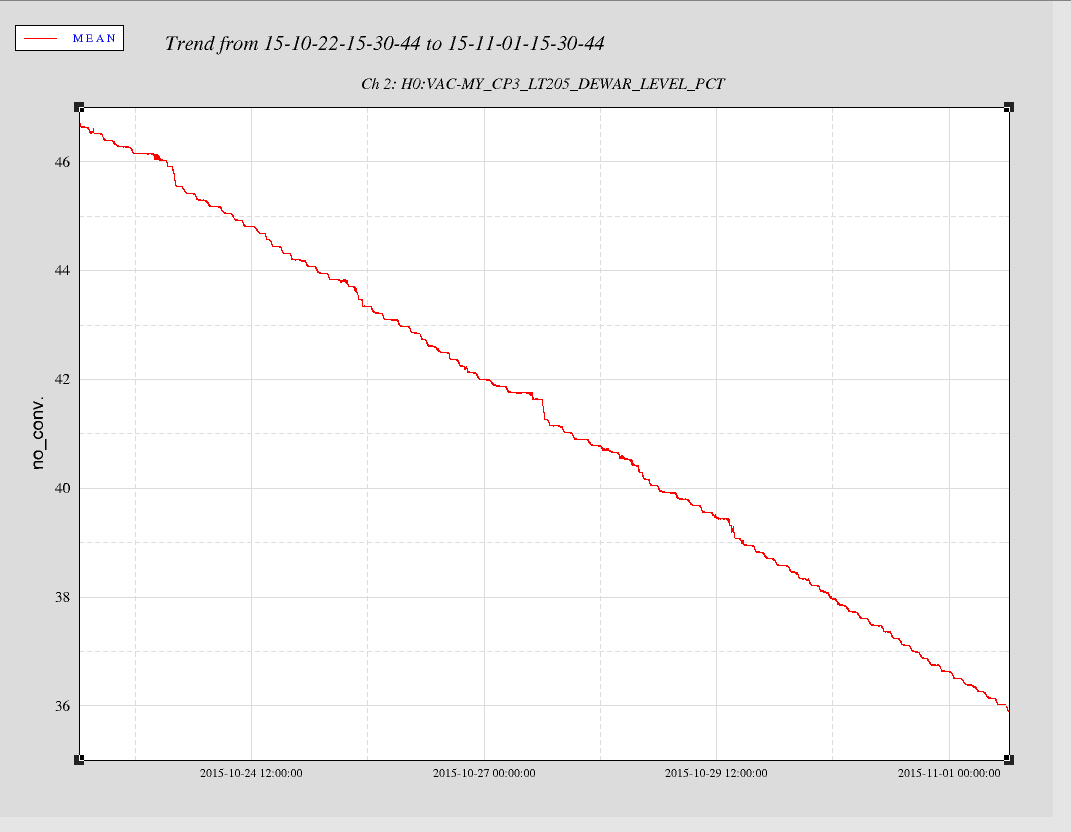
LN2 consumption is derived from the liquid level of the storage dewar. Nominal rates across the site are usually around 1%/day. CP3 failed Dec21/22 2015.
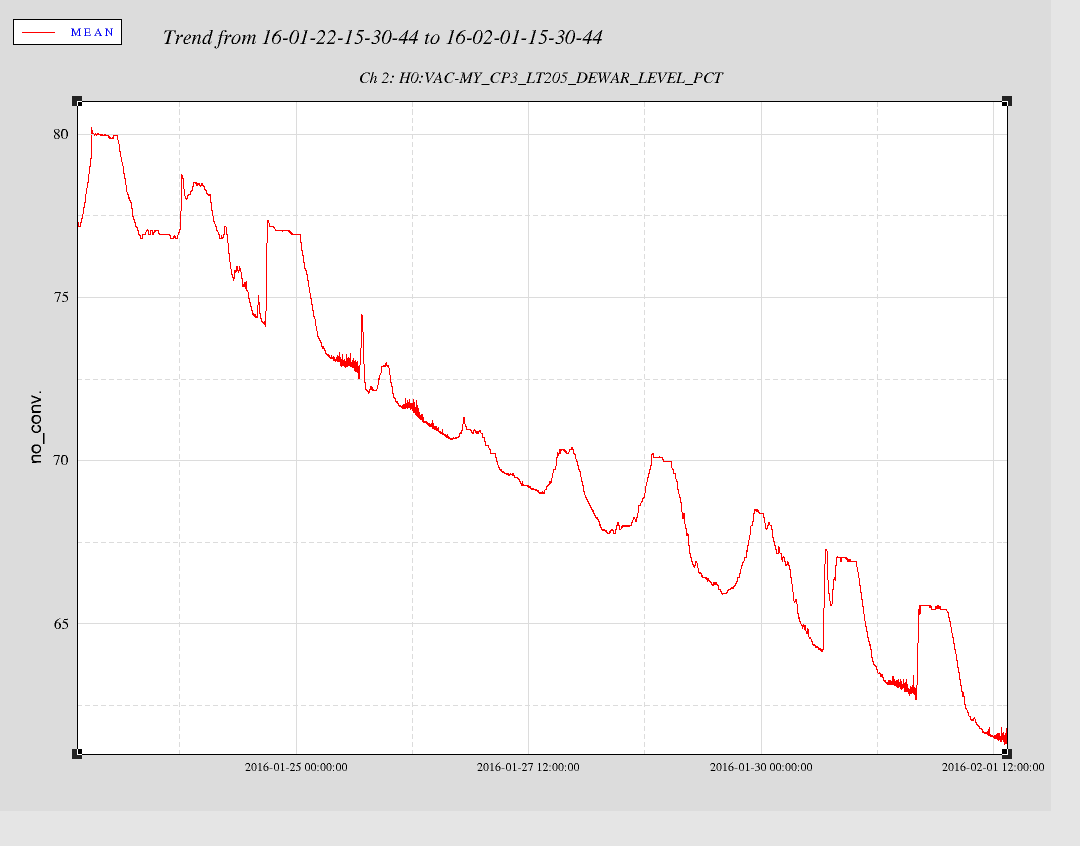
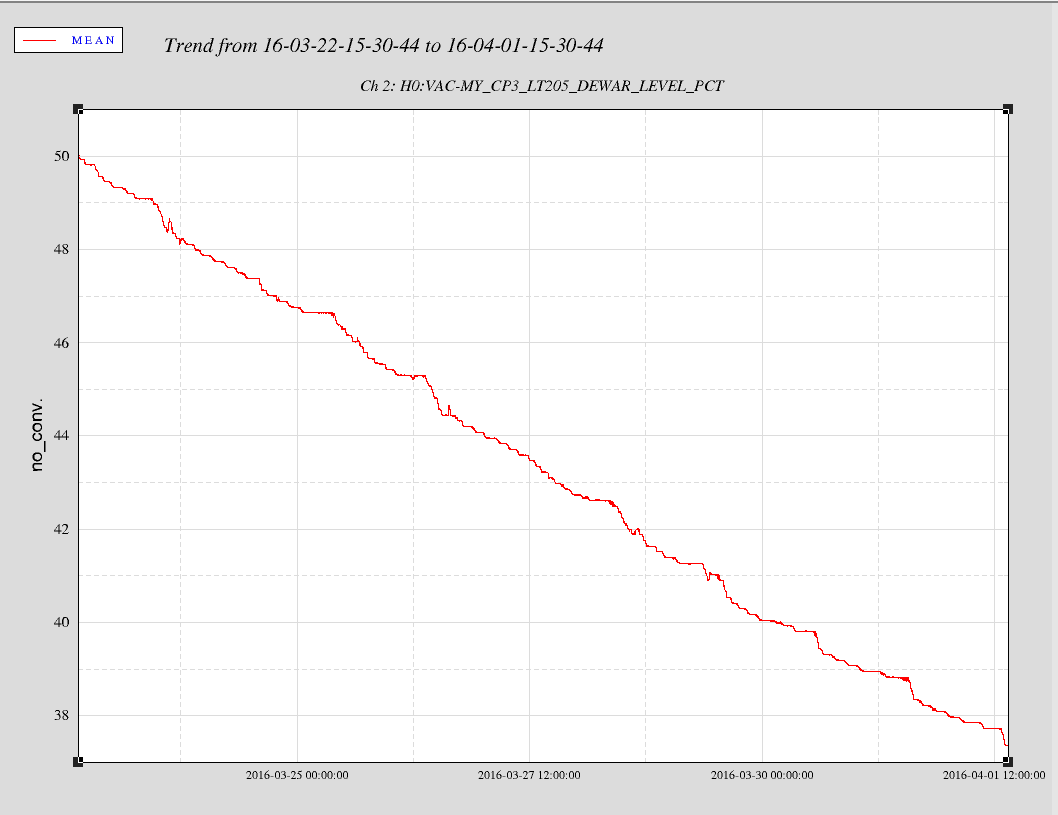
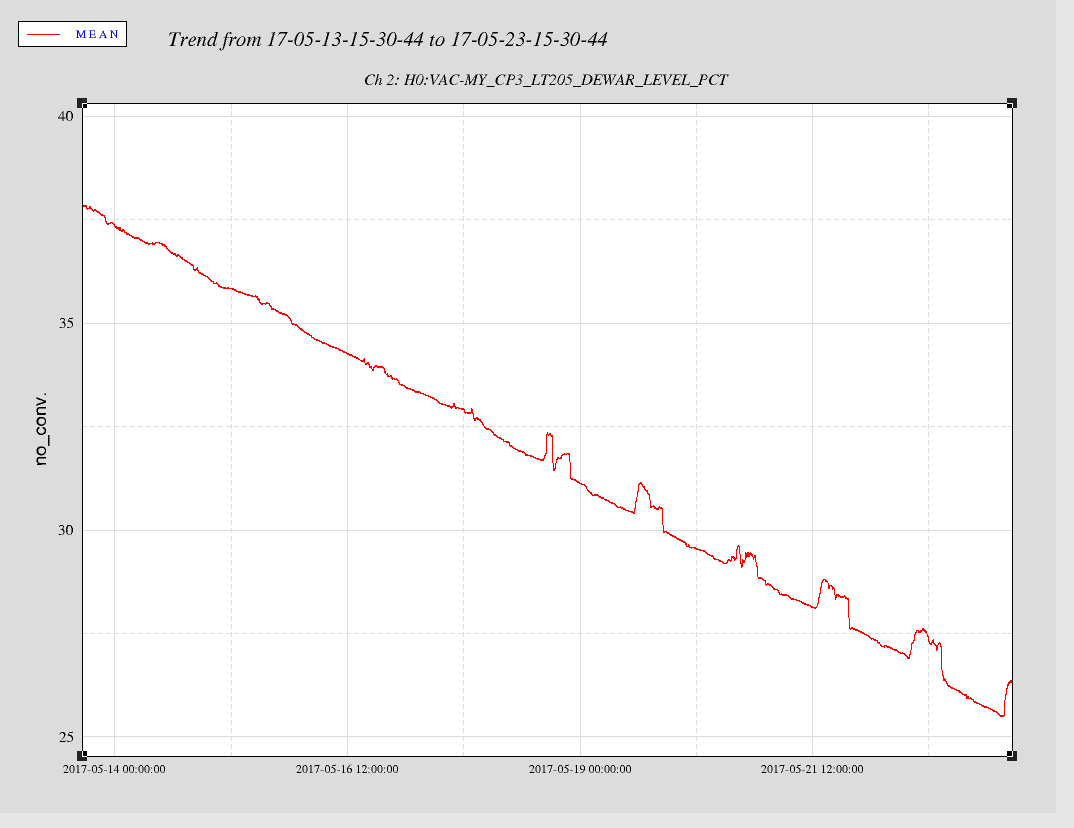
Plots for Nov 2015, and April 2016 show rates of 1.07%/day and 1.25%/day. The plot for Feb 2016 shows a noisy signal. For May 2017 we get 1.25%/day
The increase in consumption in the period may be due to the manual filling operation or a loss of vacuum in the CP3 dewar insulating jacket.
A liquid nitrogen delivery in December made the dewar level signal noisy for a while.
Images attached to this report