keith.riles@LIGO.ORG - posted 23:47, Sunday 29 July 2012 - last comment - 13:11, Tuesday 31 July 2012(3646)
Looking at OAT spectra with fine resolution
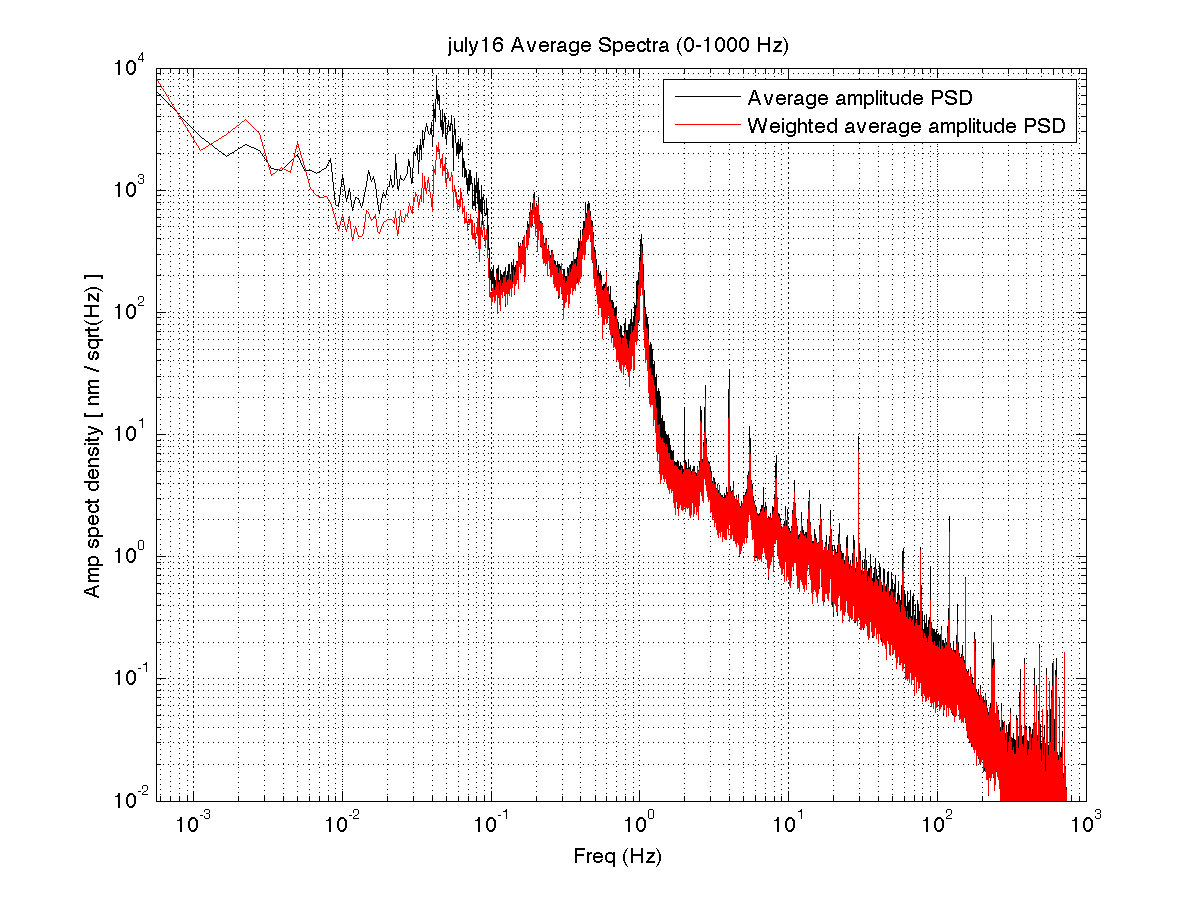
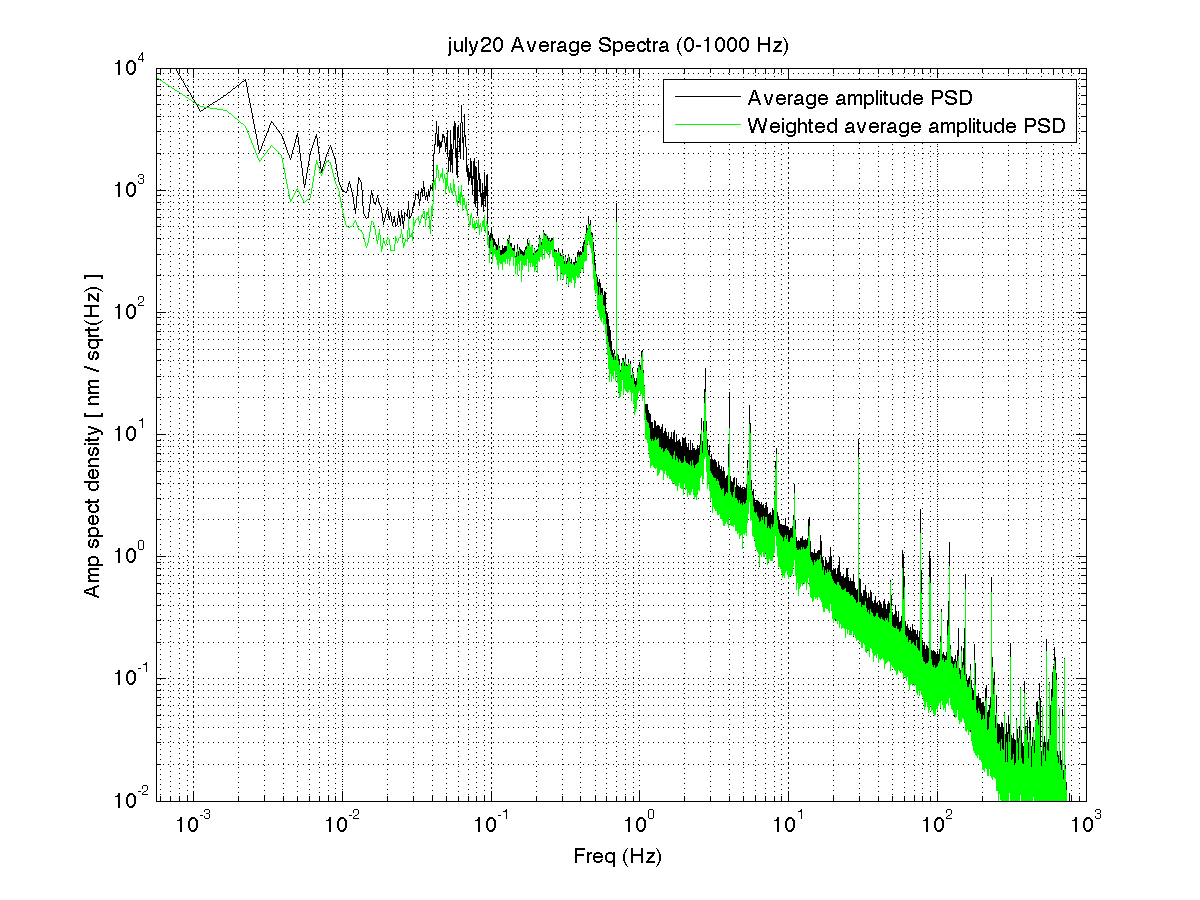
As part of gearing up for aLIGO CW and Stochastic analysis detector characterization, a number of us are developing and starting to use new or enhanced spectral line finding tools. We plan to apply these various tools to this summer's OAT data in the hope of 1) making the tools better via exposure to real data; 2) identifying spectral lines early on that can be mitigated; and 3) cataloging lines that we have to live with in aLIGO. A wiki clearinghouse for OAT spectral line studies can be found here. For now it has mostly documentation on tools and channel selections, but over time it will be populated with study results. One important tool is an enhanced version of the familiar Fscan program. Greg Mendell has started creating daily Fscan plots for locked-arm data (defined by the mean value of H2:ISC-ALS_EY_REFL_PWR_MON_OUT16 over 1 minute lying in the range 4300-8000 -- see wiki above for explanation). The Fscans generated so far cover only the days of July 16 and 20, chosen because each had more than five hours of locked-arm data. I have used the half-hour SFTs generated during the Fscanning to look at average spectra for the calibrated OAT feedback channel H2:SUS-ETMY_M0_LOCK_L_IN1_DQ for July 16 (5 hours) and July 20 (9 hours) with 0.56 mHz binning. Two different averages were computed, one being a simple arithmetic average, the other a noise weighted average that is almost, but not quite the same as a harmonic mean. (The same method was used to compute unweighted and weighted averages for h(t) for all of S5 and S6, as discussed in more detail here.) Generally speaking, one expects the weighted average to be lower than the unweighted average and to have a smaller variance. Large differences between unweighted and weighted averages indicate non-stationary bands. The figures below show the results:Some quick observations:
- Full spectrum (0-1000 Hz) for July 16 (unweighted and weighted averages)
- Full spectrum (0-1000 Hz) for July 20 (unweighted and weighted averages)
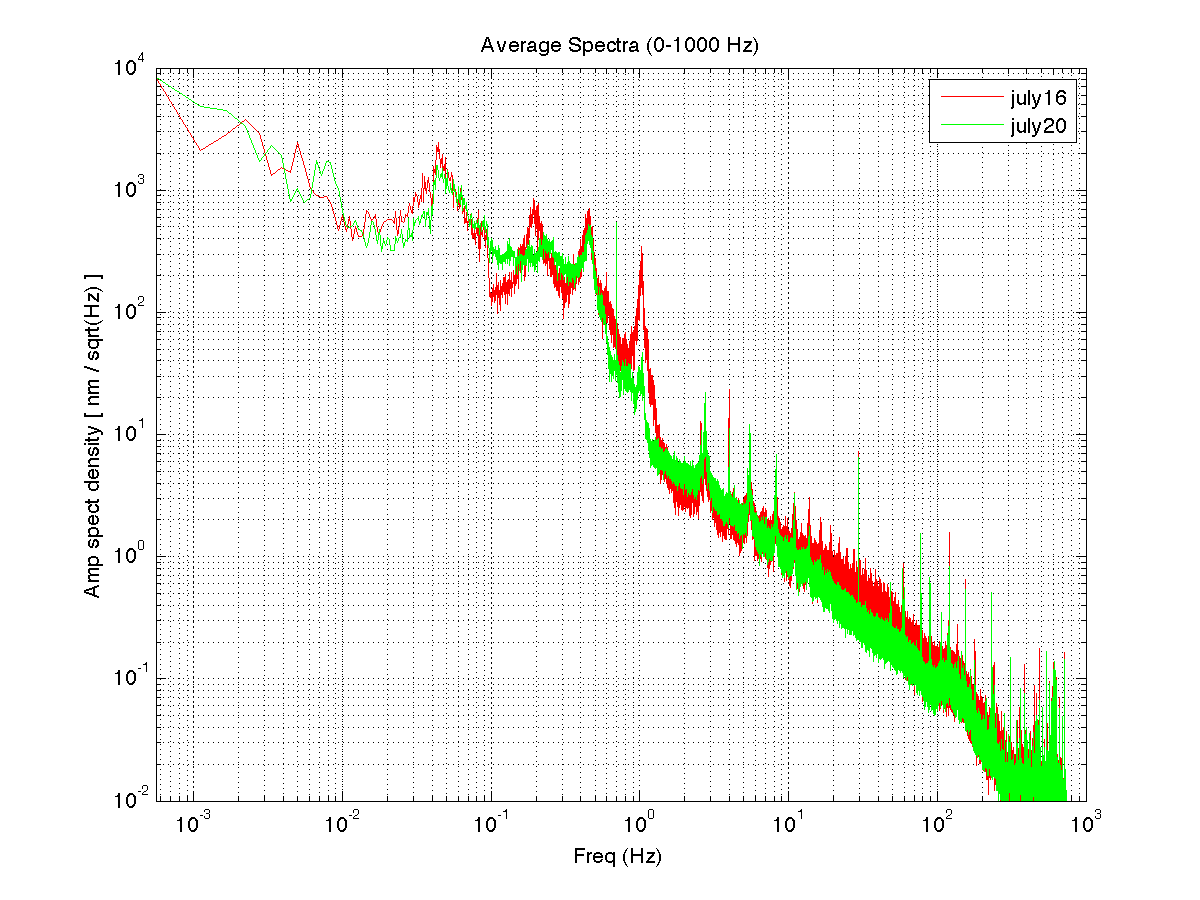
- Full spectrum (0-1000 Hz) for July 16 and 20 together (weighted only)
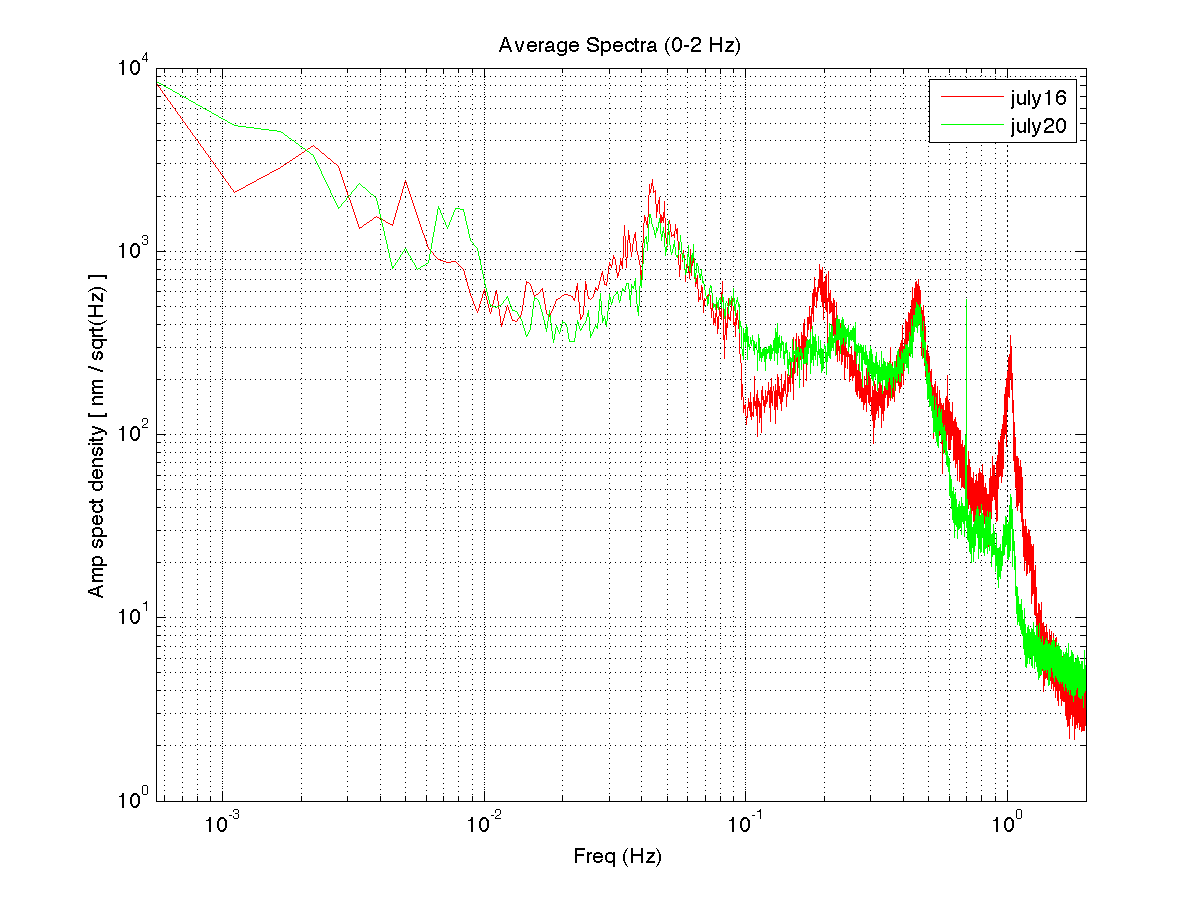
- Zoomed spectrum (0-2 Hz) for July 16 and 20 together (weighted only)
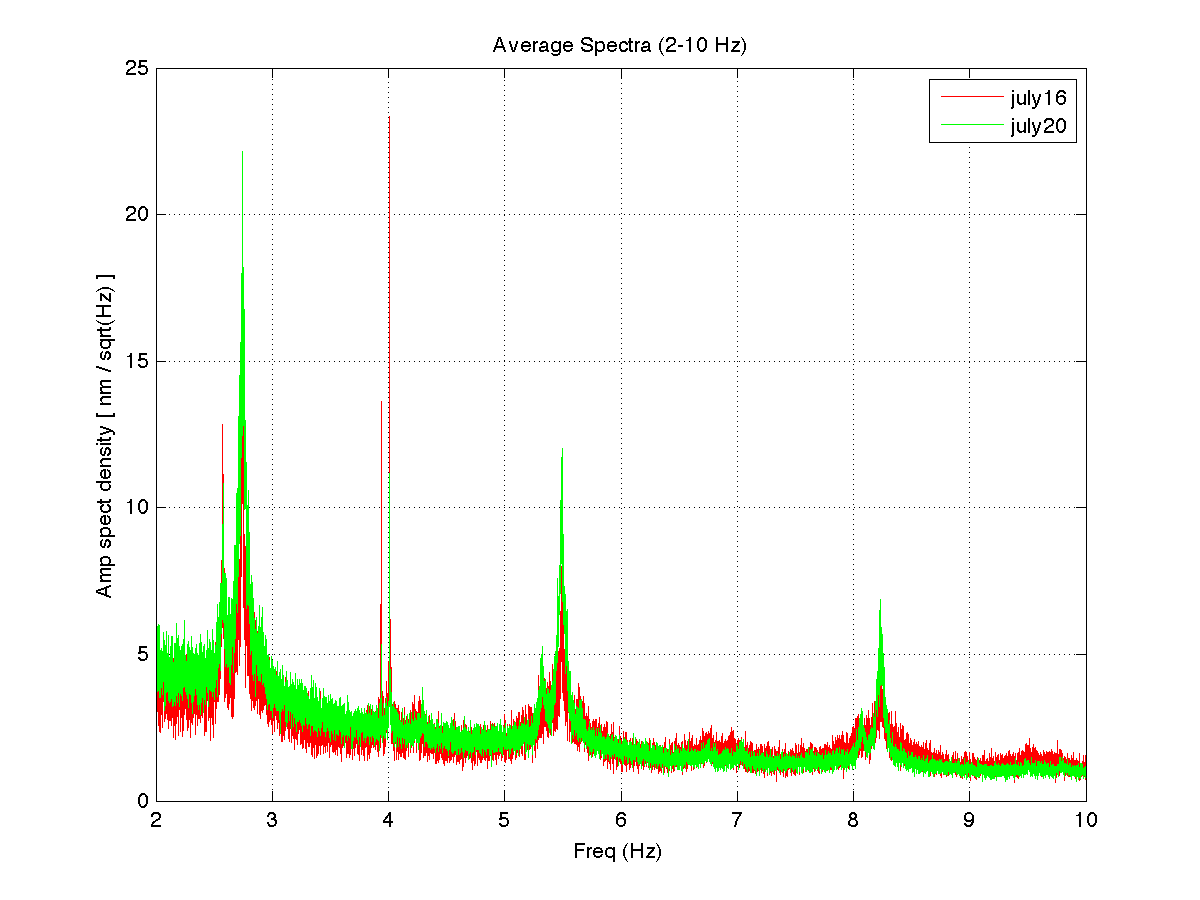
- Zoomed spectrum (2-10 Hz) for July 16 and 20 together (weighted only)
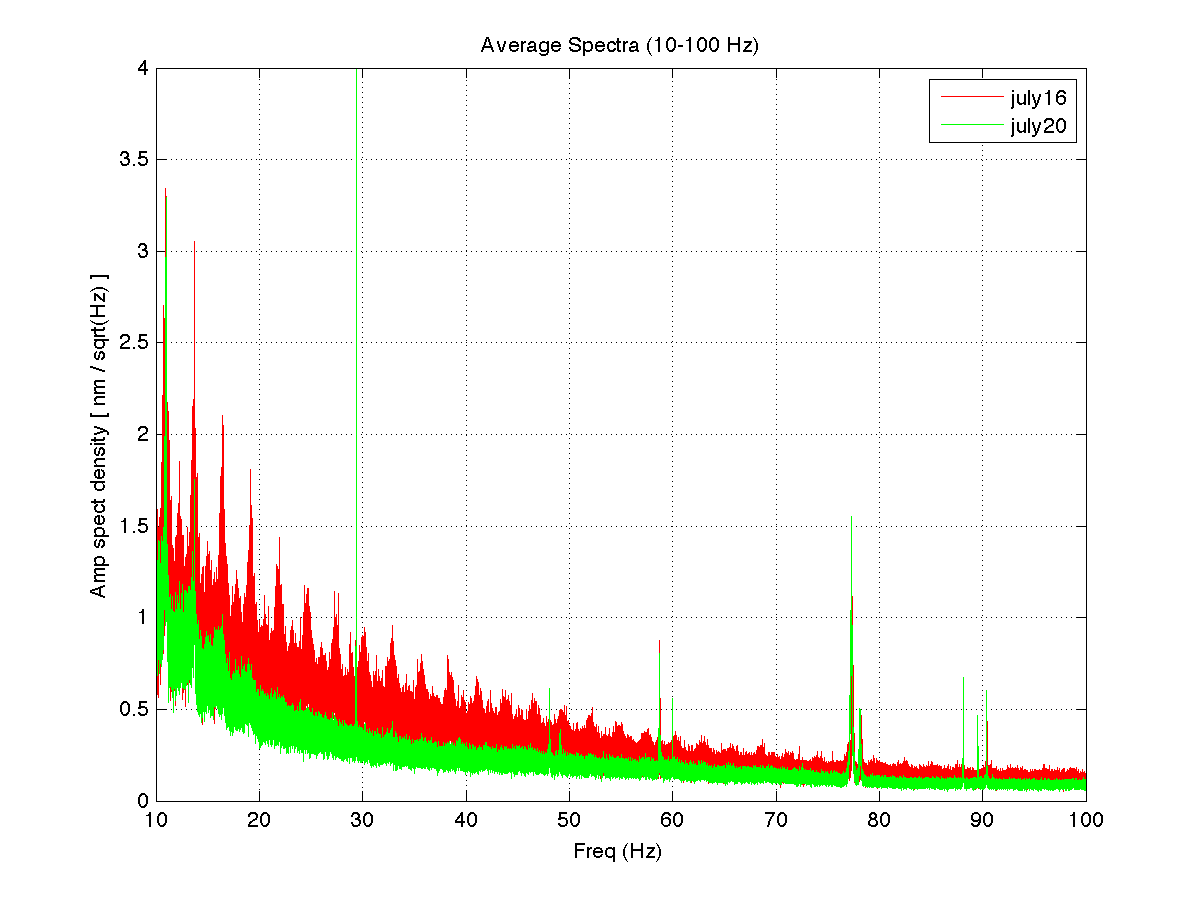
- Zoomed spectrum (10-100 Hz) for July 16 and 20 together (weighted only)
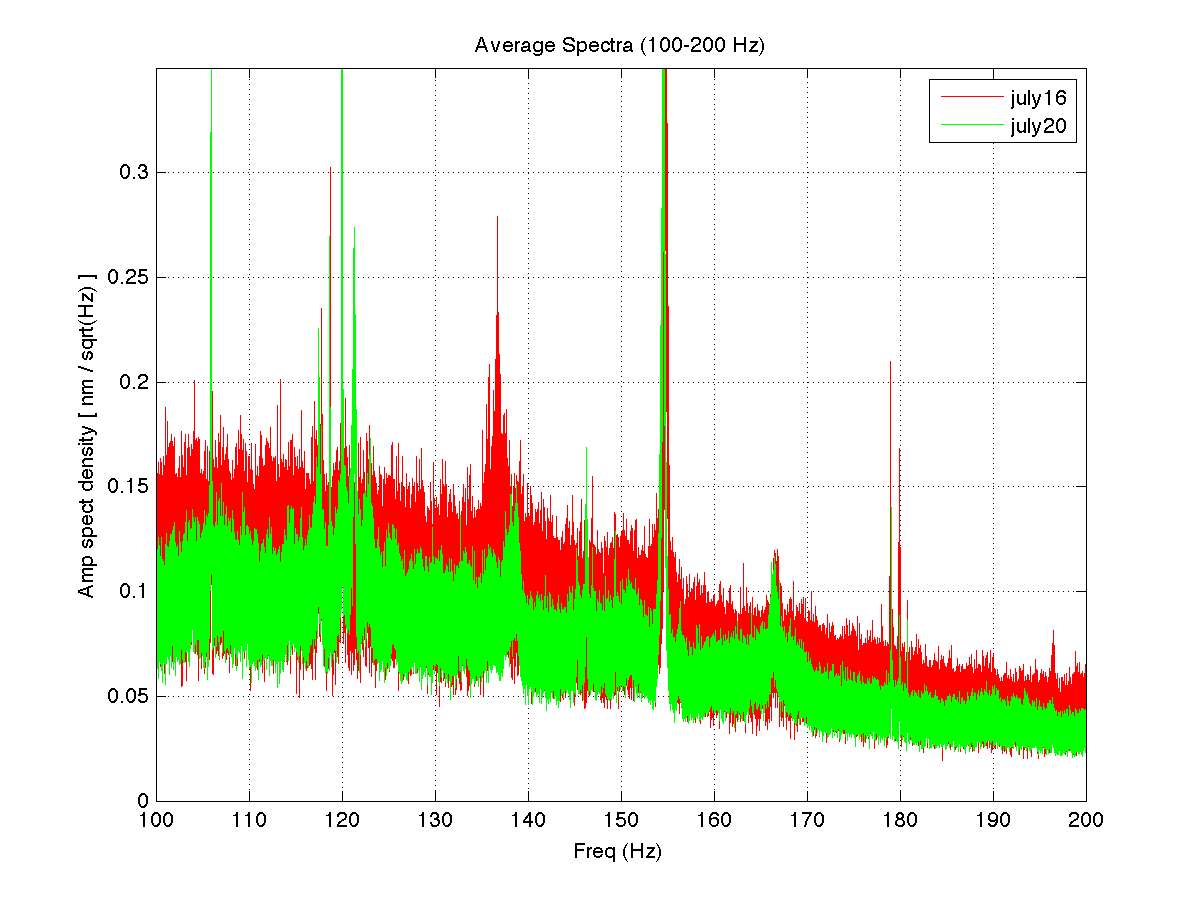
- Zoomed spectrum (100-200 Hz) for July 16 and 20 together (weighted only)
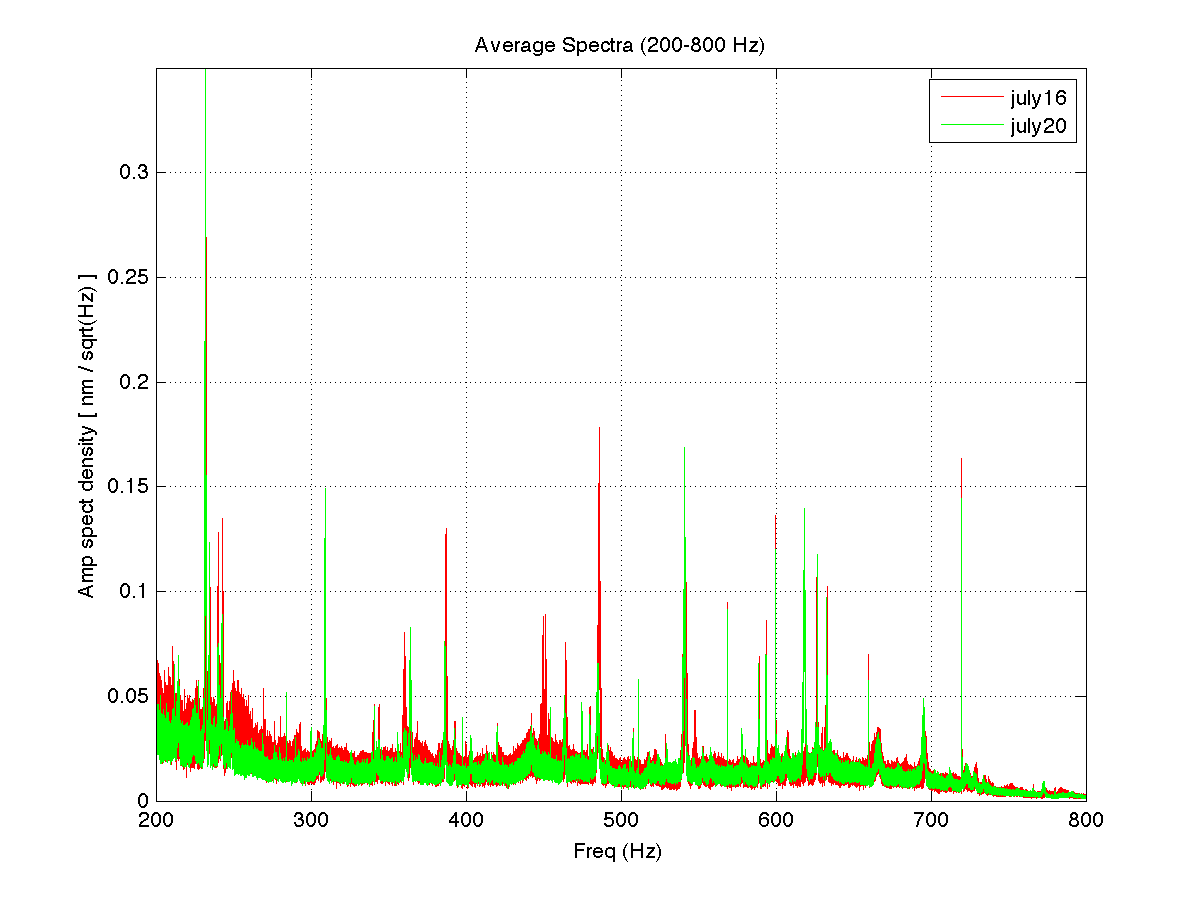
- Zoomed spectrum (200-800 Hz) for July 16 and 20 together (weighted only)
- The full spectrum is "rich" with structure (how much of it is relevant to eventual aLIGO operations is not clear, however)
- The July 20 noise is below that of July 16 over most of the full band (good to see!)
- Here is a small sampling of line artifacts above 10 Hz (band of direct interest to the CW/Stochastic groups):
- 120 Hz is easily seen, but 60 Hz is much weaker in July 16 data (stronger in July 20 data -- was there a 60-Hz notch on this channel on July 16?) There is a peak near 180 Hz (179.9 Hz), but I don't think it's a 60-Hz harmonic.
- There is a persistent comb at 2.74 Hz seen out to at least the 25th harmonic in the July 16 data, but quite mitigated in the July 20 data
- There is a very strong line at 29.375 Hz with rapidly weakening harmonics visible at 58.75 Hz, 88.125 Hz and 117.5 Hz
- Other strong lines below 200 Hz include 77.30 Hz (and harmonic at 154.60 Hz), 78.15 Hz, 89.54 Hz (and harmonic at 179.08 Hz), 90.40 Hz (and harmonic at 180.80 Hz), and 105.92 Hz
Images attached to this report
Comments related to this report
Here is a list of the SFT filenames from July 16. The start times are embedded in the names:
H-1_H2_1800SFT_fscanH2_SUS-ETMY_M0_LOCK_L_IN1_DQ-1026518956-1800.sft
H-1_H2_1800SFT_fscanH2_SUS-ETMY_M0_LOCK_L_IN1_DQ-1026520756-1800.sft
H-1_H2_1800SFT_fscanH2_SUS-ETMY_M0_LOCK_L_IN1_DQ-1026523546-1800.sft
H-1_H2_1800SFT_fscanH2_SUS-ETMY_M0_LOCK_L_IN1_DQ-1026525346-1800.sft
H-1_H2_1800SFT_fscanH2_SUS-ETMY_M0_LOCK_L_IN1_DQ-1026527146-1800.sft
H-1_H2_1800SFT_fscanH2_SUS-ETMY_M0_LOCK_L_IN1_DQ-1026528946-1800.sft
H-1_H2_1800SFT_fscanH2_SUS-ETMY_M0_LOCK_L_IN1_DQ-1026530746-1800.sft
H-1_H2_1800SFT_fscanH2_SUS-ETMY_M0_LOCK_L_IN1_DQ-1026532546-1800.sft
H-1_H2_1800SFT_fscanH2_SUS-ETMY_M0_LOCK_L_IN1_DQ-1026535786-1800.sft
H-1_H2_1800SFT_fscanH2_SUS-ETMY_M0_LOCK_L_IN1_DQ-1026538156-1800.sft

Here is a list of the SFT filenames from July 20.
H-1_H2_1800SFT_fscanH2_SUS-ETMY_M0_LOCK_L_IN1_DQ-1026785686-1800.sft
H-1_H2_1800SFT_fscanH2_SUS-ETMY_M0_LOCK_L_IN1_DQ-1026787486-1800.sft
H-1_H2_1800SFT_fscanH2_SUS-ETMY_M0_LOCK_L_IN1_DQ-1026789286-1800.sft
H-1_H2_1800SFT_fscanH2_SUS-ETMY_M0_LOCK_L_IN1_DQ-1026791086-1800.sft
H-1_H2_1800SFT_fscanH2_SUS-ETMY_M0_LOCK_L_IN1_DQ-1026792886-1800.sft
H-1_H2_1800SFT_fscanH2_SUS-ETMY_M0_LOCK_L_IN1_DQ-1026794686-1800.sft
H-1_H2_1800SFT_fscanH2_SUS-ETMY_M0_LOCK_L_IN1_DQ-1026796486-1800.sft
H-1_H2_1800SFT_fscanH2_SUS-ETMY_M0_LOCK_L_IN1_DQ-1026798286-1800.sft
H-1_H2_1800SFT_fscanH2_SUS-ETMY_M0_LOCK_L_IN1_DQ-1026803896-1800.sft
H-1_H2_1800SFT_fscanH2_SUS-ETMY_M0_LOCK_L_IN1_DQ-1026805696-1800.sft
H-1_H2_1800SFT_fscanH2_SUS-ETMY_M0_LOCK_L_IN1_DQ-1026807496-1800.sft
H-1_H2_1800SFT_fscanH2_SUS-ETMY_M0_LOCK_L_IN1_DQ-1026809296-1800.sft
H-1_H2_1800SFT_fscanH2_SUS-ETMY_M0_LOCK_L_IN1_DQ-1026811096-1800.sft
H-1_H2_1800SFT_fscanH2_SUS-ETMY_M0_LOCK_L_IN1_DQ-1026812896-1800.sft
H-1_H2_1800SFT_fscanH2_SUS-ETMY_M0_LOCK_L_IN1_DQ-1026814696-1800.sft
H-1_H2_1800SFT_fscanH2_SUS-ETMY_M0_LOCK_L_IN1_DQ-1026816496-1800.sft
H-1_H2_1800SFT_fscanH2_SUS-ETMY_M0_LOCK_L_IN1_DQ-1026818296-1800.sft
The initial entry included links but did not list the URLs. For future reference, here they are:OAT spectral line wiki page: https://wiki.ligo.org/foswiki/bin/view/DetChar/OneArmTestLineInvestigations
Daily OAT Fscans (SUS channels): https://ldas-jobs.ligo-wa.caltech.edu/~pulsar/fscan/H2_OneArm/H2_OneArm_SUS/fscanNavigation.html
Averaged S5/S6 spectra: https://ldas-jobs.ligo.caltech.edu/~keithr/spectra/
Bram took a look at the transmitted-light photodiode for the reference cavity
in the optics lab (using a spectrum analyzer - no DAQ channel available).
He saw strong harmonics of 2.74 Hz and 4.0 Hz. So those lines showing up
in the ALS feedback signal are artifacts of the temporary light source being
used for the One Arm Test and should not be relevant to future aLIGO running.
see post 3582 for the measurements of the 2.75 Hz and the 4 Hz peaks.