There have been a number of good earthquakes this week so Sheila and I have talked about their impact on duty cycle a bit this week. There was an earthquake on the 12th in particular that was pretty interesting, because it was just a little bigger (~3-4 micron/s rms) than the biggest we've ridden out so far during O2 (~1.5 micron/s rms, we had a pretty good example of that last night). One aspect that I've looked at recently was comparing our O1 & O2 duty cycle vs .03-.1 hz BLRMS ground velocity.
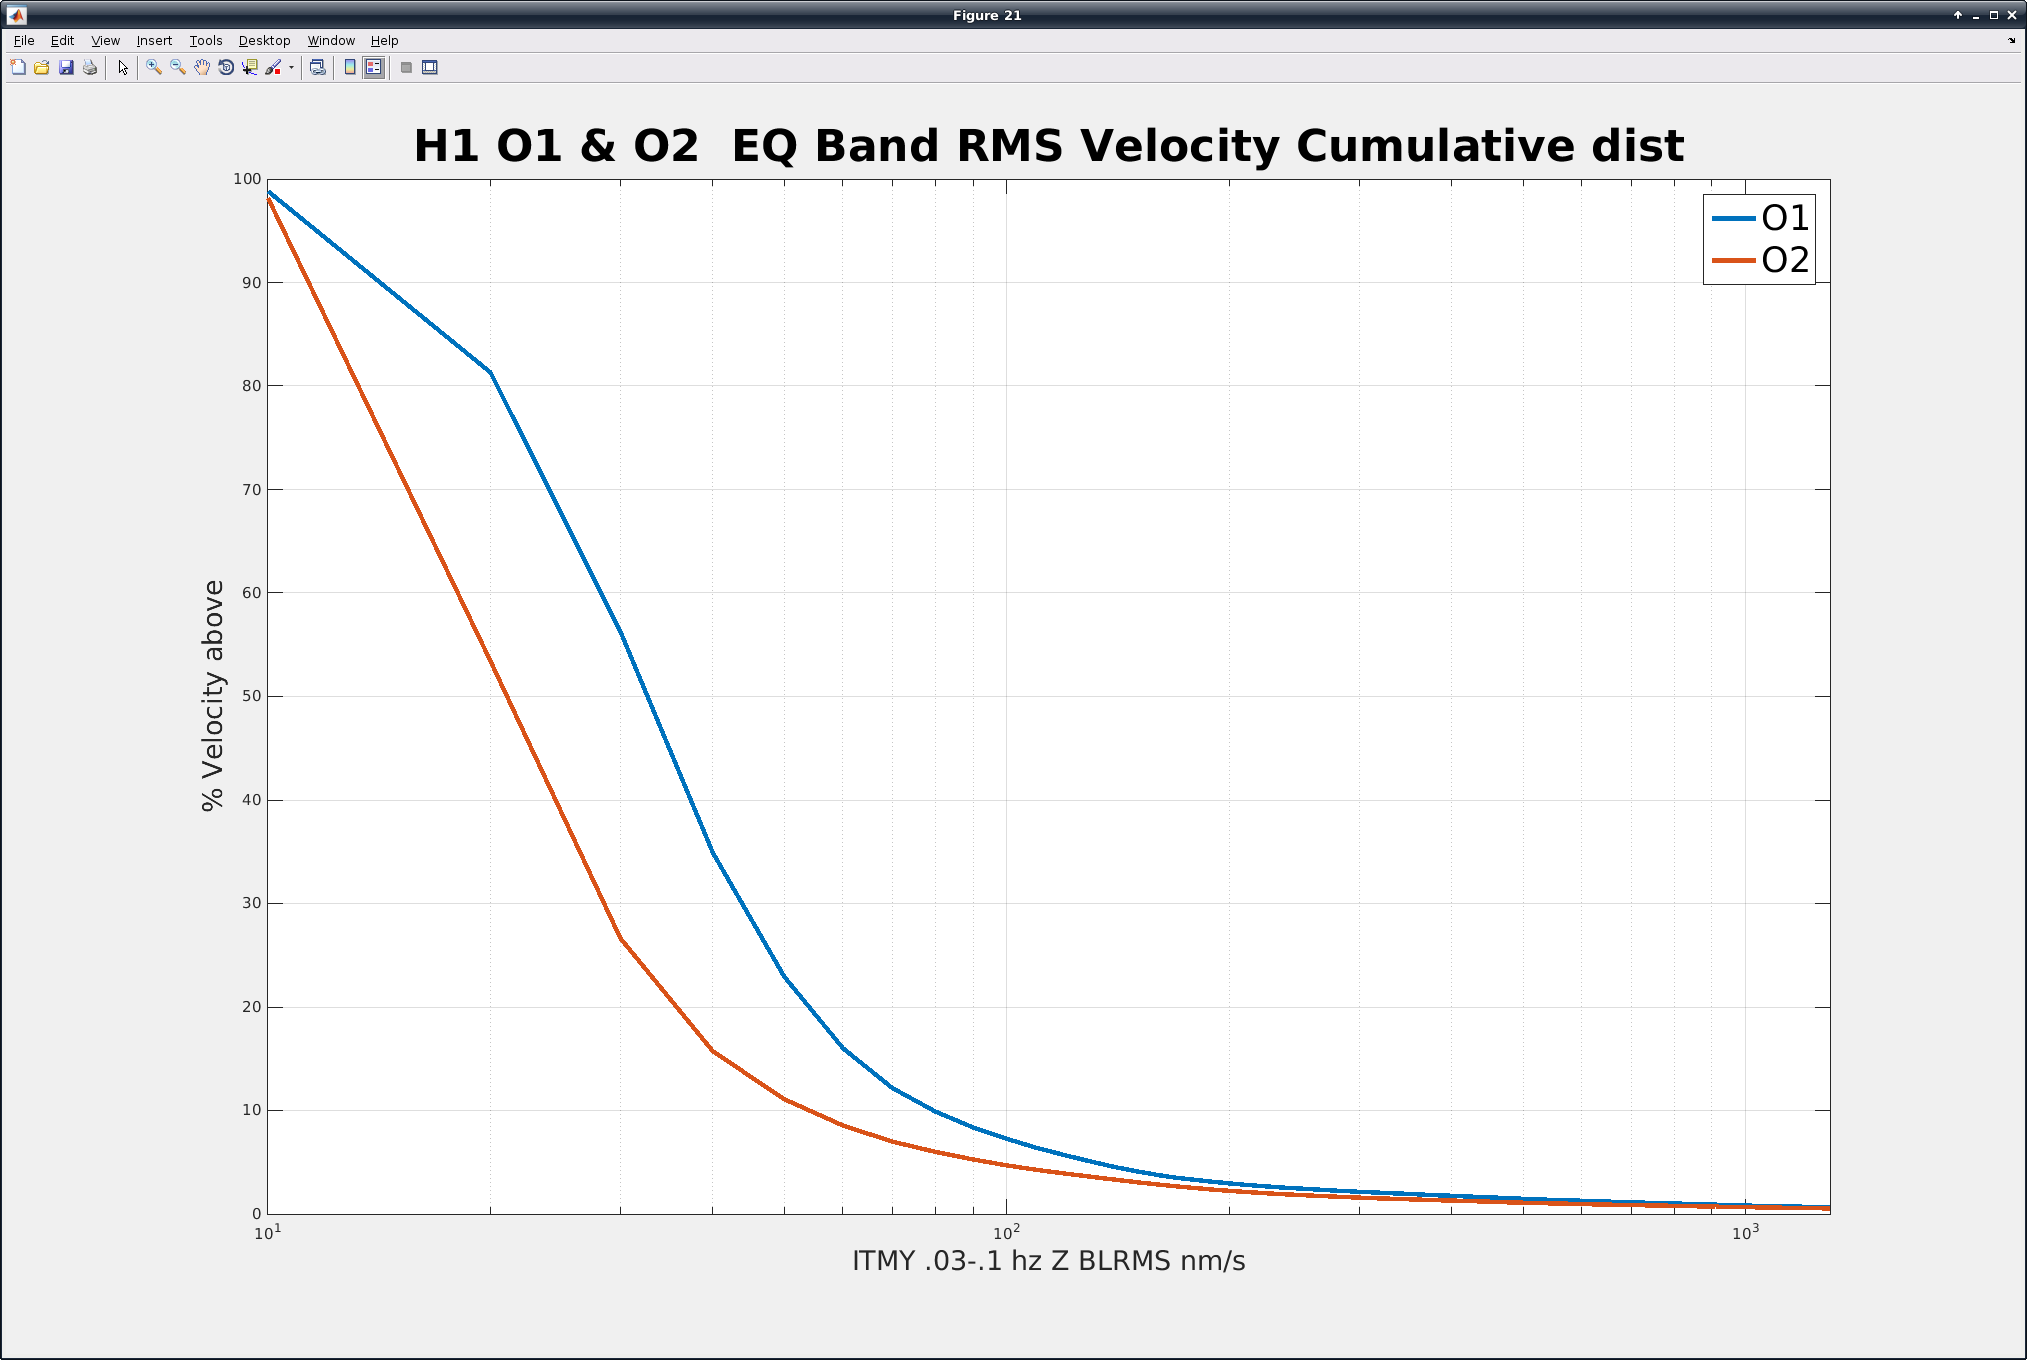
The first attached plot shows a cumulative plot of the eq band ground velocities (i.e. the x axis is RMS ground velocity measured by the ITMY STS2, the y axis is the percentage of the total run the ground was above the x axis value). It's interesting to note that O2 has been pretty gentle in all respects compared to O1 at LHO (the O1 curve is above the O2 curve for much of this plot), so this may explain some of our good duty cycle this run.
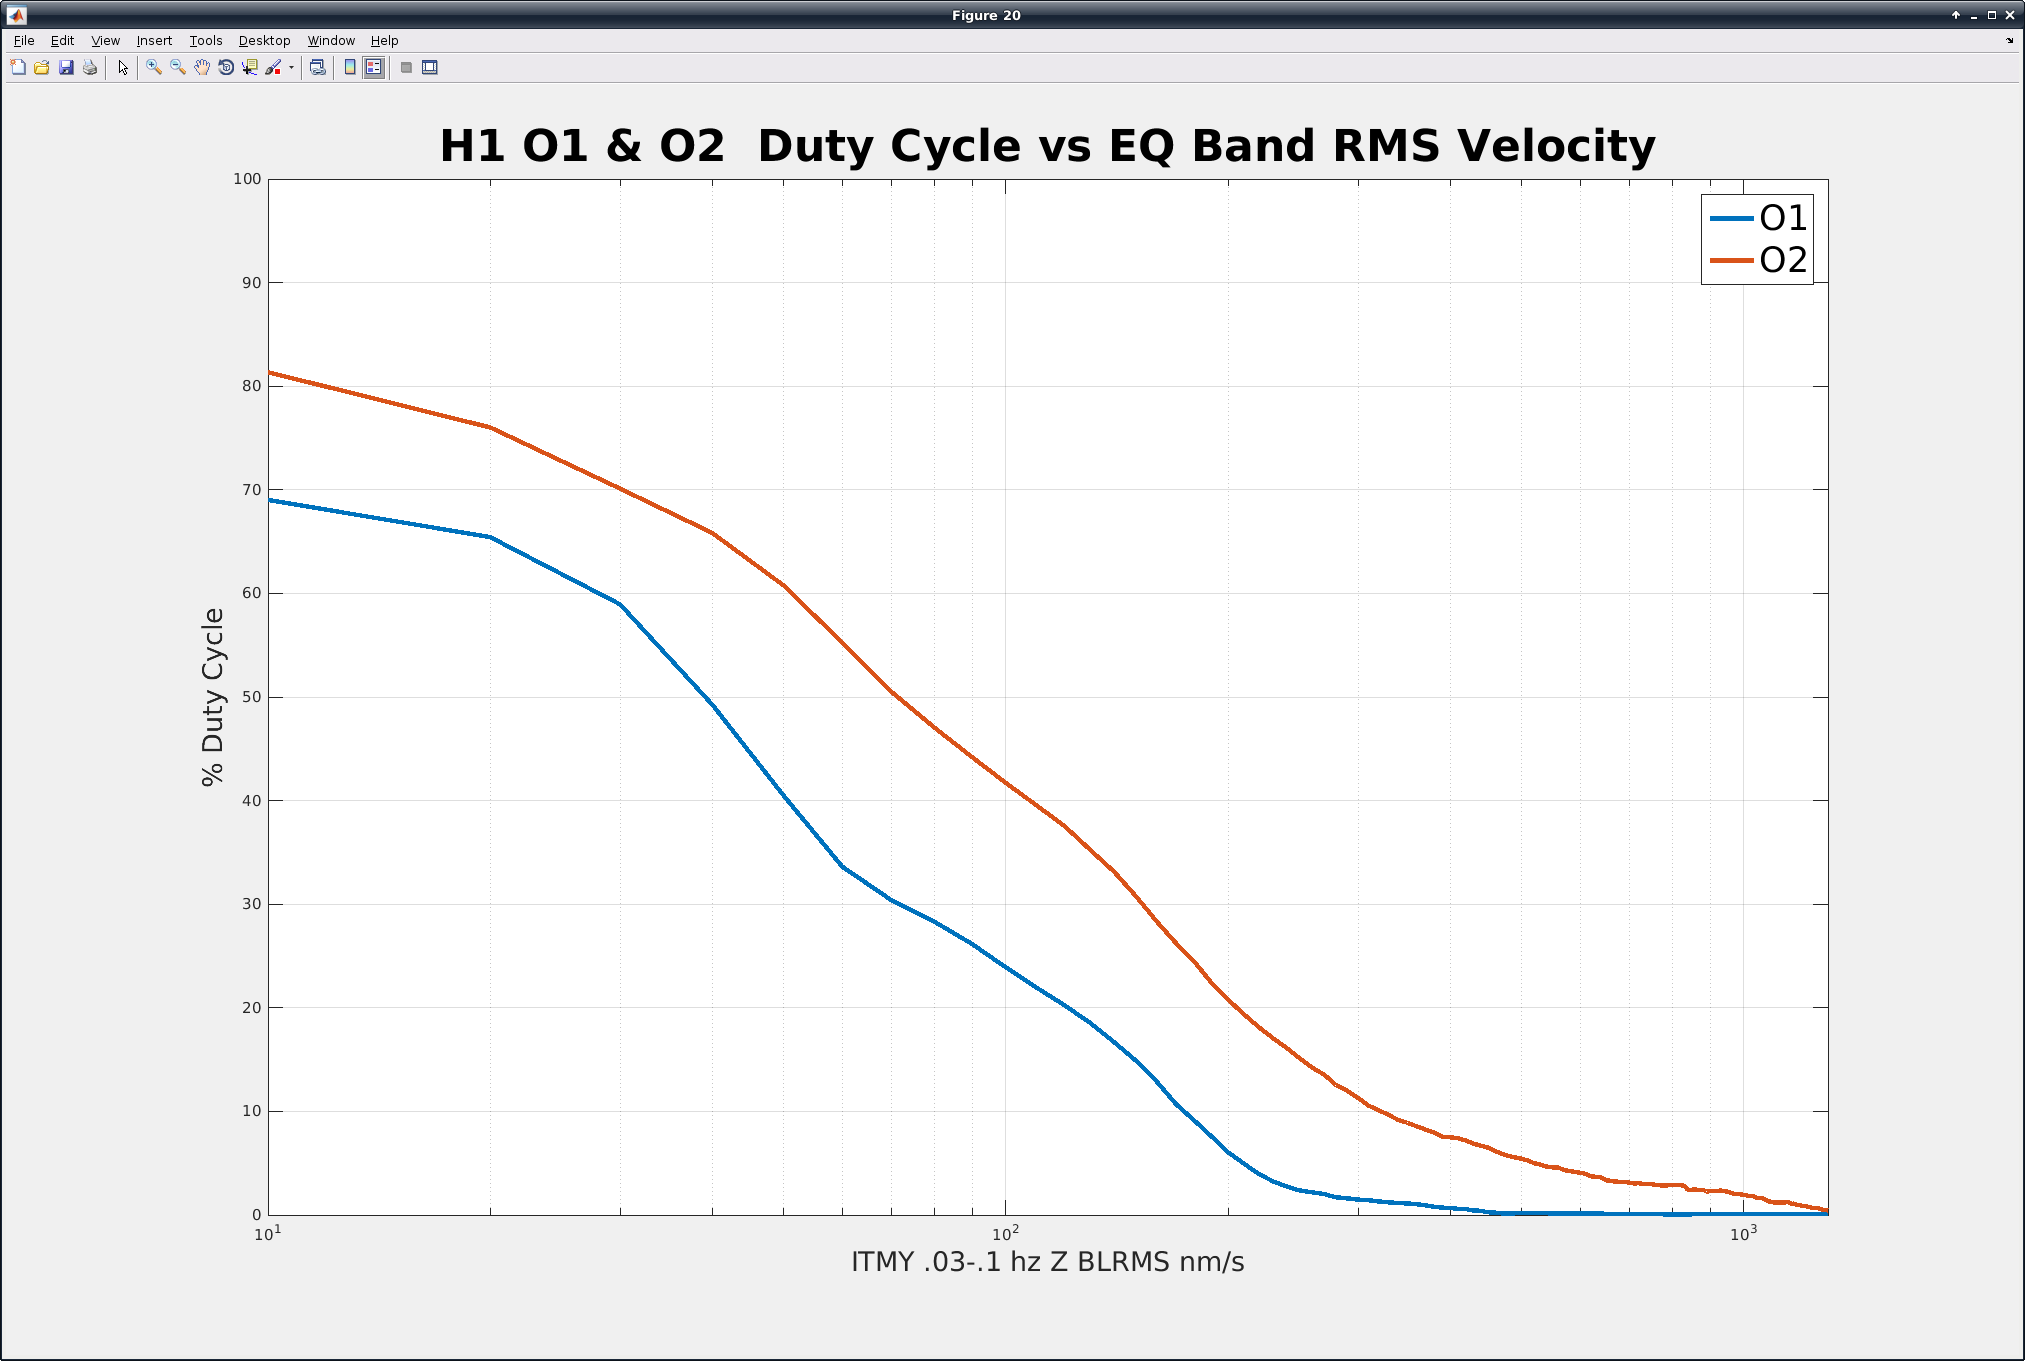
The second plot is a cumulative duty cycle (i.e. x-axis is again RMS ground velocity, y-axis is now the percent time the ISC_LOCK guardian was above DC READOUT while the ground was above the x-axis value). Again, some of the improved duty cycle is from the generally quieter O2 environment, but above 100-200 nm/s I think earthquakes are the main difficulty.
Some studies I would like to see (that this plot obscures) is what are the statistics on the largest peak ground velocities we can survive (similar to Chris Buchanan's study for O1, https://dcc.ligo.org/DocDB/0124/G1600348/002/Buchanan_O1_EQs_Feb2016_Final.pdf ) and does that change with the time of year? I'm not sure I'm clever enough for those.