SudarshanK, RickS
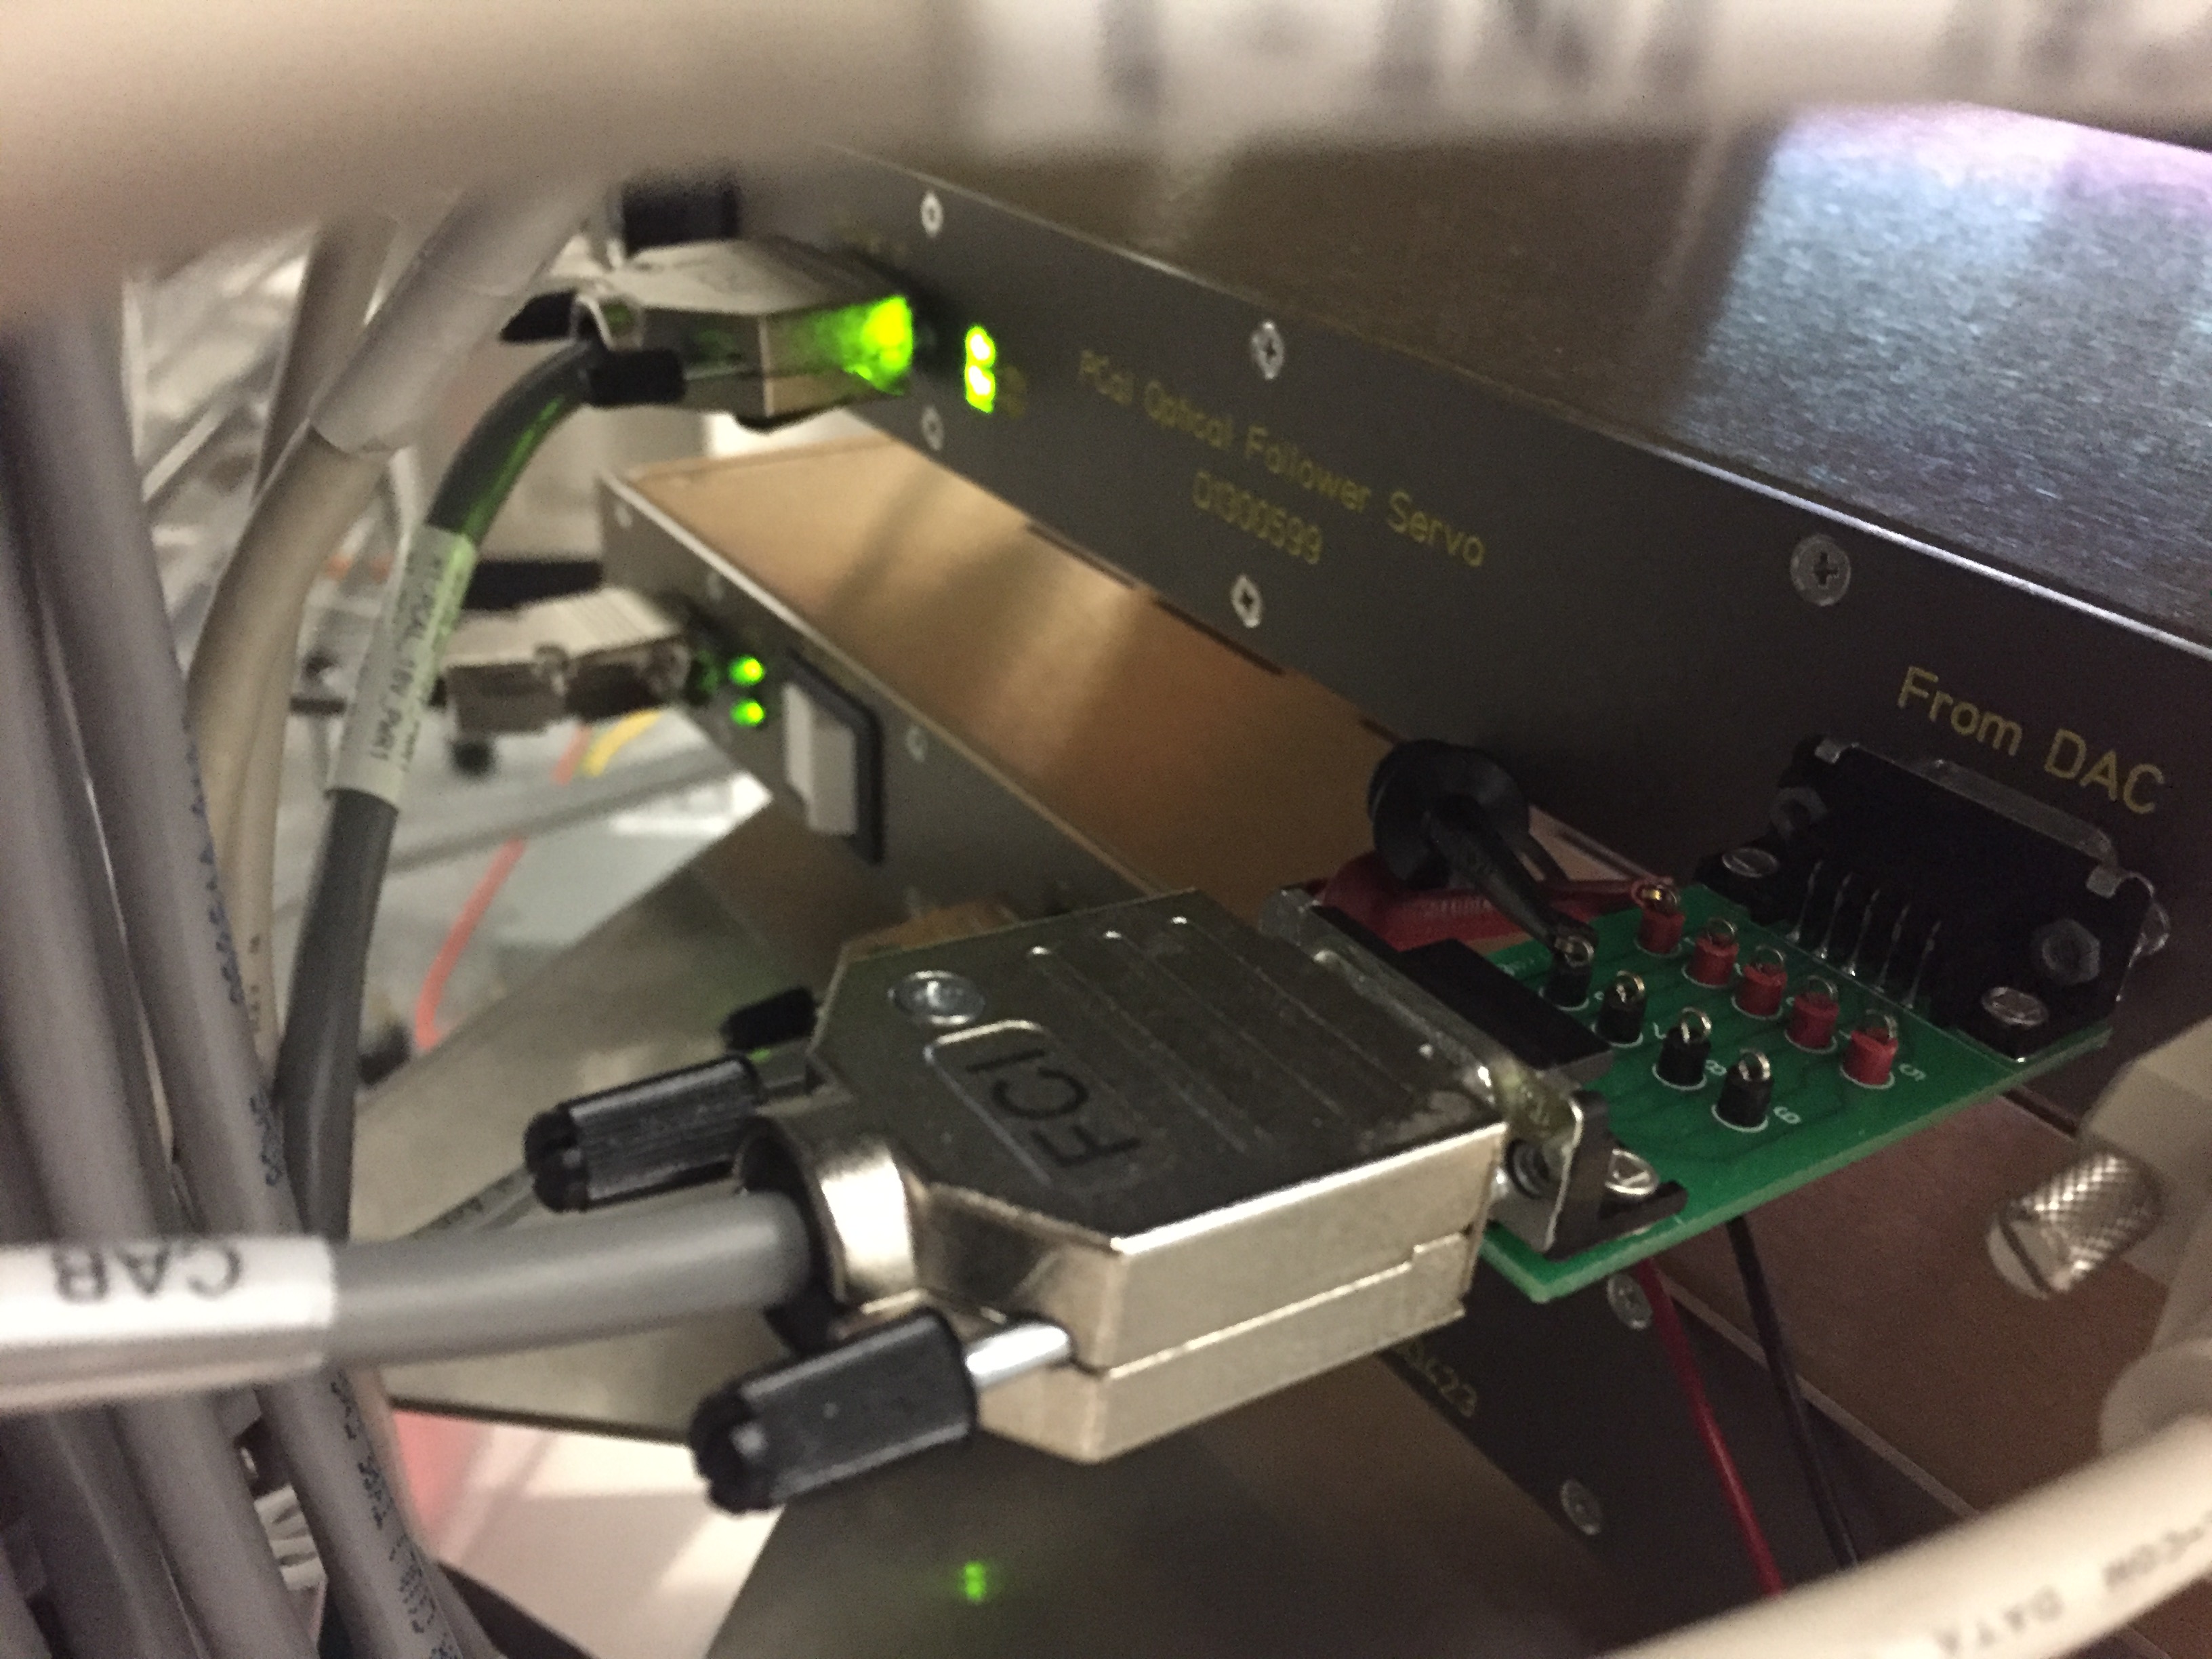
To study the downconversion of Pcal excitation we used a DB9 breakout at the back of the Pcal chassis and routed the excitation channel through H1:CAL-PCALX_WS_PD for now. This will be returned to its original configuration once the investigation is complete.
The PcalX is still fully functional and hardware injection can be carried out if needed. The WS_PD channel through which the excitation channel is routed is a spare channel that is only used during the end-station PD calibration.
Summary:
We have established that most of these down converted lines (the one that hurts us) reported in alog 36959 arise from the aliasing of the harmonics of the injected high frequency calibration lines. The lines that have the possibility to show up in the DARM are the ones that lie between 10 Hz to few hundred Hz. We can avoid these lines by selecting the high frequency calibration lines such that the aliased lines are not in the given low frequency region.
Details:
We ran into issues with low frequency lines (in 100 Hz range) showing up in DARM when we were running high frequency calibration lines in the region of 5.5 - 6 kHz. This was first noticed in this LHO alog 36959 and LLO alog 34346. To understand this problem we wanted to find where these lines were being produced, photon calibrator itself or the data acquisition system. We disconnected the cable that inputs the excitation to the Pcal electronics and used a DB9 breakout box to acquire the excitation signal so that we were getting these signal before it enters the Pcal system. We rerouted this signal through the H1:CAL-PCALX_WS_PD channel which was one of the unused Pcal channel.
The first plot shows the spectrum with a 5036 Hz excitation line (in blue) and without an excitation (in red). Some of the extra lines seen in the blue spectra are the result of aliasing of the higher order harmonics of the injected as well as the imaged lines (imaging happens when going from 16khz to 64 kHz). In this particular case the 68 Hz line is the aliasing of the 13th order harmonic of 5036 Hz injected line. The second plot shows the predicted aliased lines (based on harmonics and upsampling) that would be produced for 5036 Hz injected line. Some of the predicted lines show up in the actual spectrum but not all and not all line that are present in the spectra are predicted. However, the lines that show up above few hundred Hz will be well below the DARM signal as the actuation transfer function goes as 1/f^2. Shivaraj, at LLO has taken some additional measurement to see if we can find the source of all the aliased lines. Report to follow.

Tagging DetChar and CDS on this, so that the CW group can follow up with them to understand how to flag the data for this known issue.
RickS, SudarshanK,
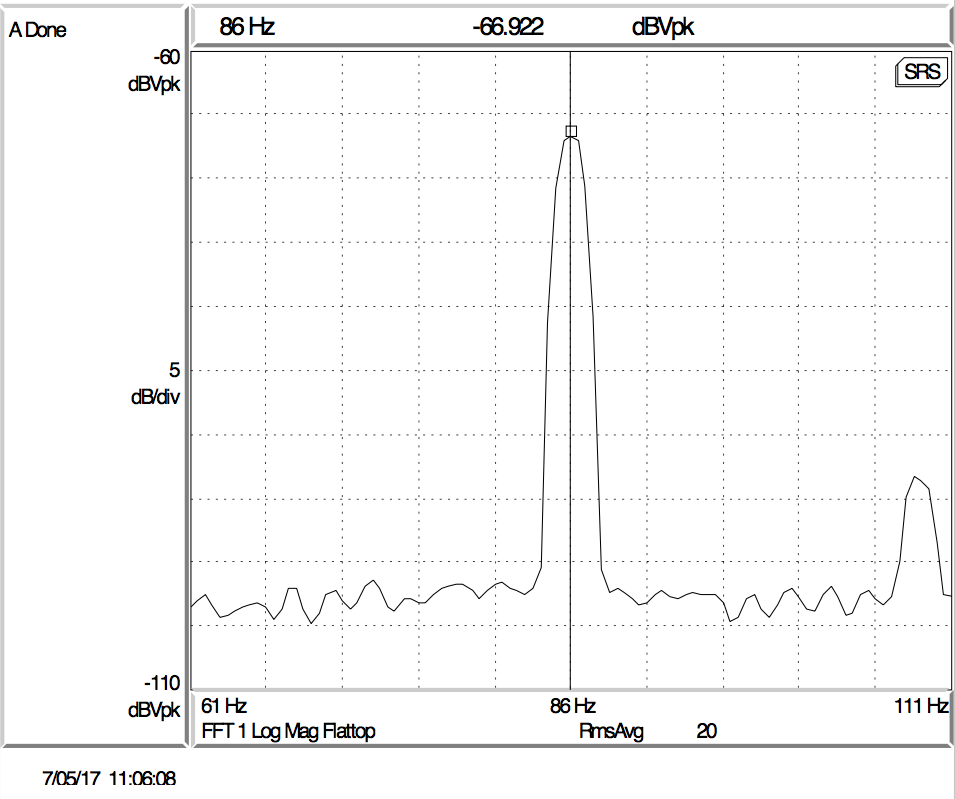
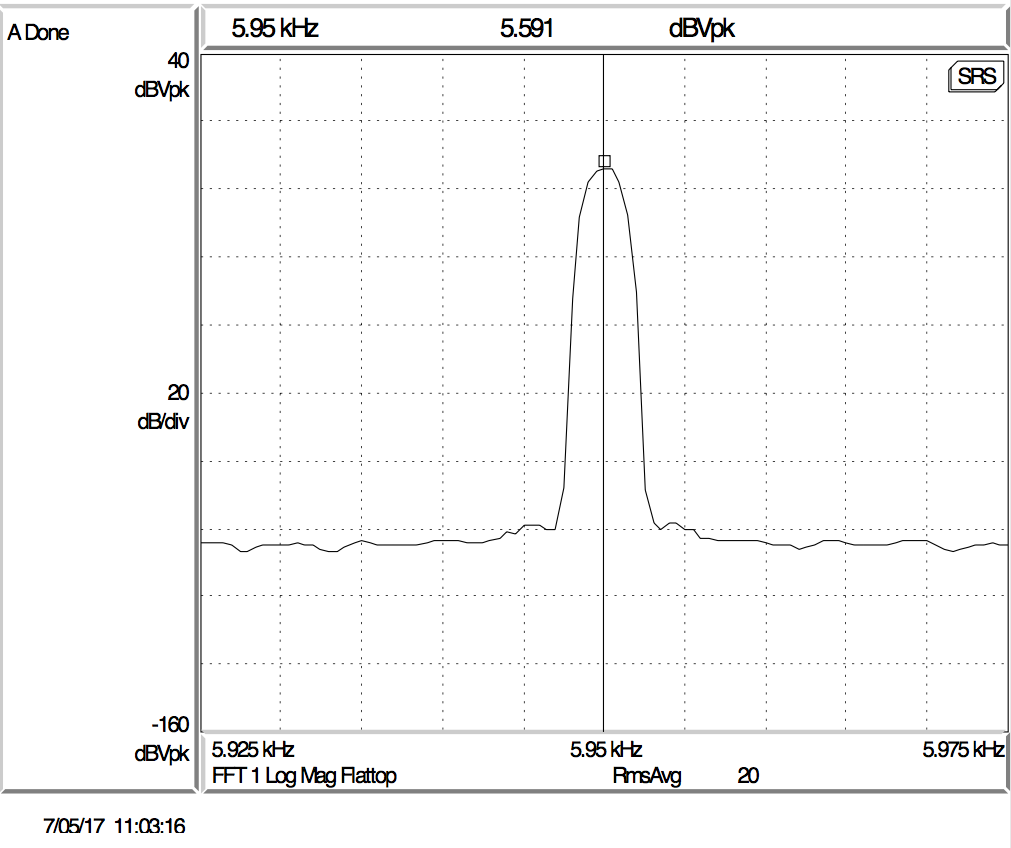
The breakout box used to acquire the analog excitation signal on X-end Pcal has been removed and the Pcal configuration is now back to normal. During the visit, Rick repeated some measurement that reproduced the 86 Hz line when a Pcal line was injected at 5950 Hz with an excitation amplitude of 25000 cts. This measurement was made at the DAC (analog) output using SR785. The 86 Hz line is about 70dB below the injected line. This still does not explain why we don't see 86 Hz line in analog output in the measurement (LLO alog 34495) that Shivaraj made using Agilent signal analyzer. :(
On Jeff's request, I am putting down the empirical formula that predicts the lowest frequency down-converted lines for each high frequency excitation.
DCF = 2^16 - EF * n, where DCF is the down converted frequency, EF is the excitation frequency and n is the harmonic number. For frequencies around 4-6 kHz, the harmonic number that produces the line in the bucket are between 11 and 13.
I don't have a physical intuition on why this happens. If we were looking at the resampled 16 kHz signals, the presence of these lines would not be surprising because these would be produced because of aliasing but we see these low frequency lines on the DAC output, measured using the analog spectrum analyzer. Plots showing the same are attached.

