aaron.viets@LIGO.ORG - posted 05:02, Tuesday 27 June 2017 (37158)
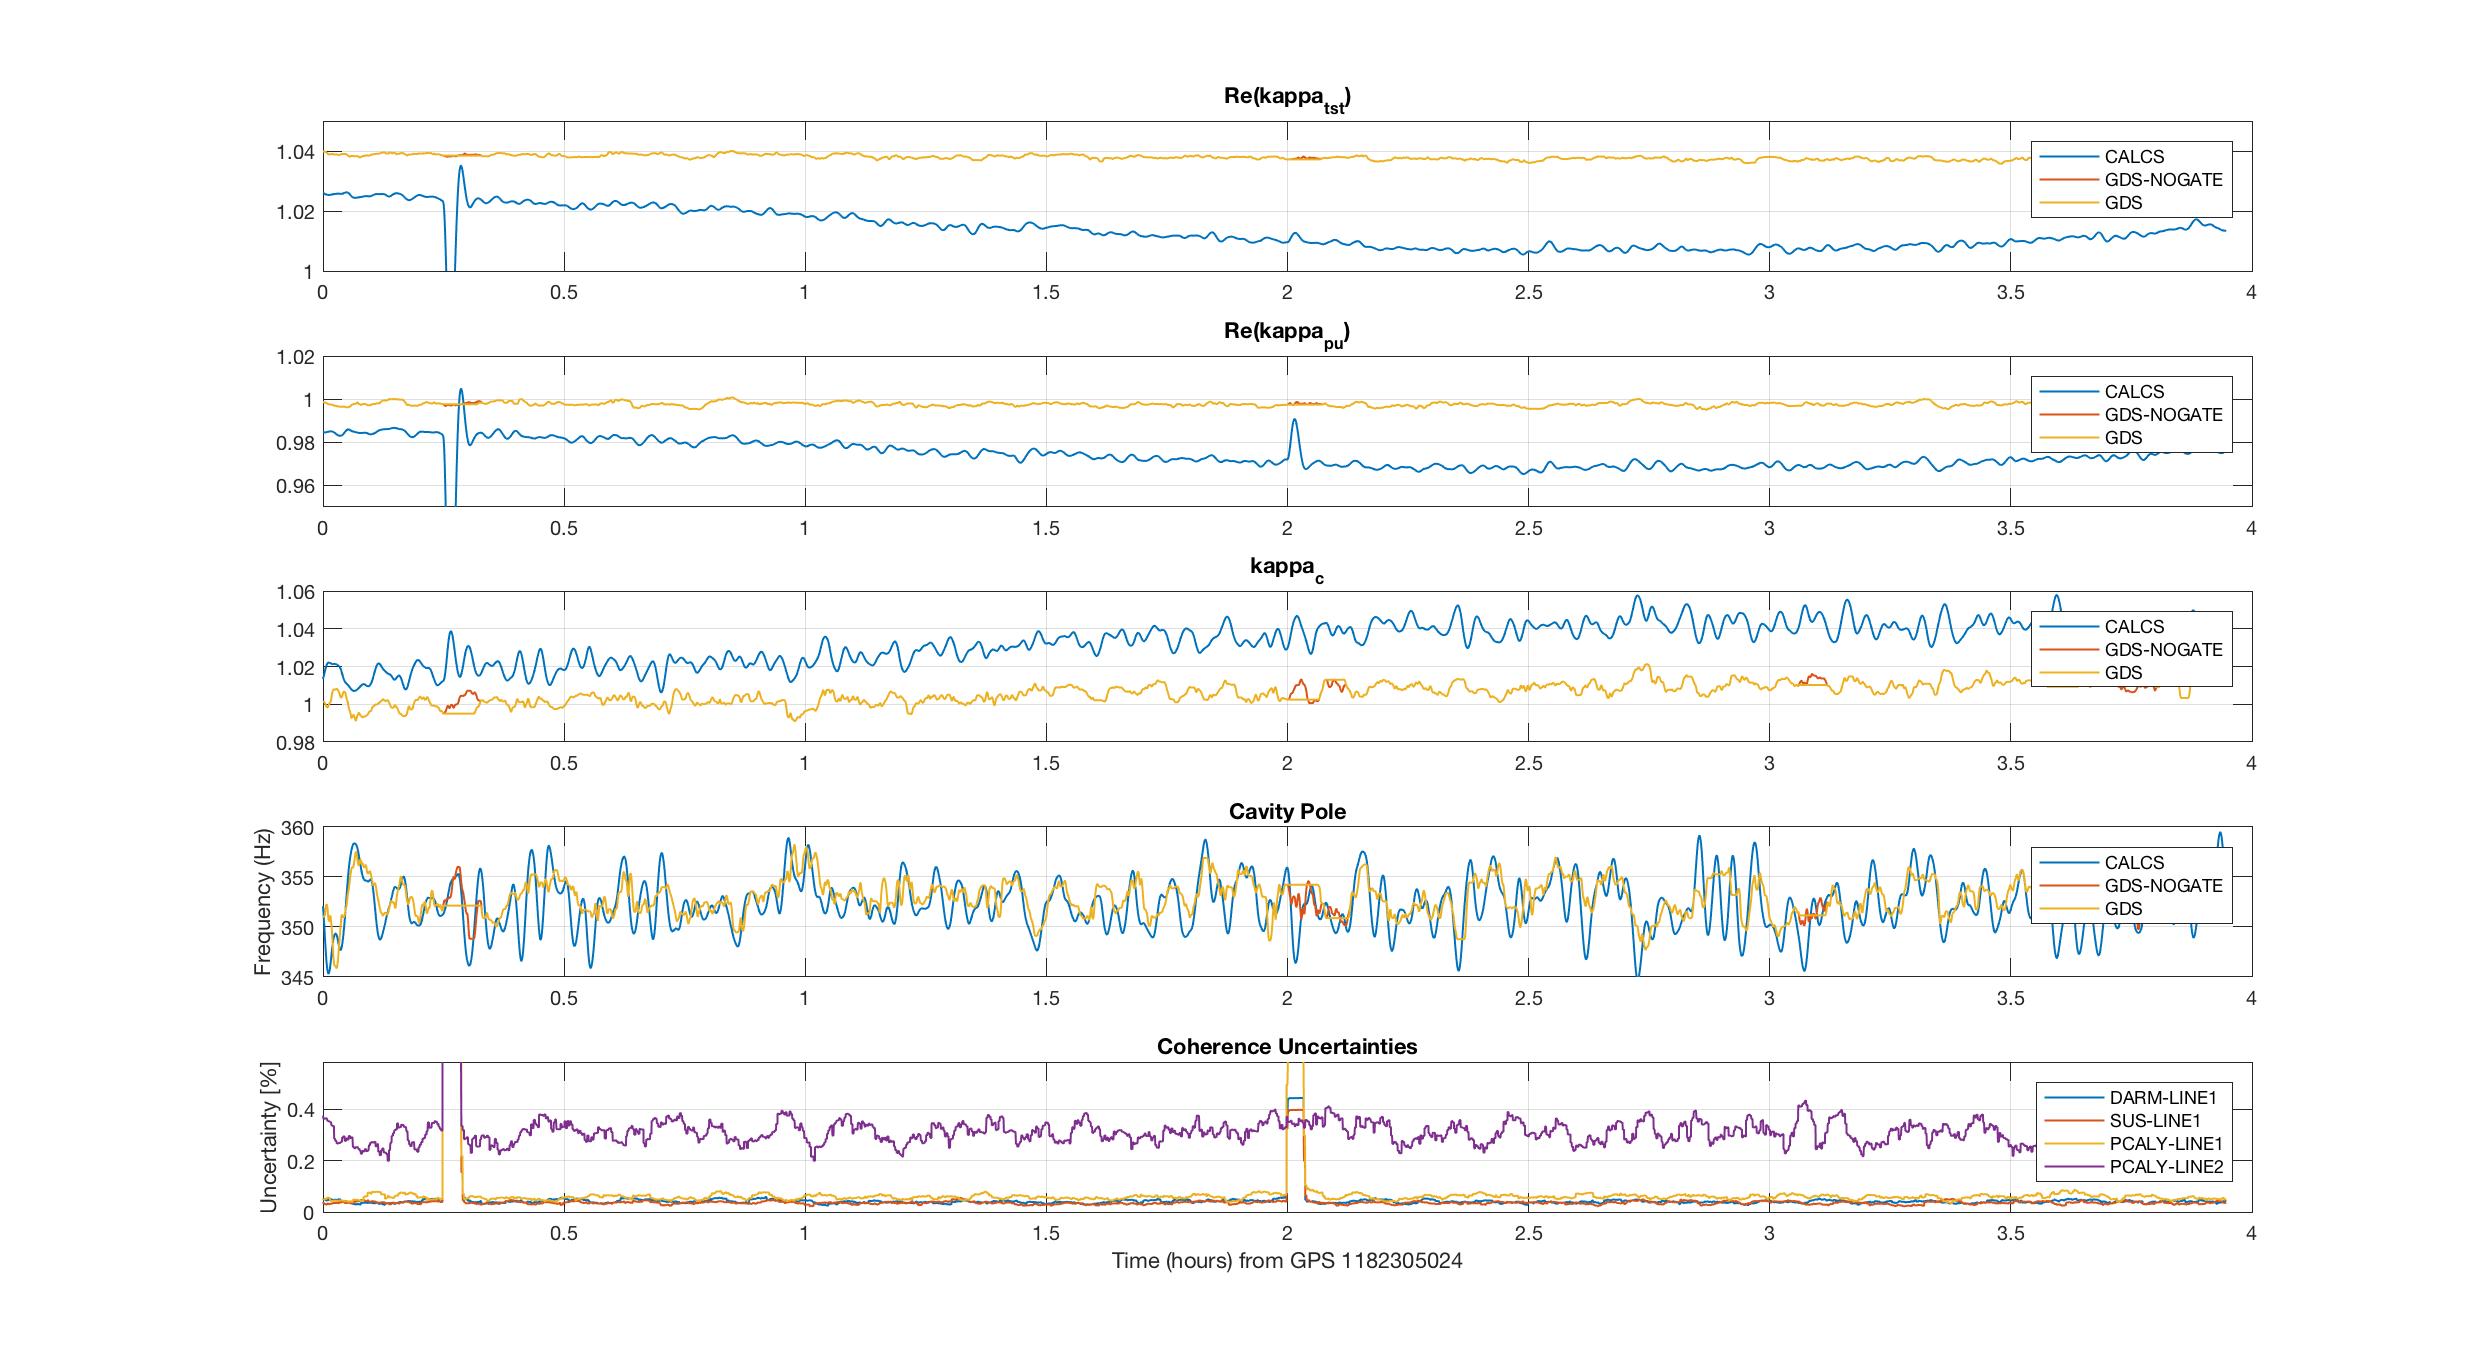
Kappas computed with TX PD compared to RX PD
The attached plot contains time series of the kappas from about 2 - 6 UTC on June 24. Note that the GDS curve (which used TX PD) for kappa_{tst}, kappa_{pu}, and kappa_c remains stable, while the CALCS curve (which used RX PD) shows an oscillation likely caused by temperature dependent pcal clipping.

For comparison to a longer stretch of data, see the summary pages:
https://ldas-jobs.ligo-wa.caltech.edu/~detchar/summary/day/20170624/cal/time_varying_factors/
Also, note the correlation with temperature as seen on the bottom right plot here:
https://ldas-jobs.ligo-wa.caltech.edu/~detchar/summary/day/20170624/cal/pcal_y/

A similar daily trend can be seen for the past week or so.
Images attached to this report