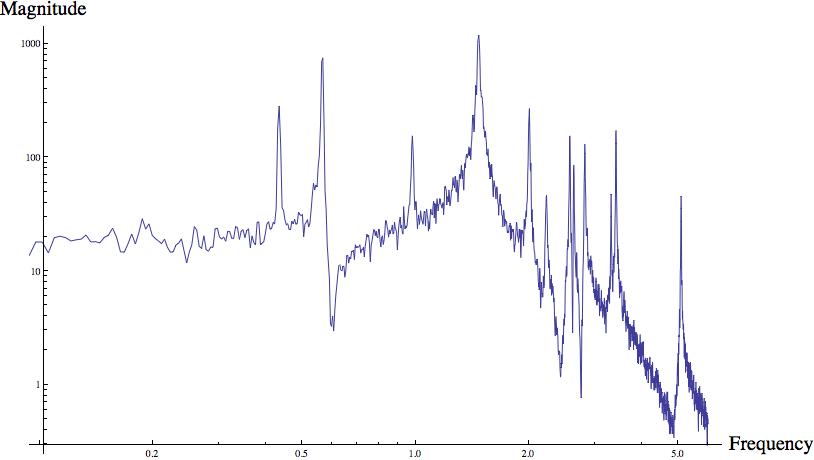
During the past few weeks I have been working on calibrating the sensor readouts from the Quad Suspension OSEMs on all four stages: main chain top M0, reaction chain top R0, upper intermediate mass (L1 stage or UIM), and penultimate mass (L2 stage or PUM). One way to check the OSEM readouts is to measure their response to an excitation of the top mass, and then compare this to the response predicted by the 20120601TMproductionTMrehang mathematical model. The Quad Suspension has a 0.43 Hertz mostly "Longitudinal" mode, and exciting this mode by shaking the main chain top mass will result in peaks at 0.43 Hz for all OSEM sensor spectra (M0F1 spectrum attached as an example). Comparing the peak height data of each OSEM at 0.43 Hz to the data predicted by the model should show any dissimilarity between the predicted behavior of the OSEM sensors and what is actually seen.
The file OSEMsensorplot.pdf shows the magnitude of the OSEM sensor readouts (vertical axis) for each OSEM ID(horizontal axis) scaled so that the magnitude of the Main Chain F1 OSEM is always one. I tried a few different methods of measuring the power spectra that generate this plot, and they are labeled on the side of each plot. In each case damping of the top stage reaction and main chains was OFF.
The model prediction is the sensor response at the 0.43 Hz peak for each OSEM derived from the mathematical model of the quadruple suspension. The measurements labeled "White Noise" are from excitations of white noise into all Main Chain TOP degrees of freedom (Longitudinal, Transverse, Vertical, Roll, Pitch, and Yaw). These white noise power spectra were collected WHILE the excitation was being performed. In the 7/3/2012 White Noise measurement the coherence in the L2 stage OSEMs was terrible, and so these data points are not reliable. The measurements labeled "Offset" are derived from an excitation where each main chain TOP degree of freedom was displaced with a static offset value after a turn-on ramp time of 10 seconds, then this static offset was instantly changed to zero to let the suspension swing freely. Lastly the measurements labeled "Sine Relax" were taken by exciting the main chain TOP mass Longitudinal DOF with a 0.43 Hz sine wave drive for about five minutes, then the drive was turned off and the suspension allowed to swing freely for about 2 minutes before the power spectra were taken.
The sensor plot shows that the different measurement approaches lead to consistent OSEM data, but we see immediately that the lower stages have some problems. The L1 stage magnitudes on each suspension appear slightly lower than predicted, but only ITMY OSEM L1LL is way off. This could be a problem with the L1LL alignment or an electronic issue that fails to correctly communicate the position of the flag on that sensor.
The L2 stage is troubled with multiple symptoms, each OSEM is well below the model prediction. I am still struggling to understand why the response is so small. One glaring problem is that the L2UR sensors on both ETMY and ITMY are practically zero compared to the other L2 OSEMs. I suspect that these specific sensors dead or barely working, but will need to check this somehow.