So we have all these neon filled pods in the vacuum system and there was lots of discussion and concern about them but I don't think anything was ever done about that concern after installation.
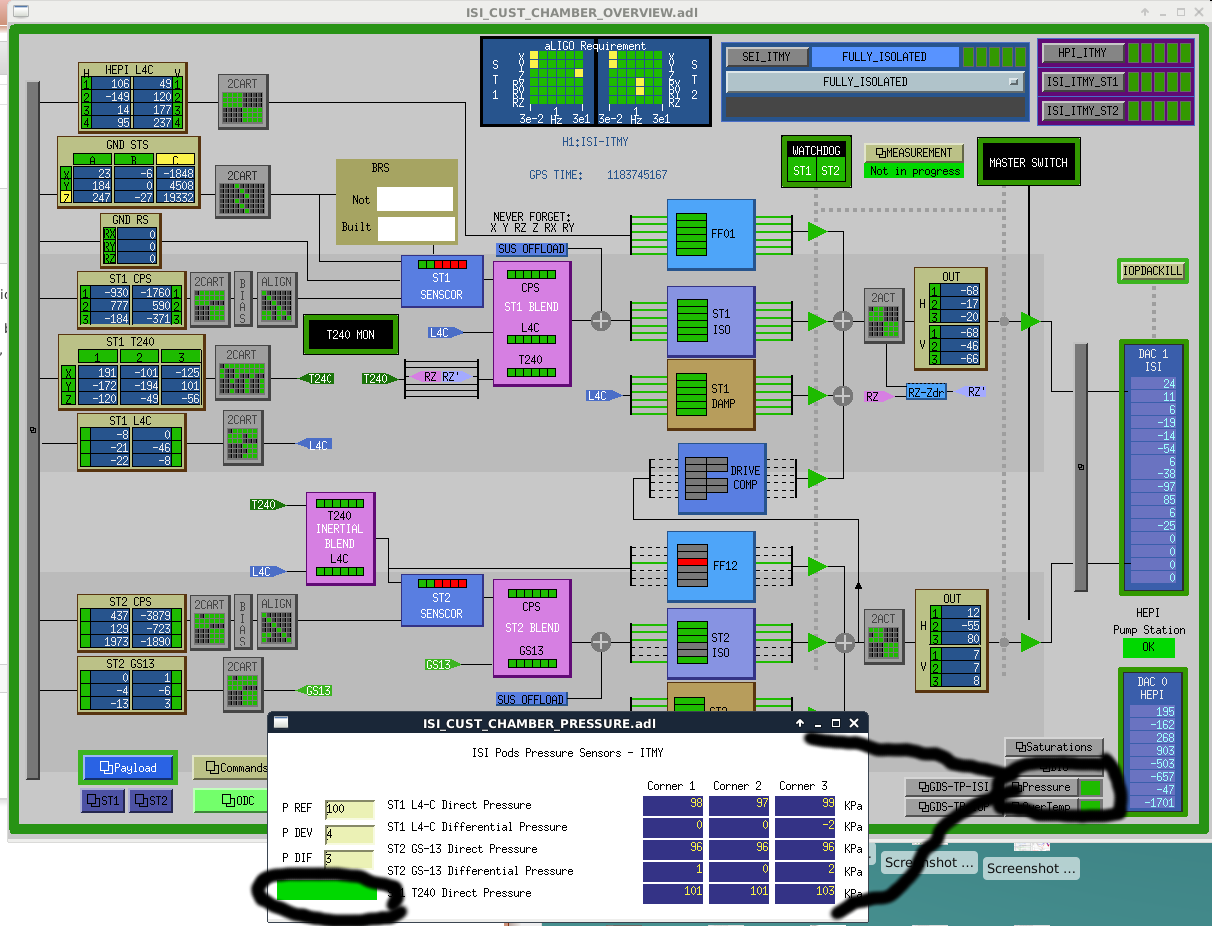
It has been on my list to do something for some time but the differences in the BSC and HAM models slowed me down in implementing anything. The BSCs have an epics setable widget 'level' which could be alarmed on but for some reason there is a reluctance to put an alarm on them. Of course my 'alarm' is the old style EPICS alarm handler rather than the modern 'chatty cathy' or diag guardian. Here nor there, at least at LHO, other than a green widget becoming red on the BSC Overview (see 1st attachment,) a pod could vent and we'd be none the wiser. On the HAMs, maybe because the the HAMs 2 3 6 vs 4 5 differences, no alarm level infrastructure is implemented in the model. The hams could be given an alarm system like the BSCs have but it would have to move from the master level to the individual level. Of course, the alarming could just be put on the signals rather than relying on the model to calculate the color of the medm widget.
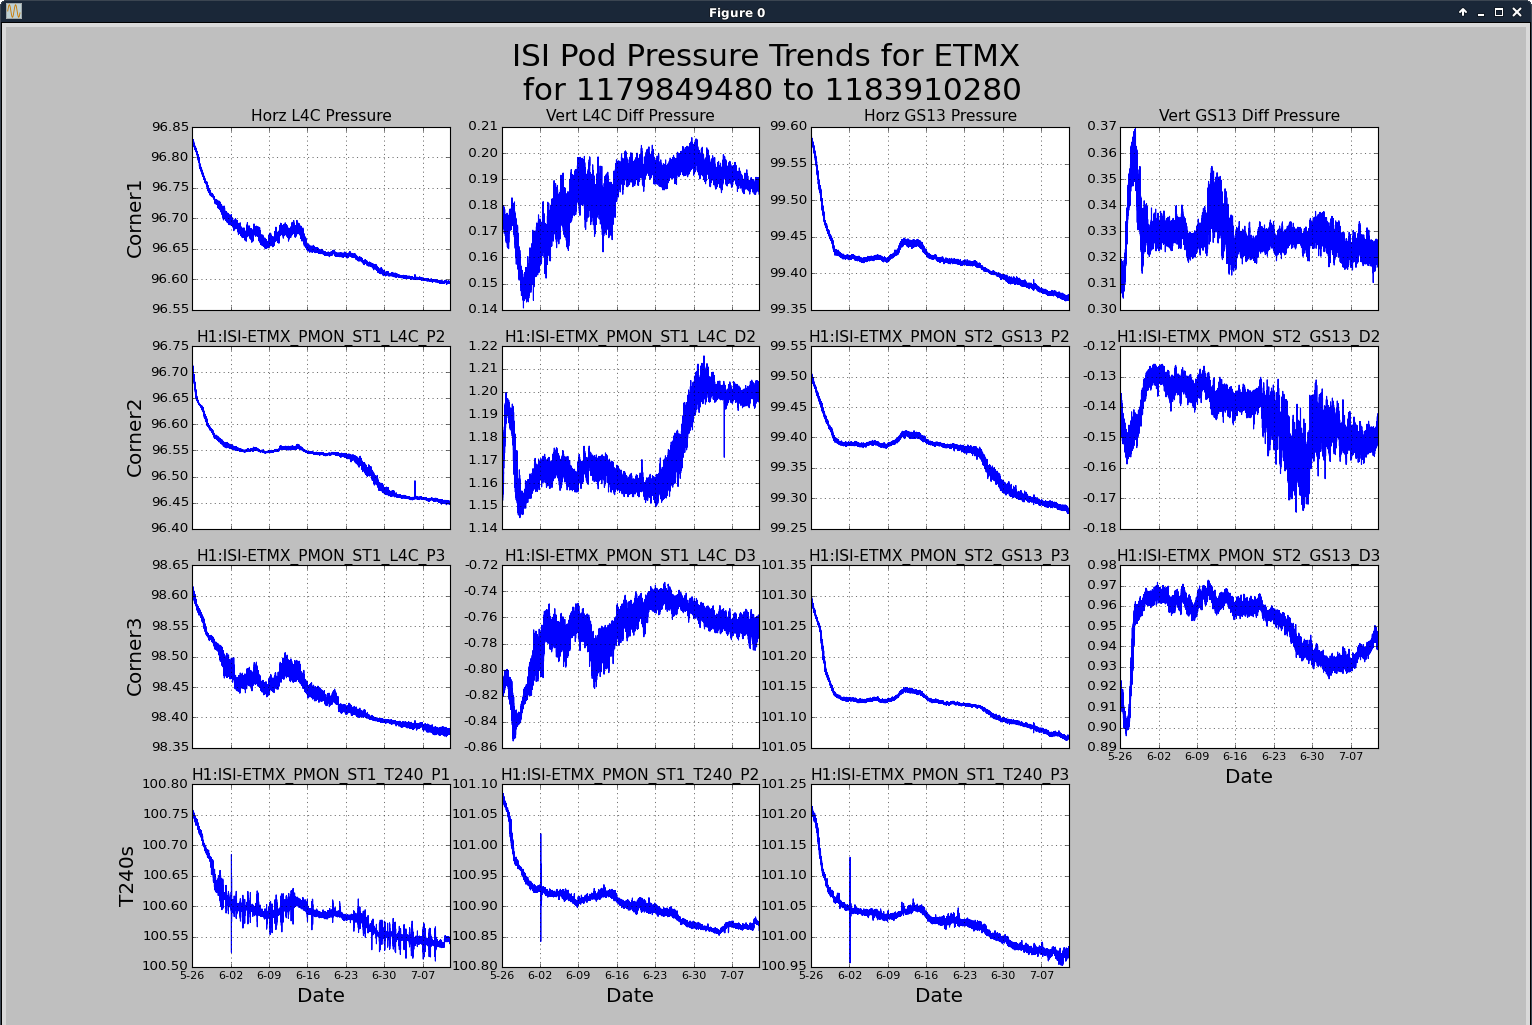
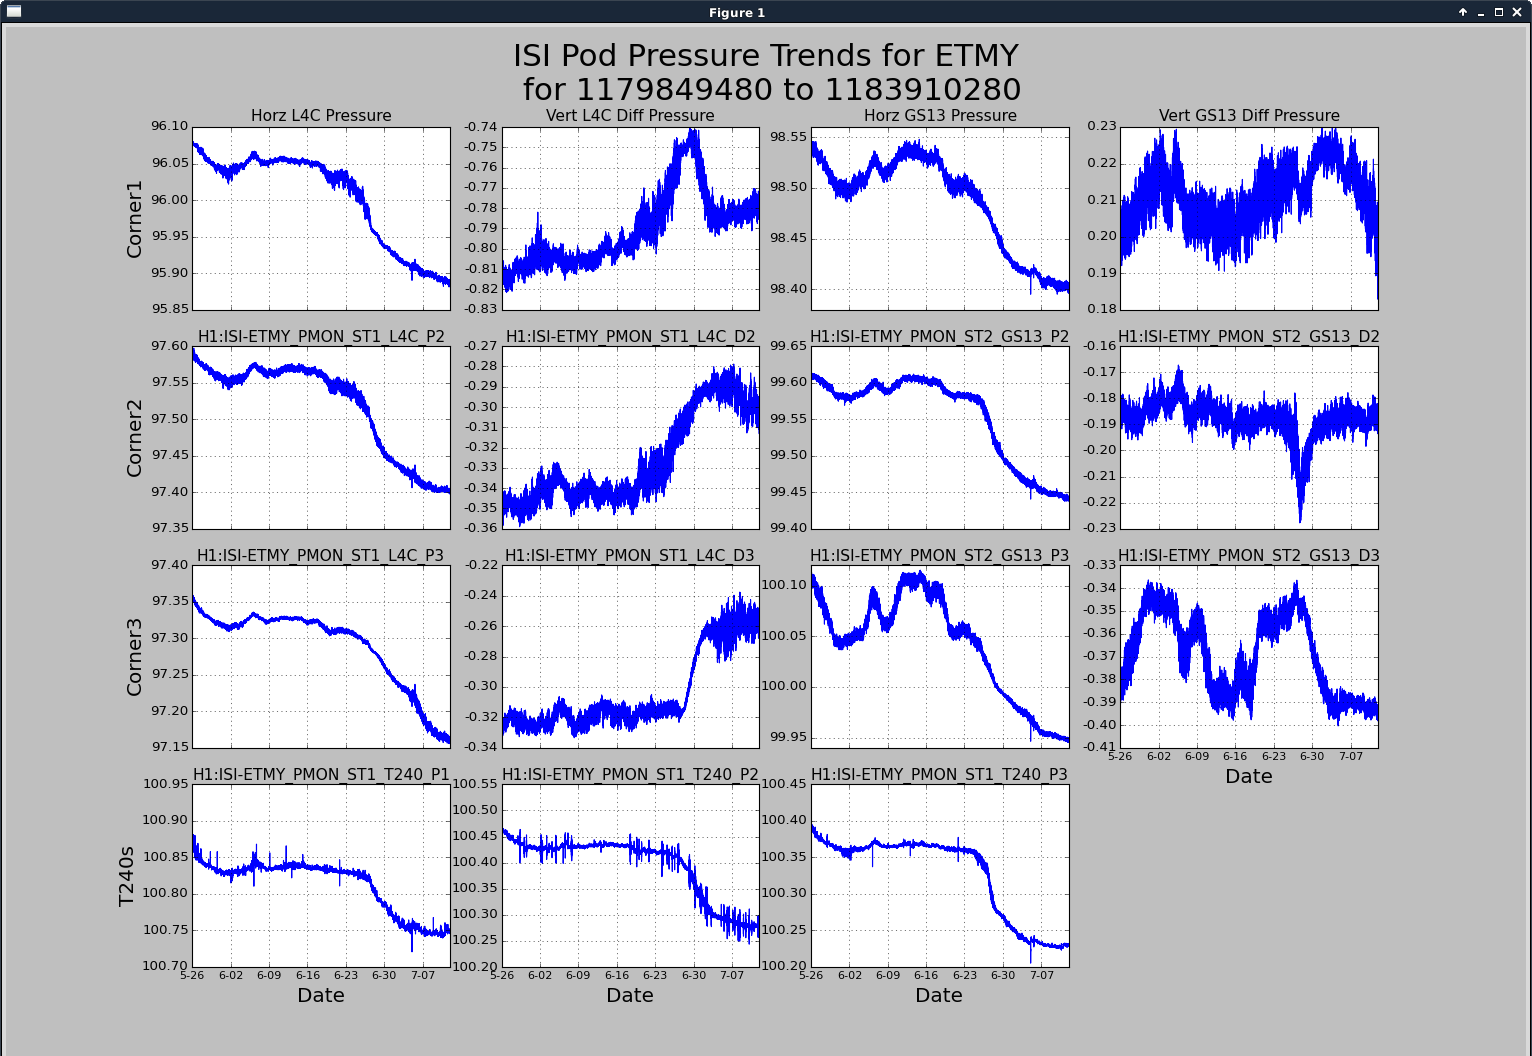
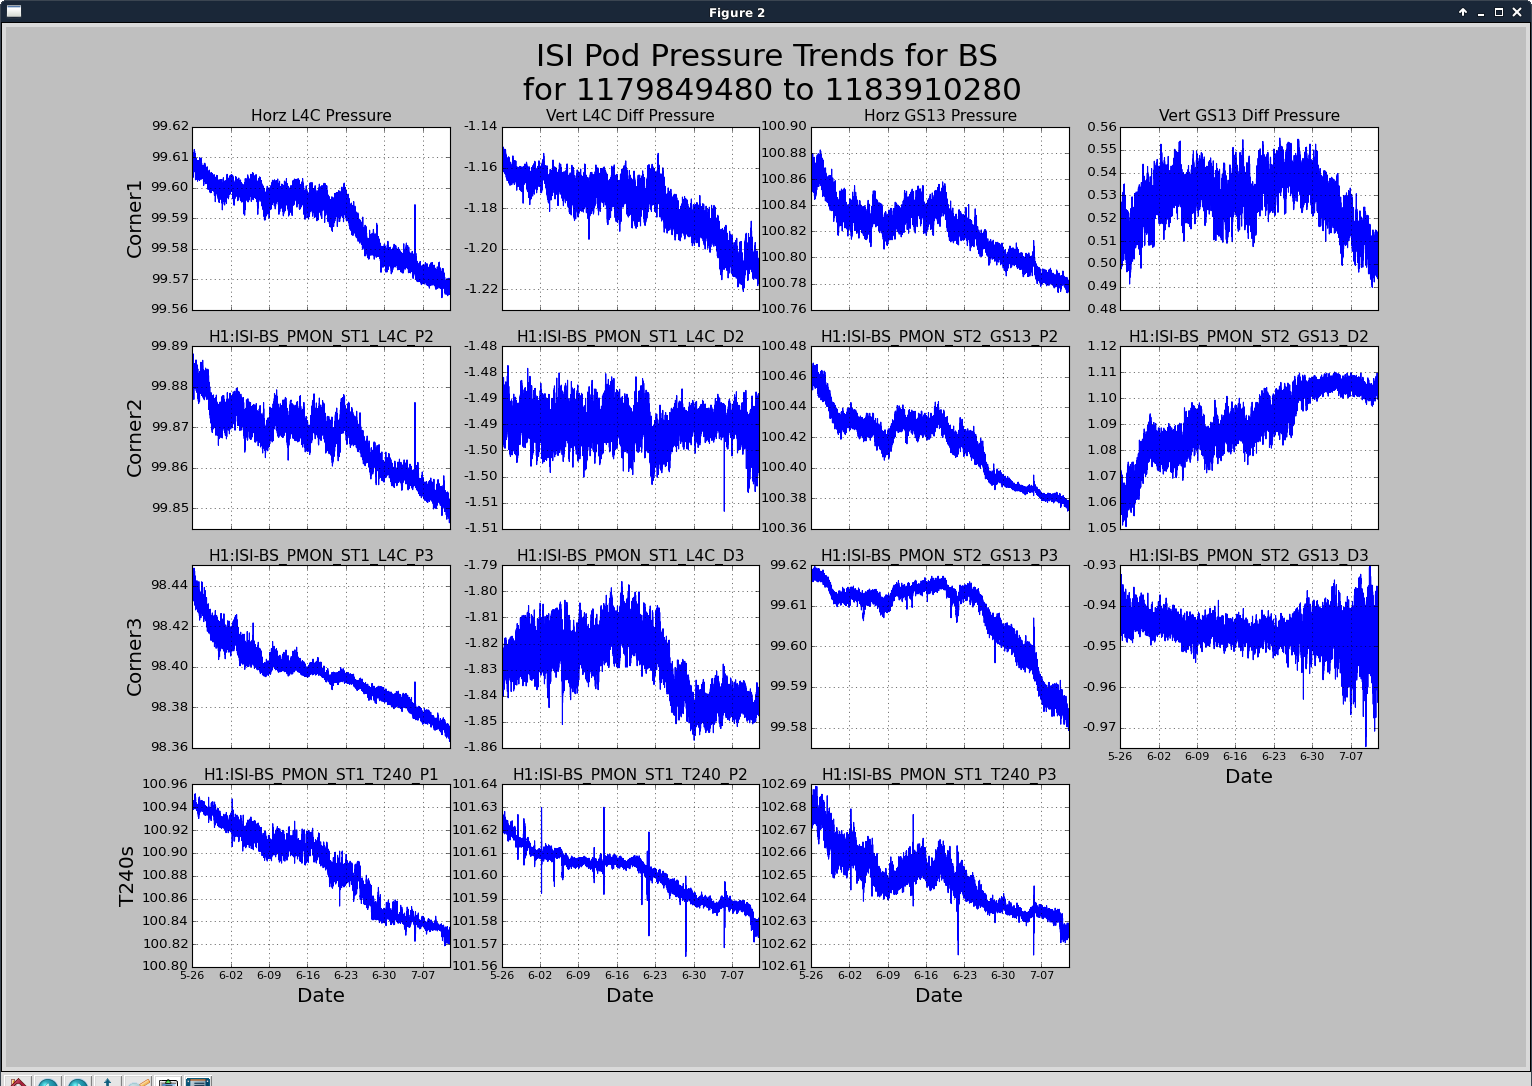
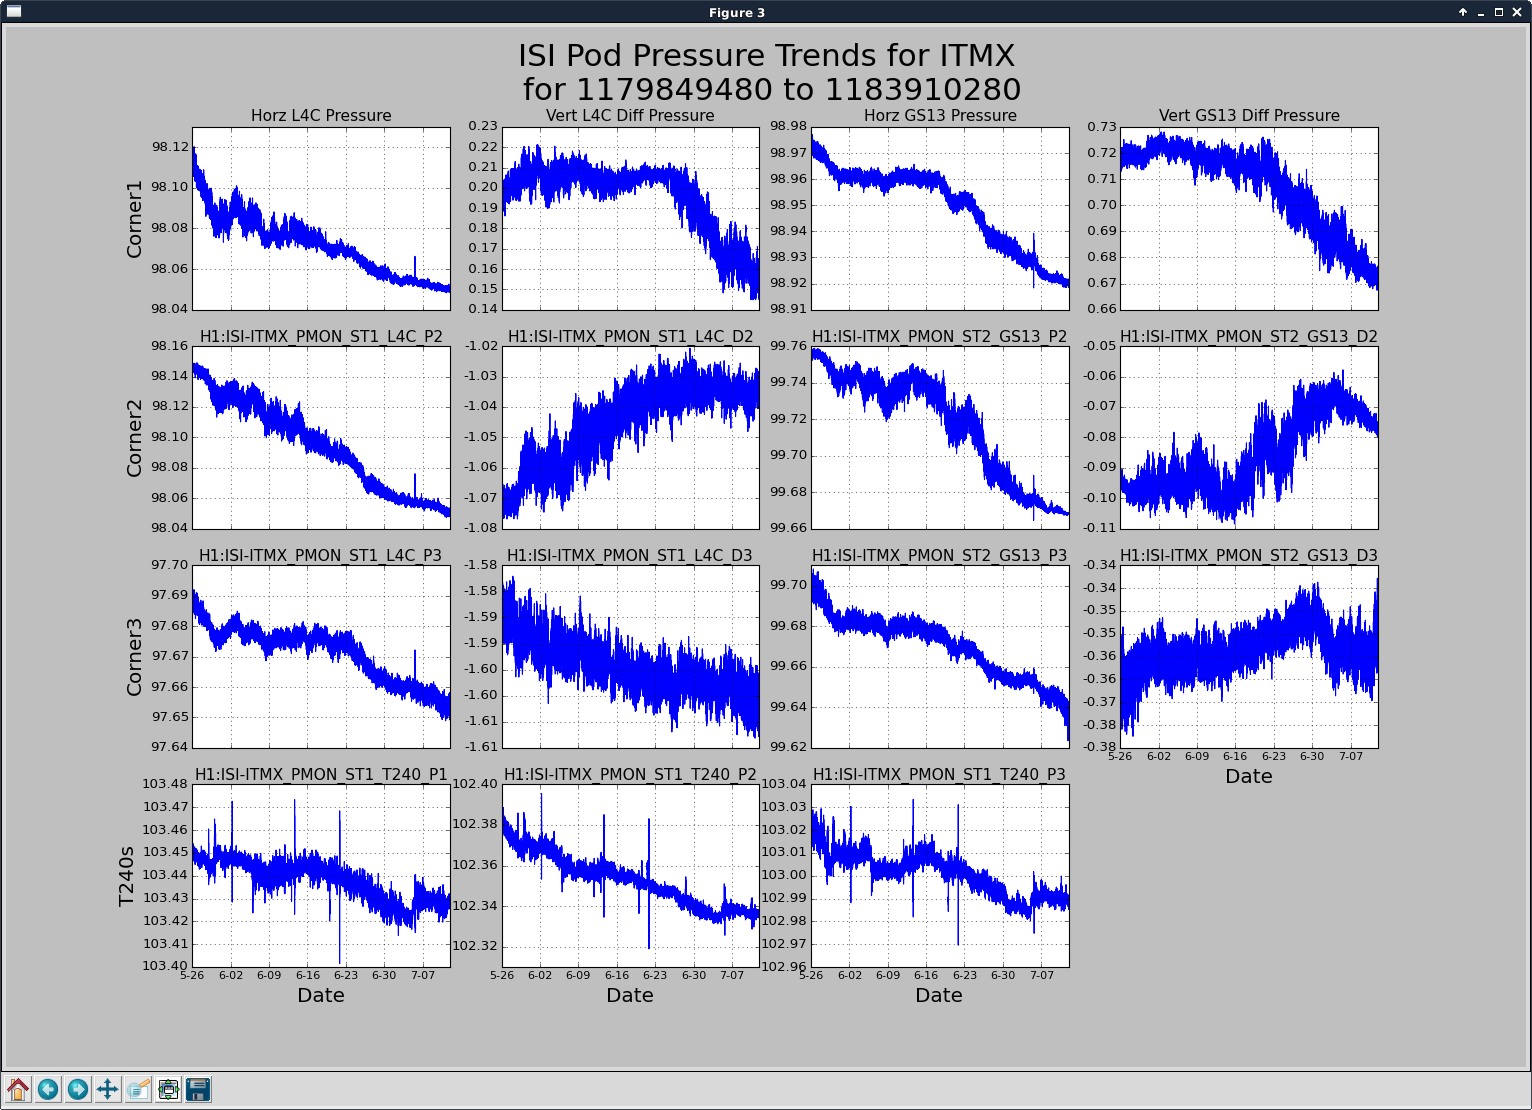
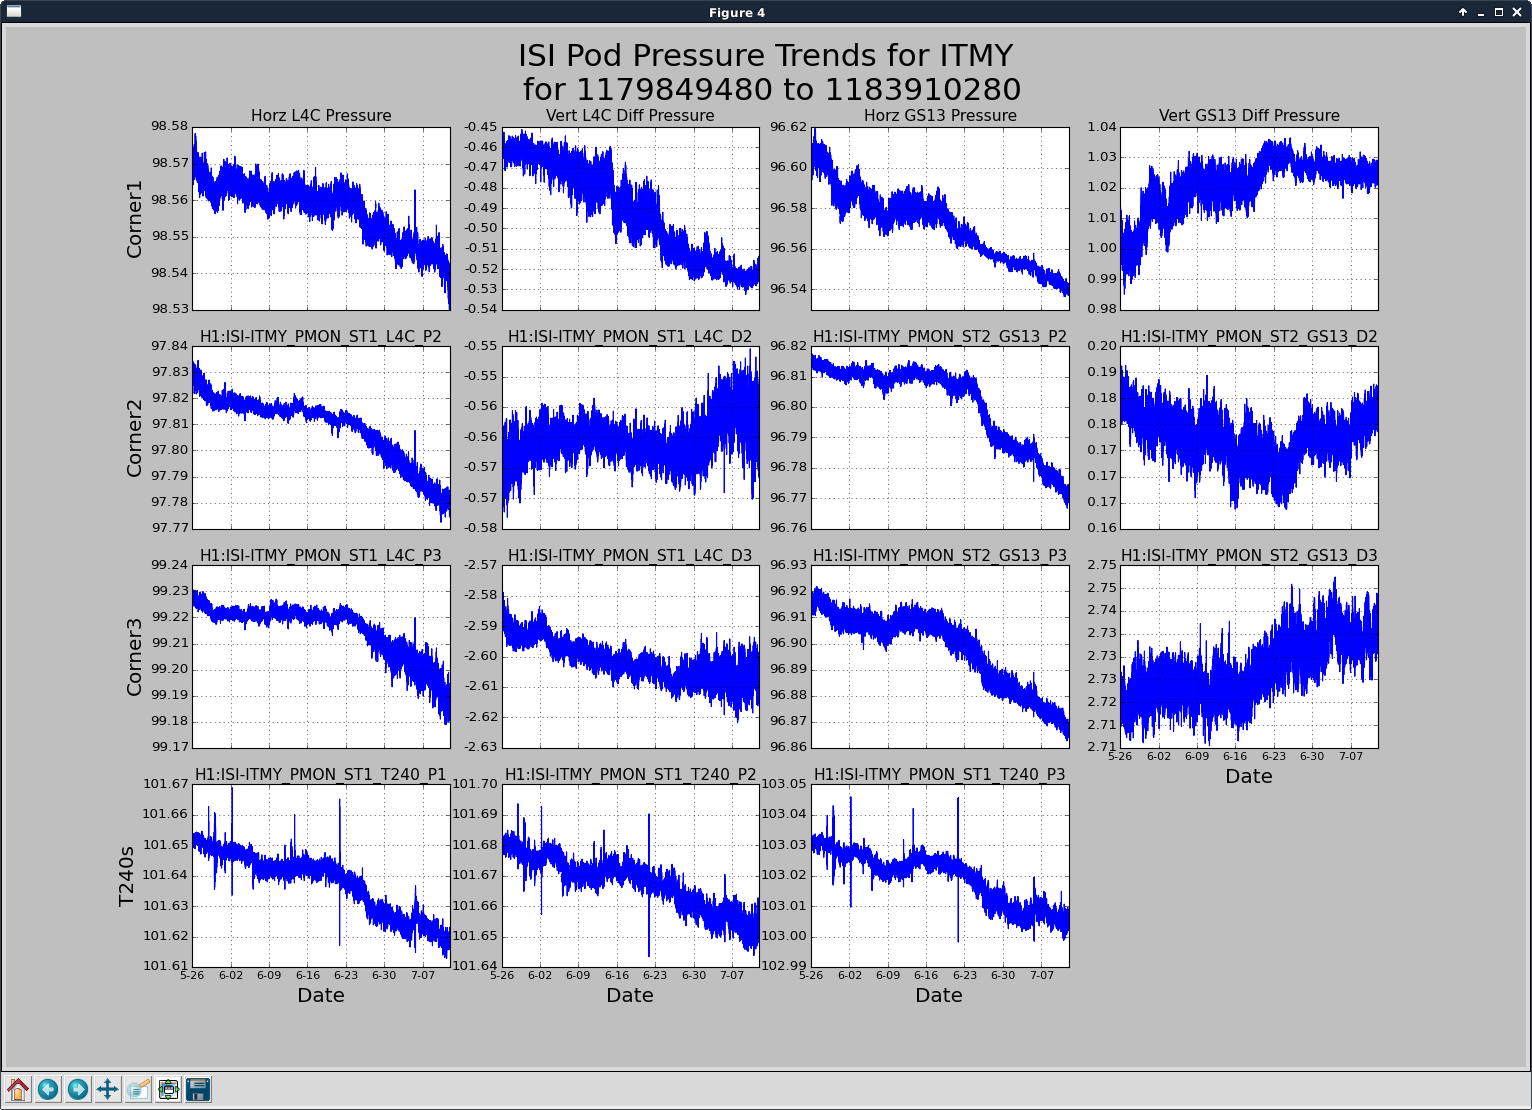
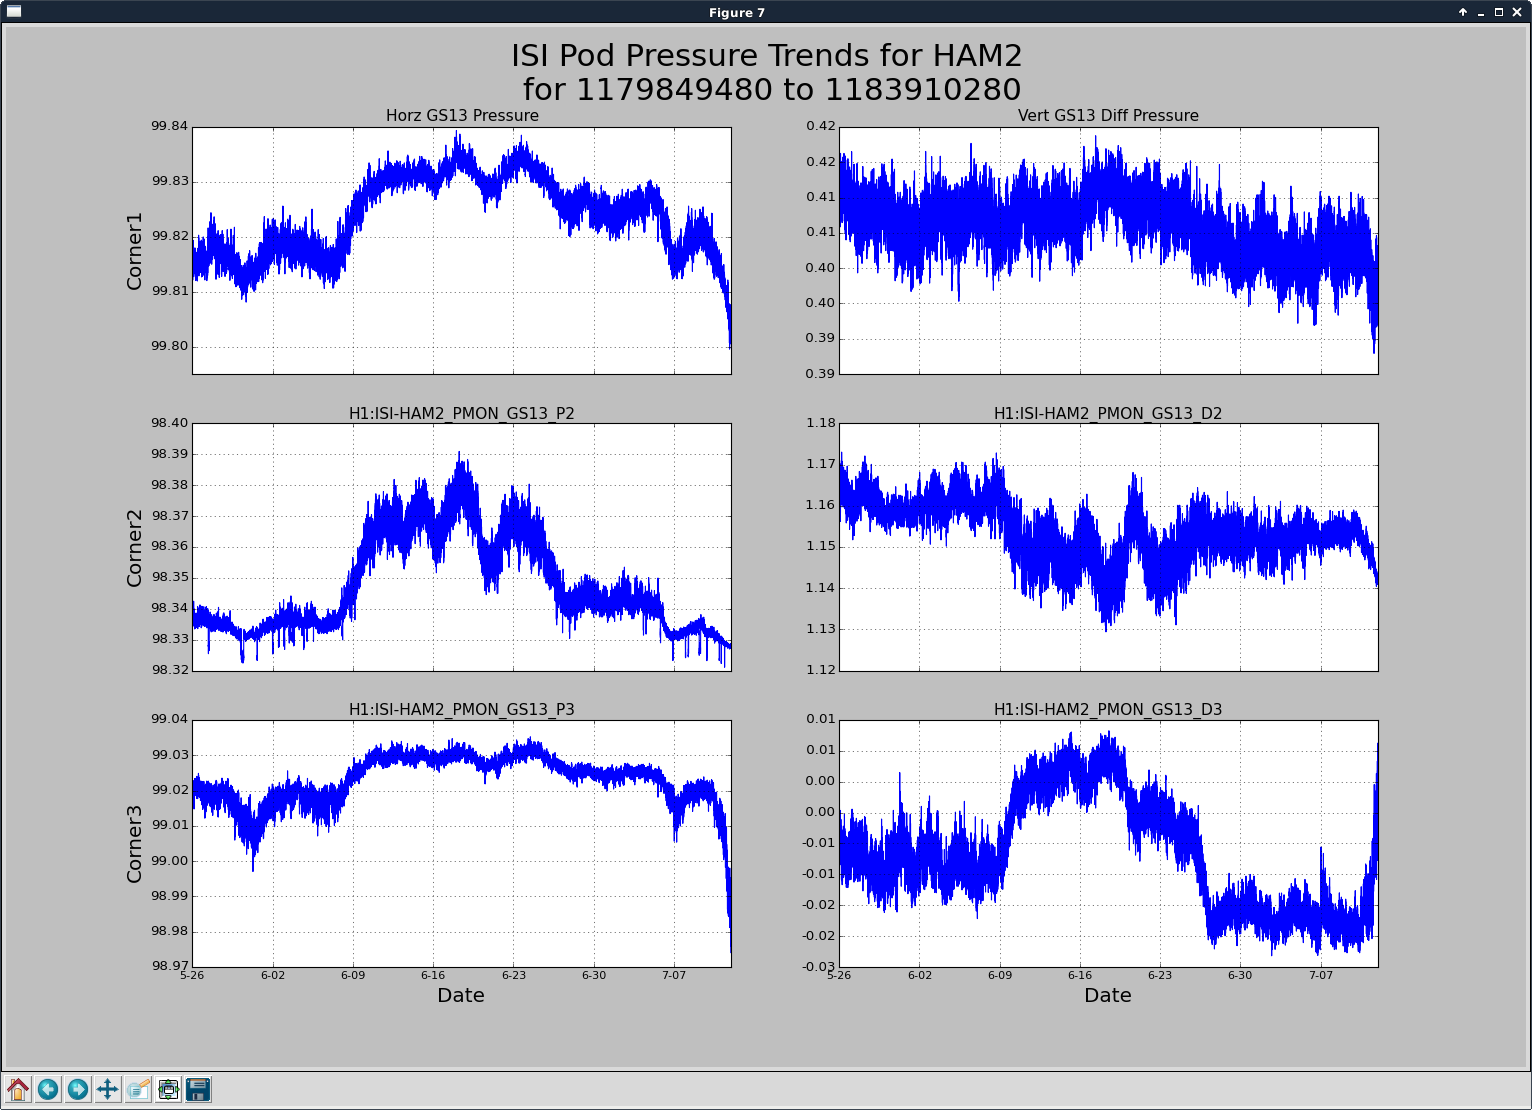
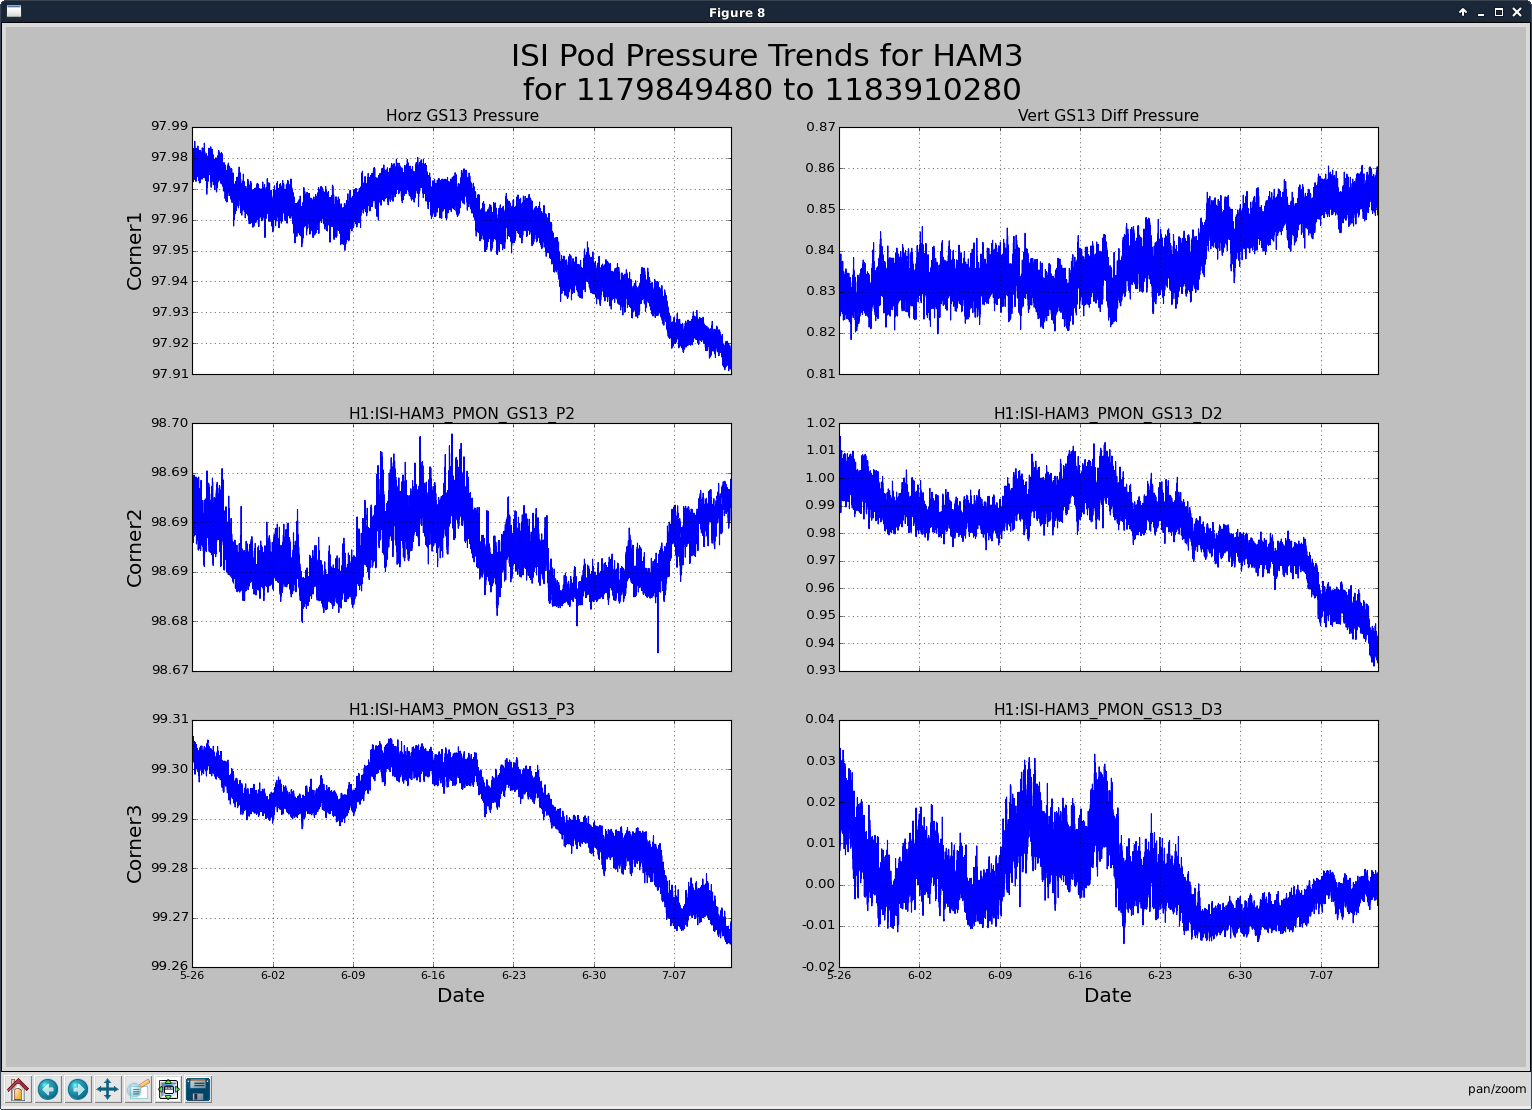
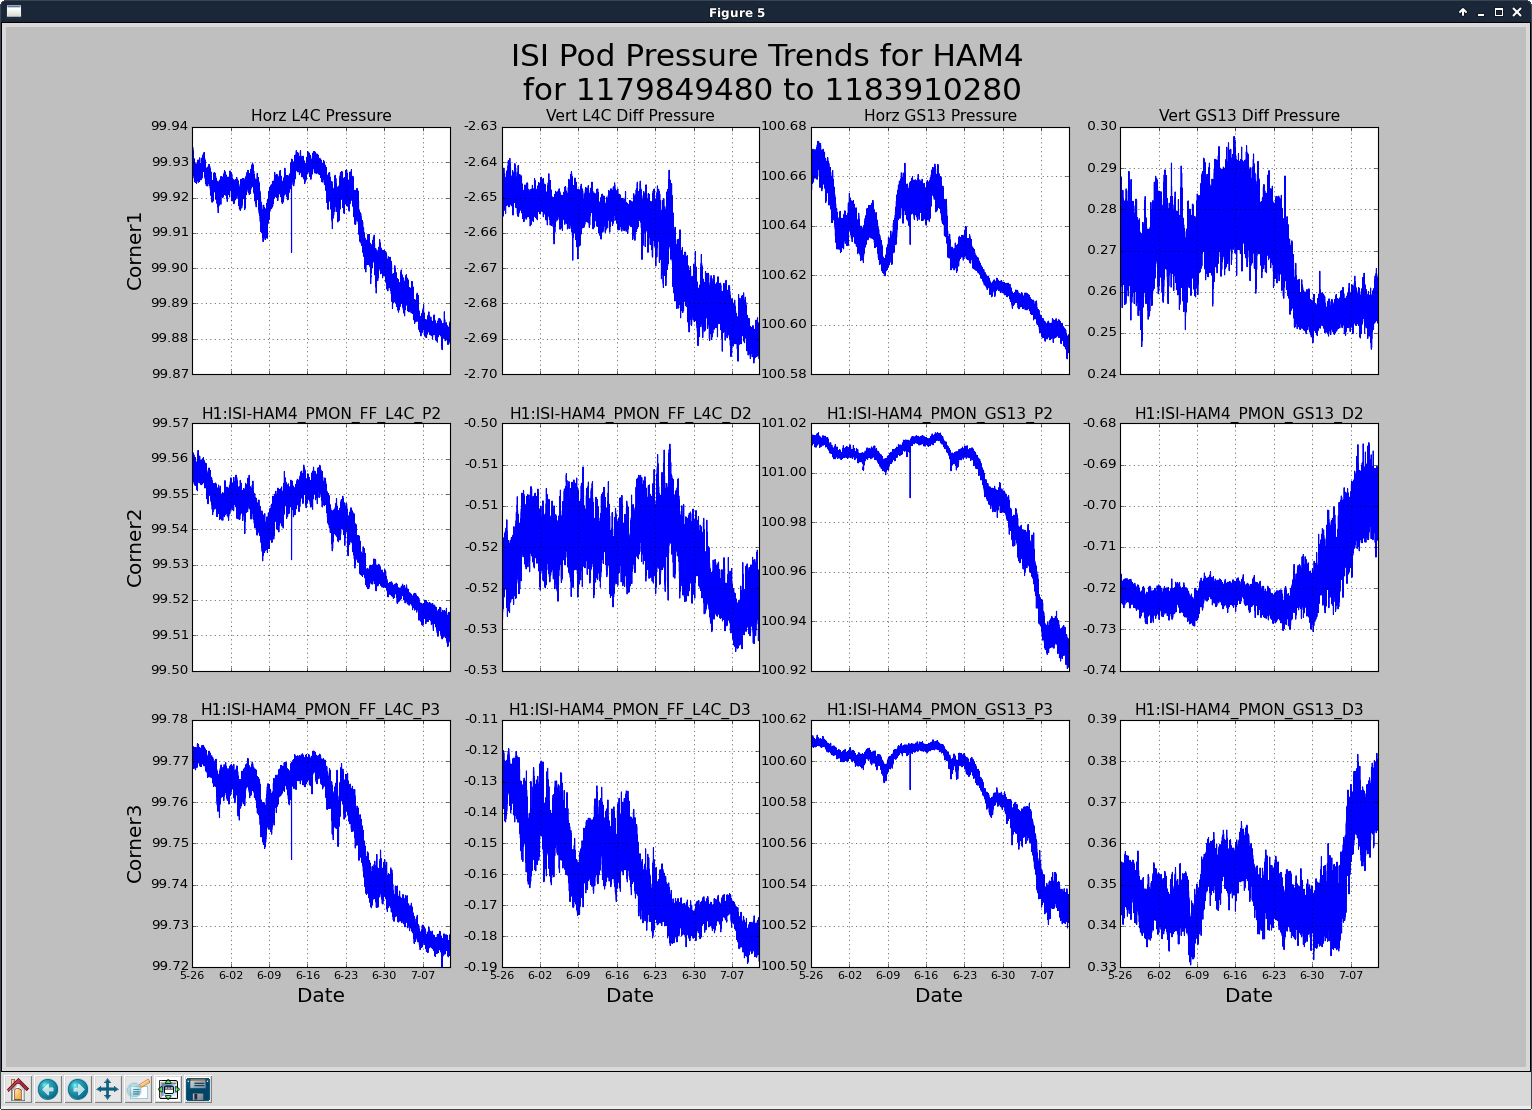
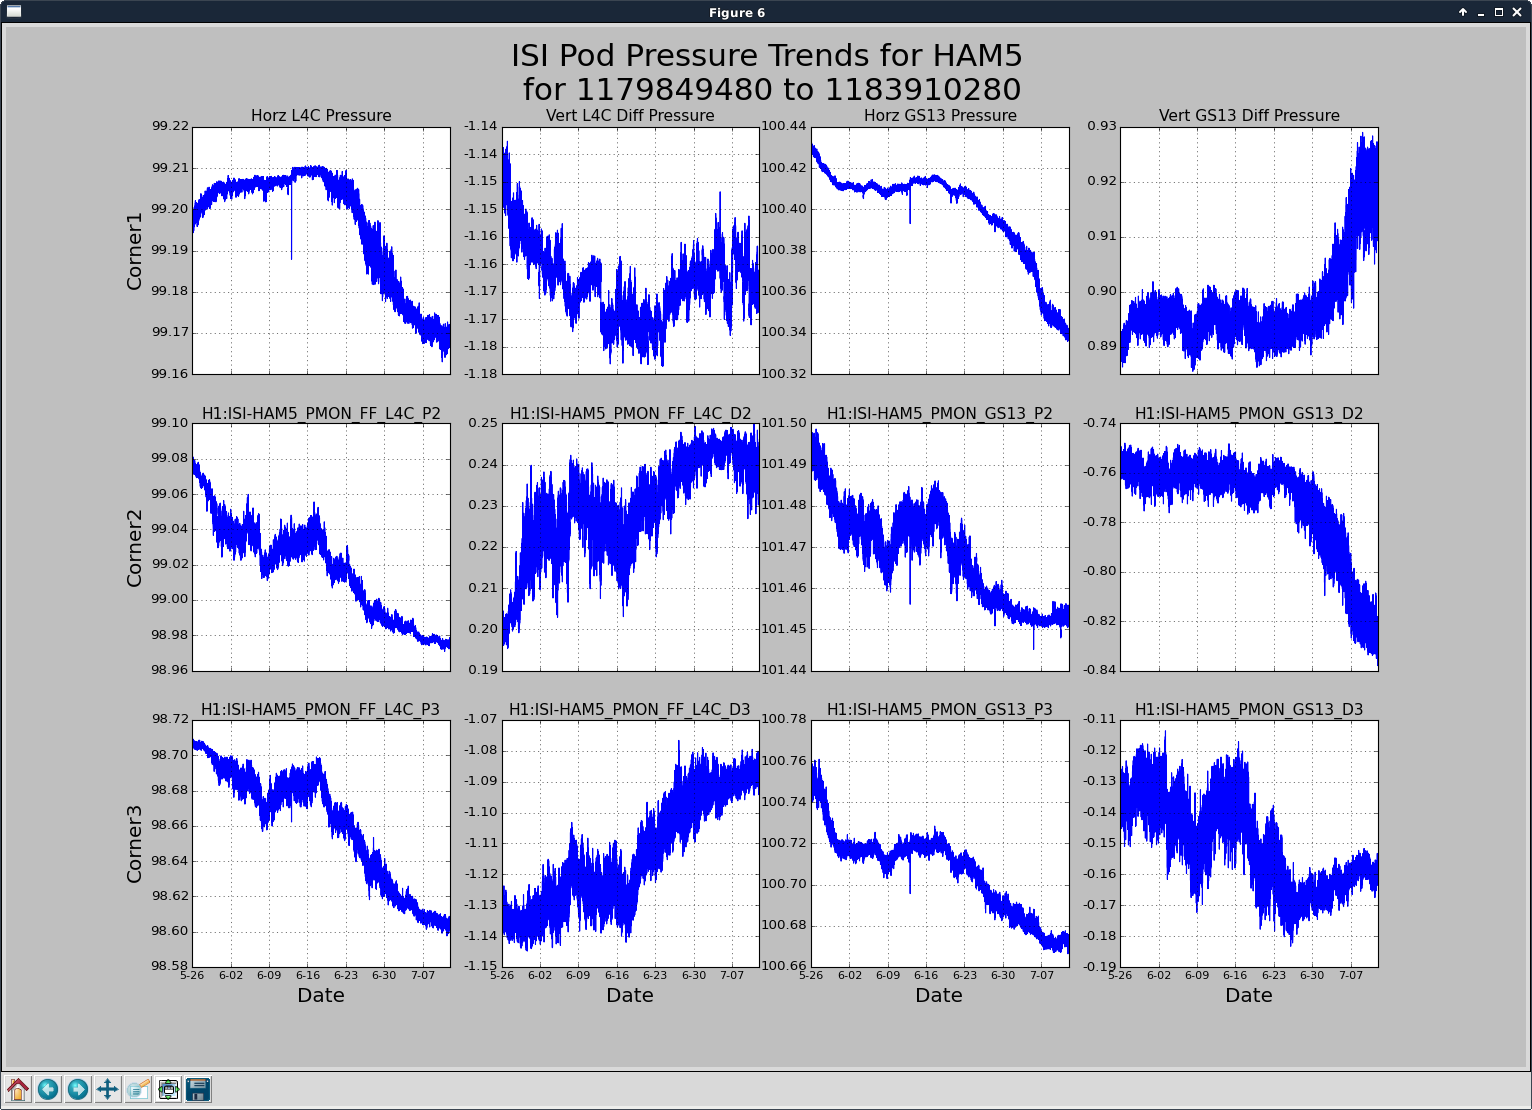
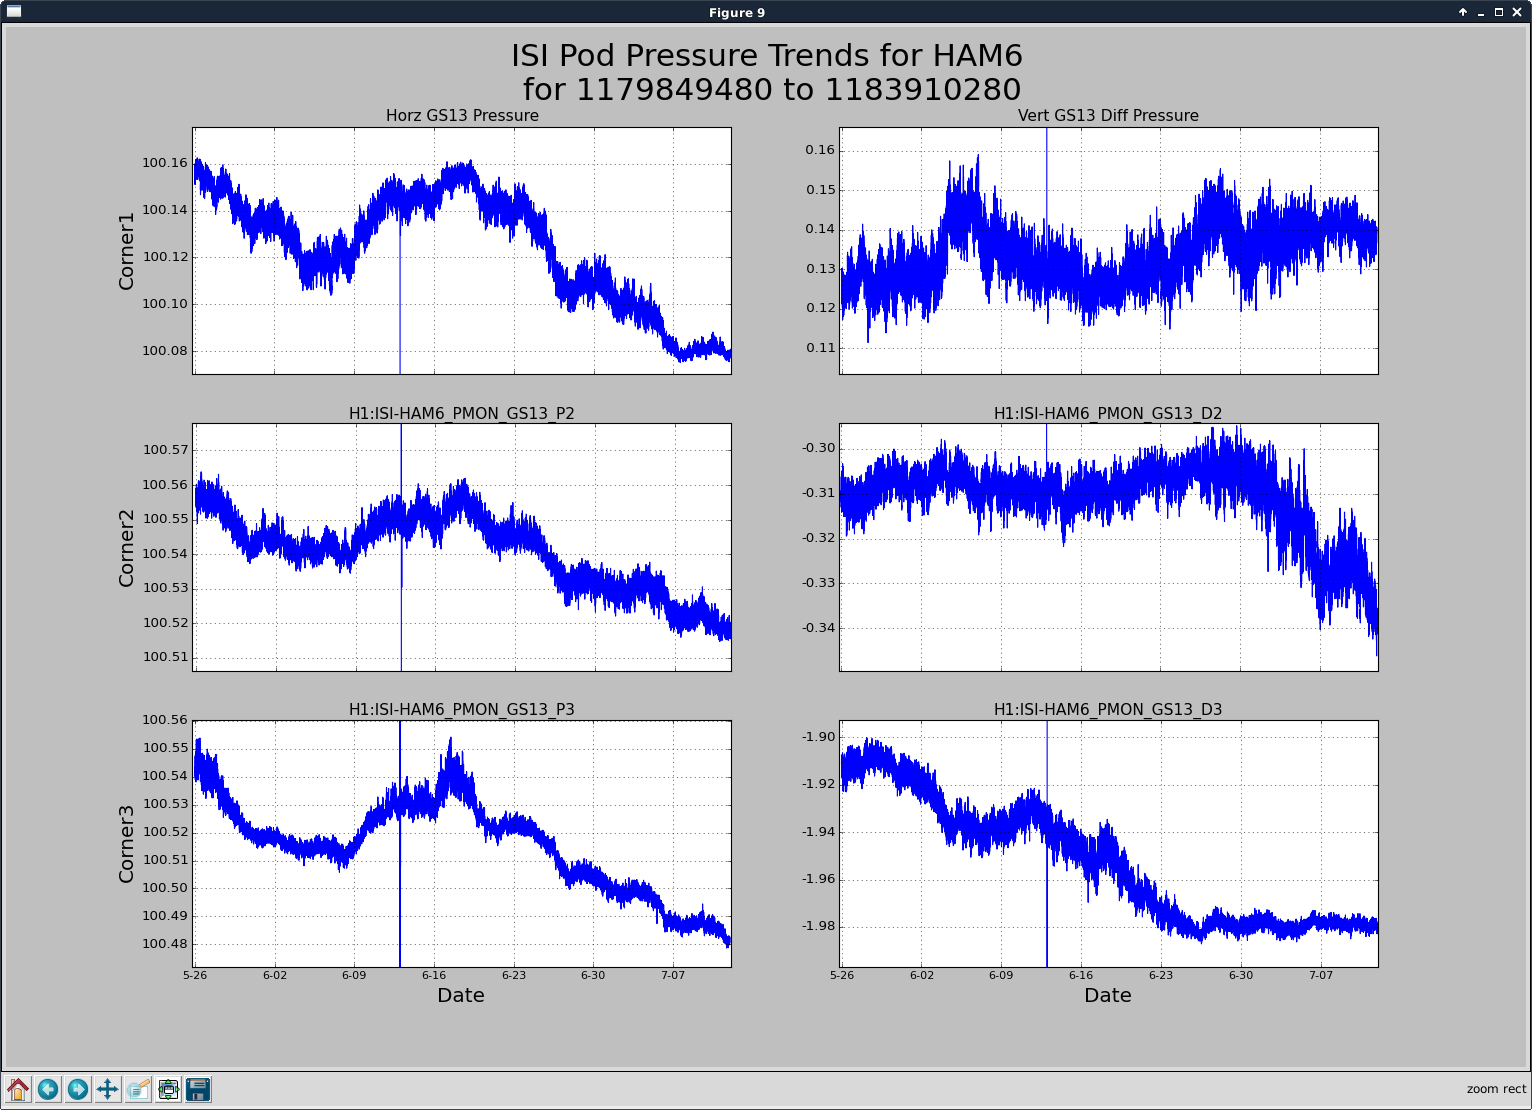
To the end of at least awareness of the Pods, I've modified an existing plotting script of JimWs to do this easily for inclusion in a FAMIS task. Attached are the pod pressures and adjacent differentials for the ten ISI platforms. The 'adjacent' is the vertical of a corner's horizontal/vertical pair. The 'differential' is the vertical pod's analog pressure differenced with the horizontal pod pressure. This scheme reduced the wires needed coming out of the pod.
These plots have just a single trace on each plot's graph. I will look at other ways to present the traces to get problem sensors to stand out; such as, plot all the LVEA pod pressures on a single graph, and plot the ends and differentials on their own separate graphs keeping similar signals in a similar plenum and temperature environment together. For now, just enjoy remembering these forgotten channels.
I have not set up the FAMIS job yet but the automated generating of the ten plots is a one button job: ISI_POD_PRESSURES on the WEEKLIES medm selection of the MAIN/OPS pulldown on the SITEMAP.
Edit:
pwd: /opt/rtcds/userapps/release/sys/h1/scripts/ISI_PodPressure_trends.py
hugh.radkins@opsws1:scripts 0$ svn add ISI_PodPressure_trends.py
A ISI_PodPressure_trends.py
hugh.radkins@opsws1:scripts 0$ svn commit -m "adding easy plotting of ISI Pod Pressures" ISI_PodPressure_trends.py
Adding ISI_PodPressure_trends.py
Transmitting file data .
Committed revision 15824.