jeffrey.kissel@LIGO.ORG - posted 15:28, Wednesday 19 July 2017 (37628)
Charge Measurement Update; Some H1SUSETMY Quadrants Now Have ~50-100 [V] Effective Bias Voltage
J. Kissel
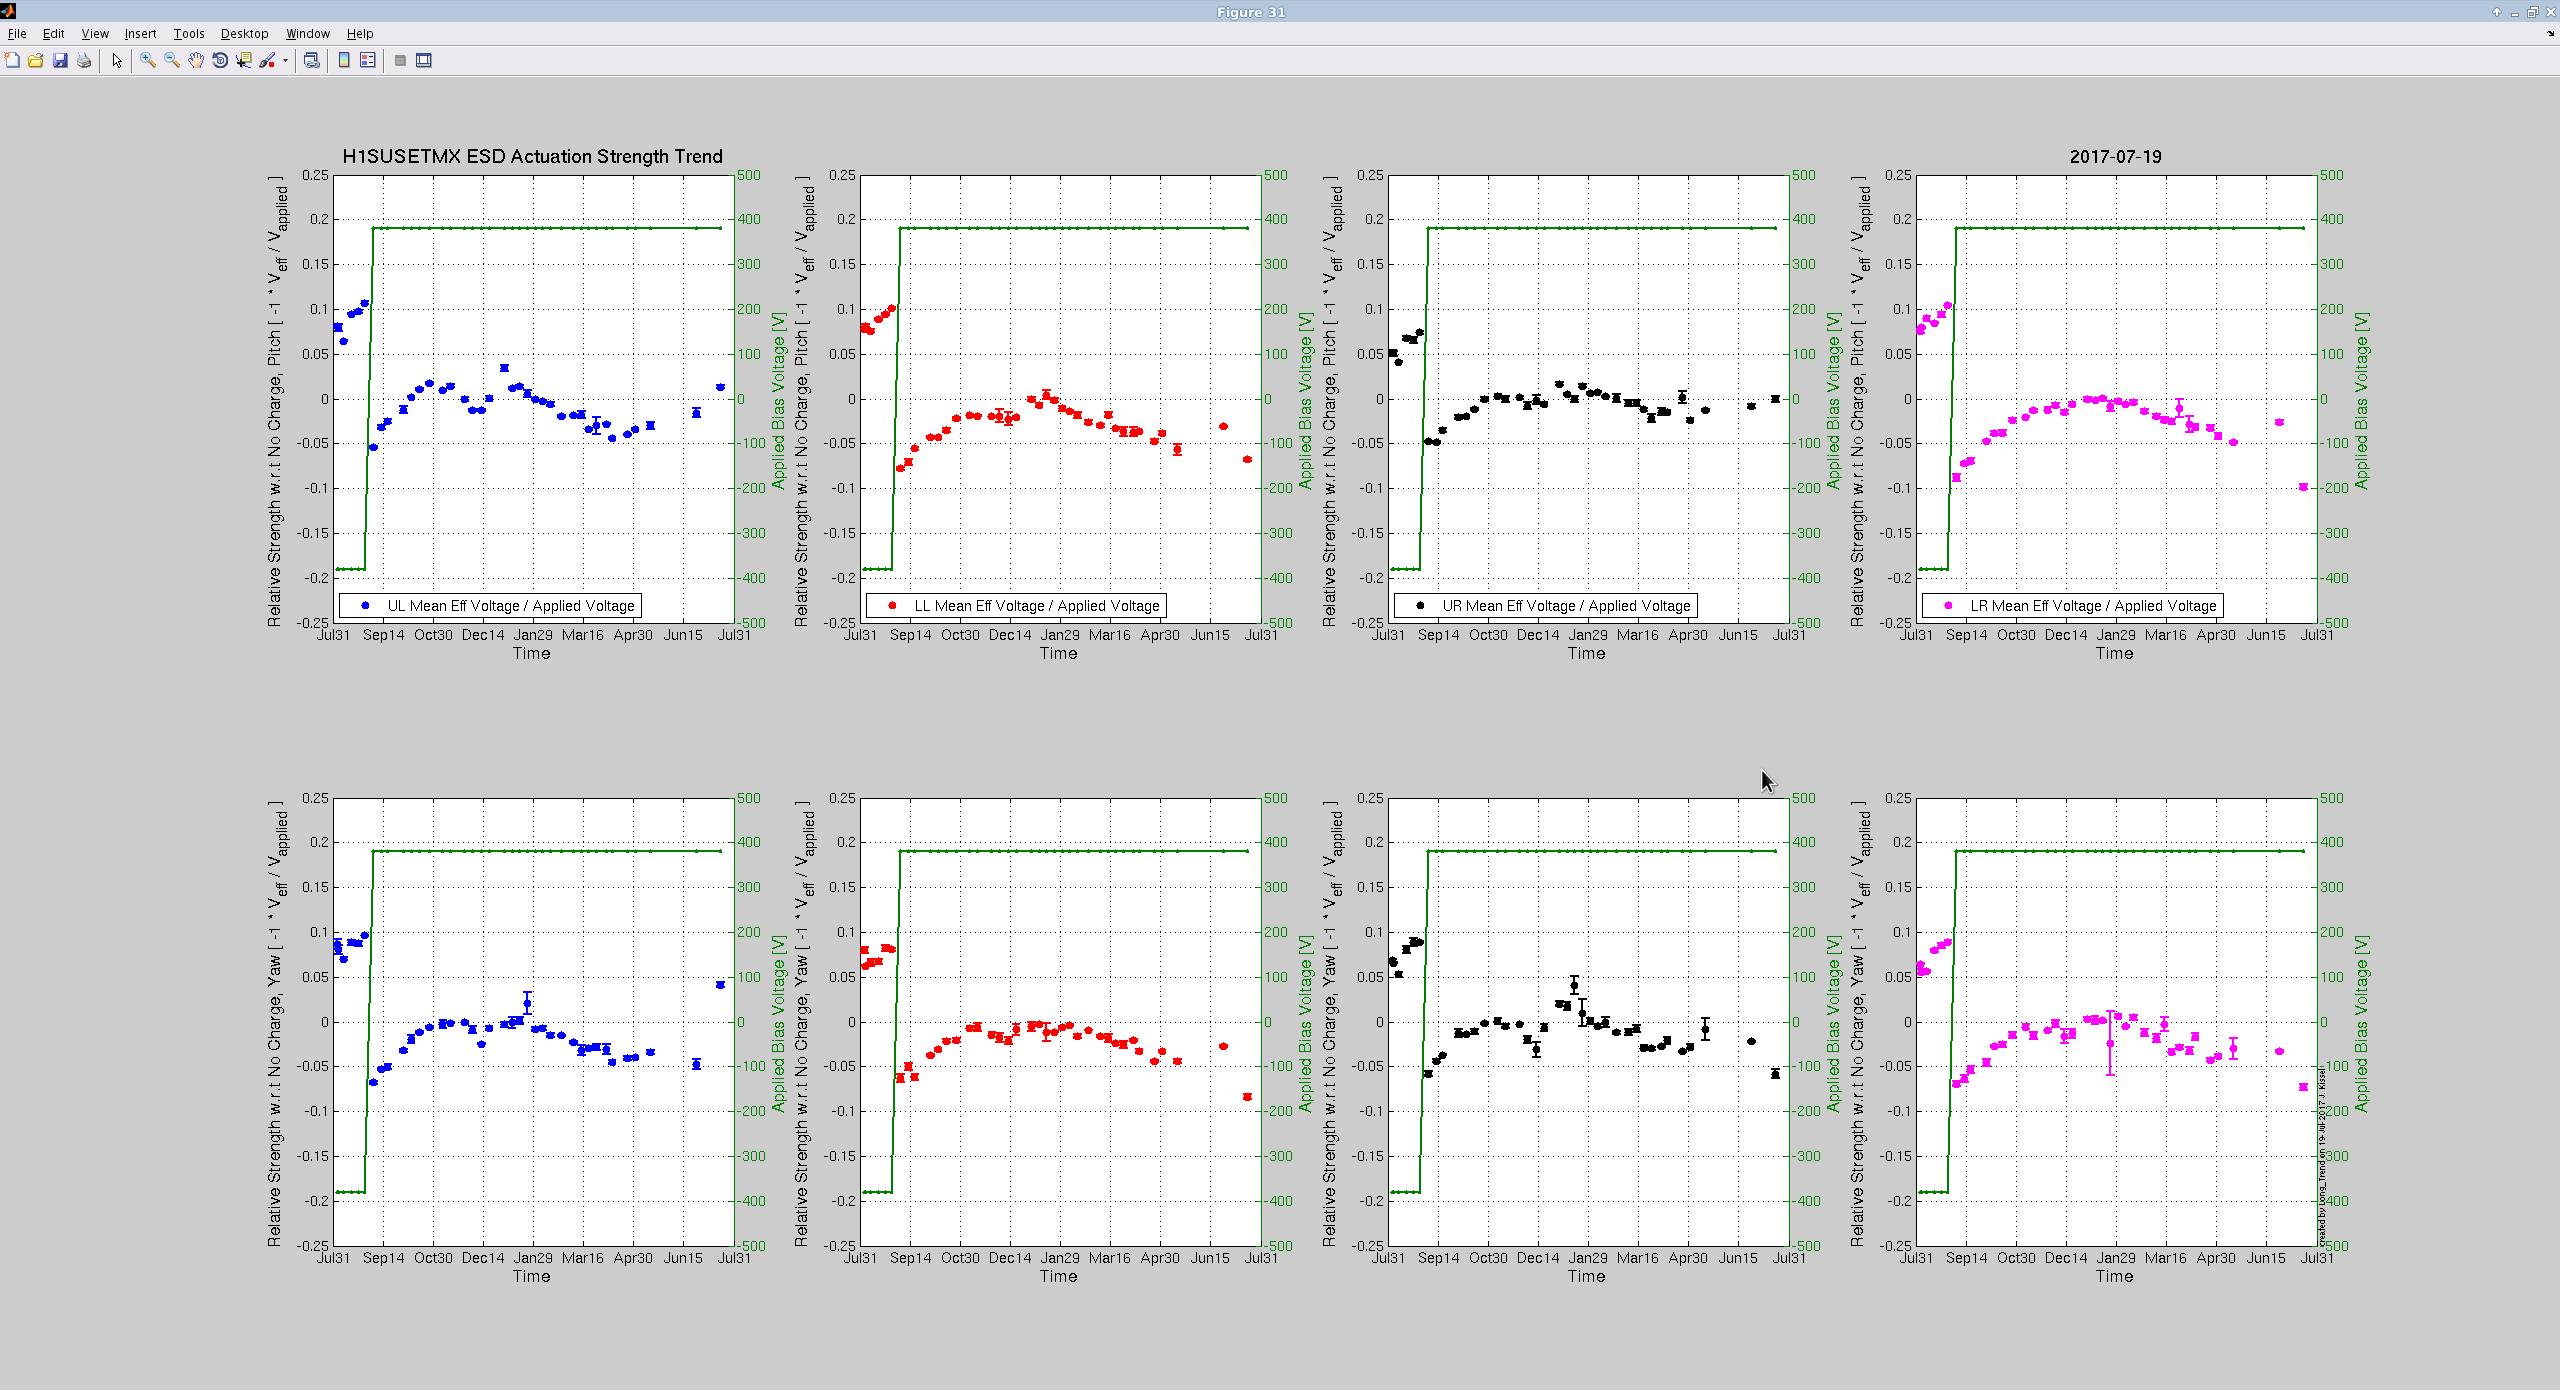
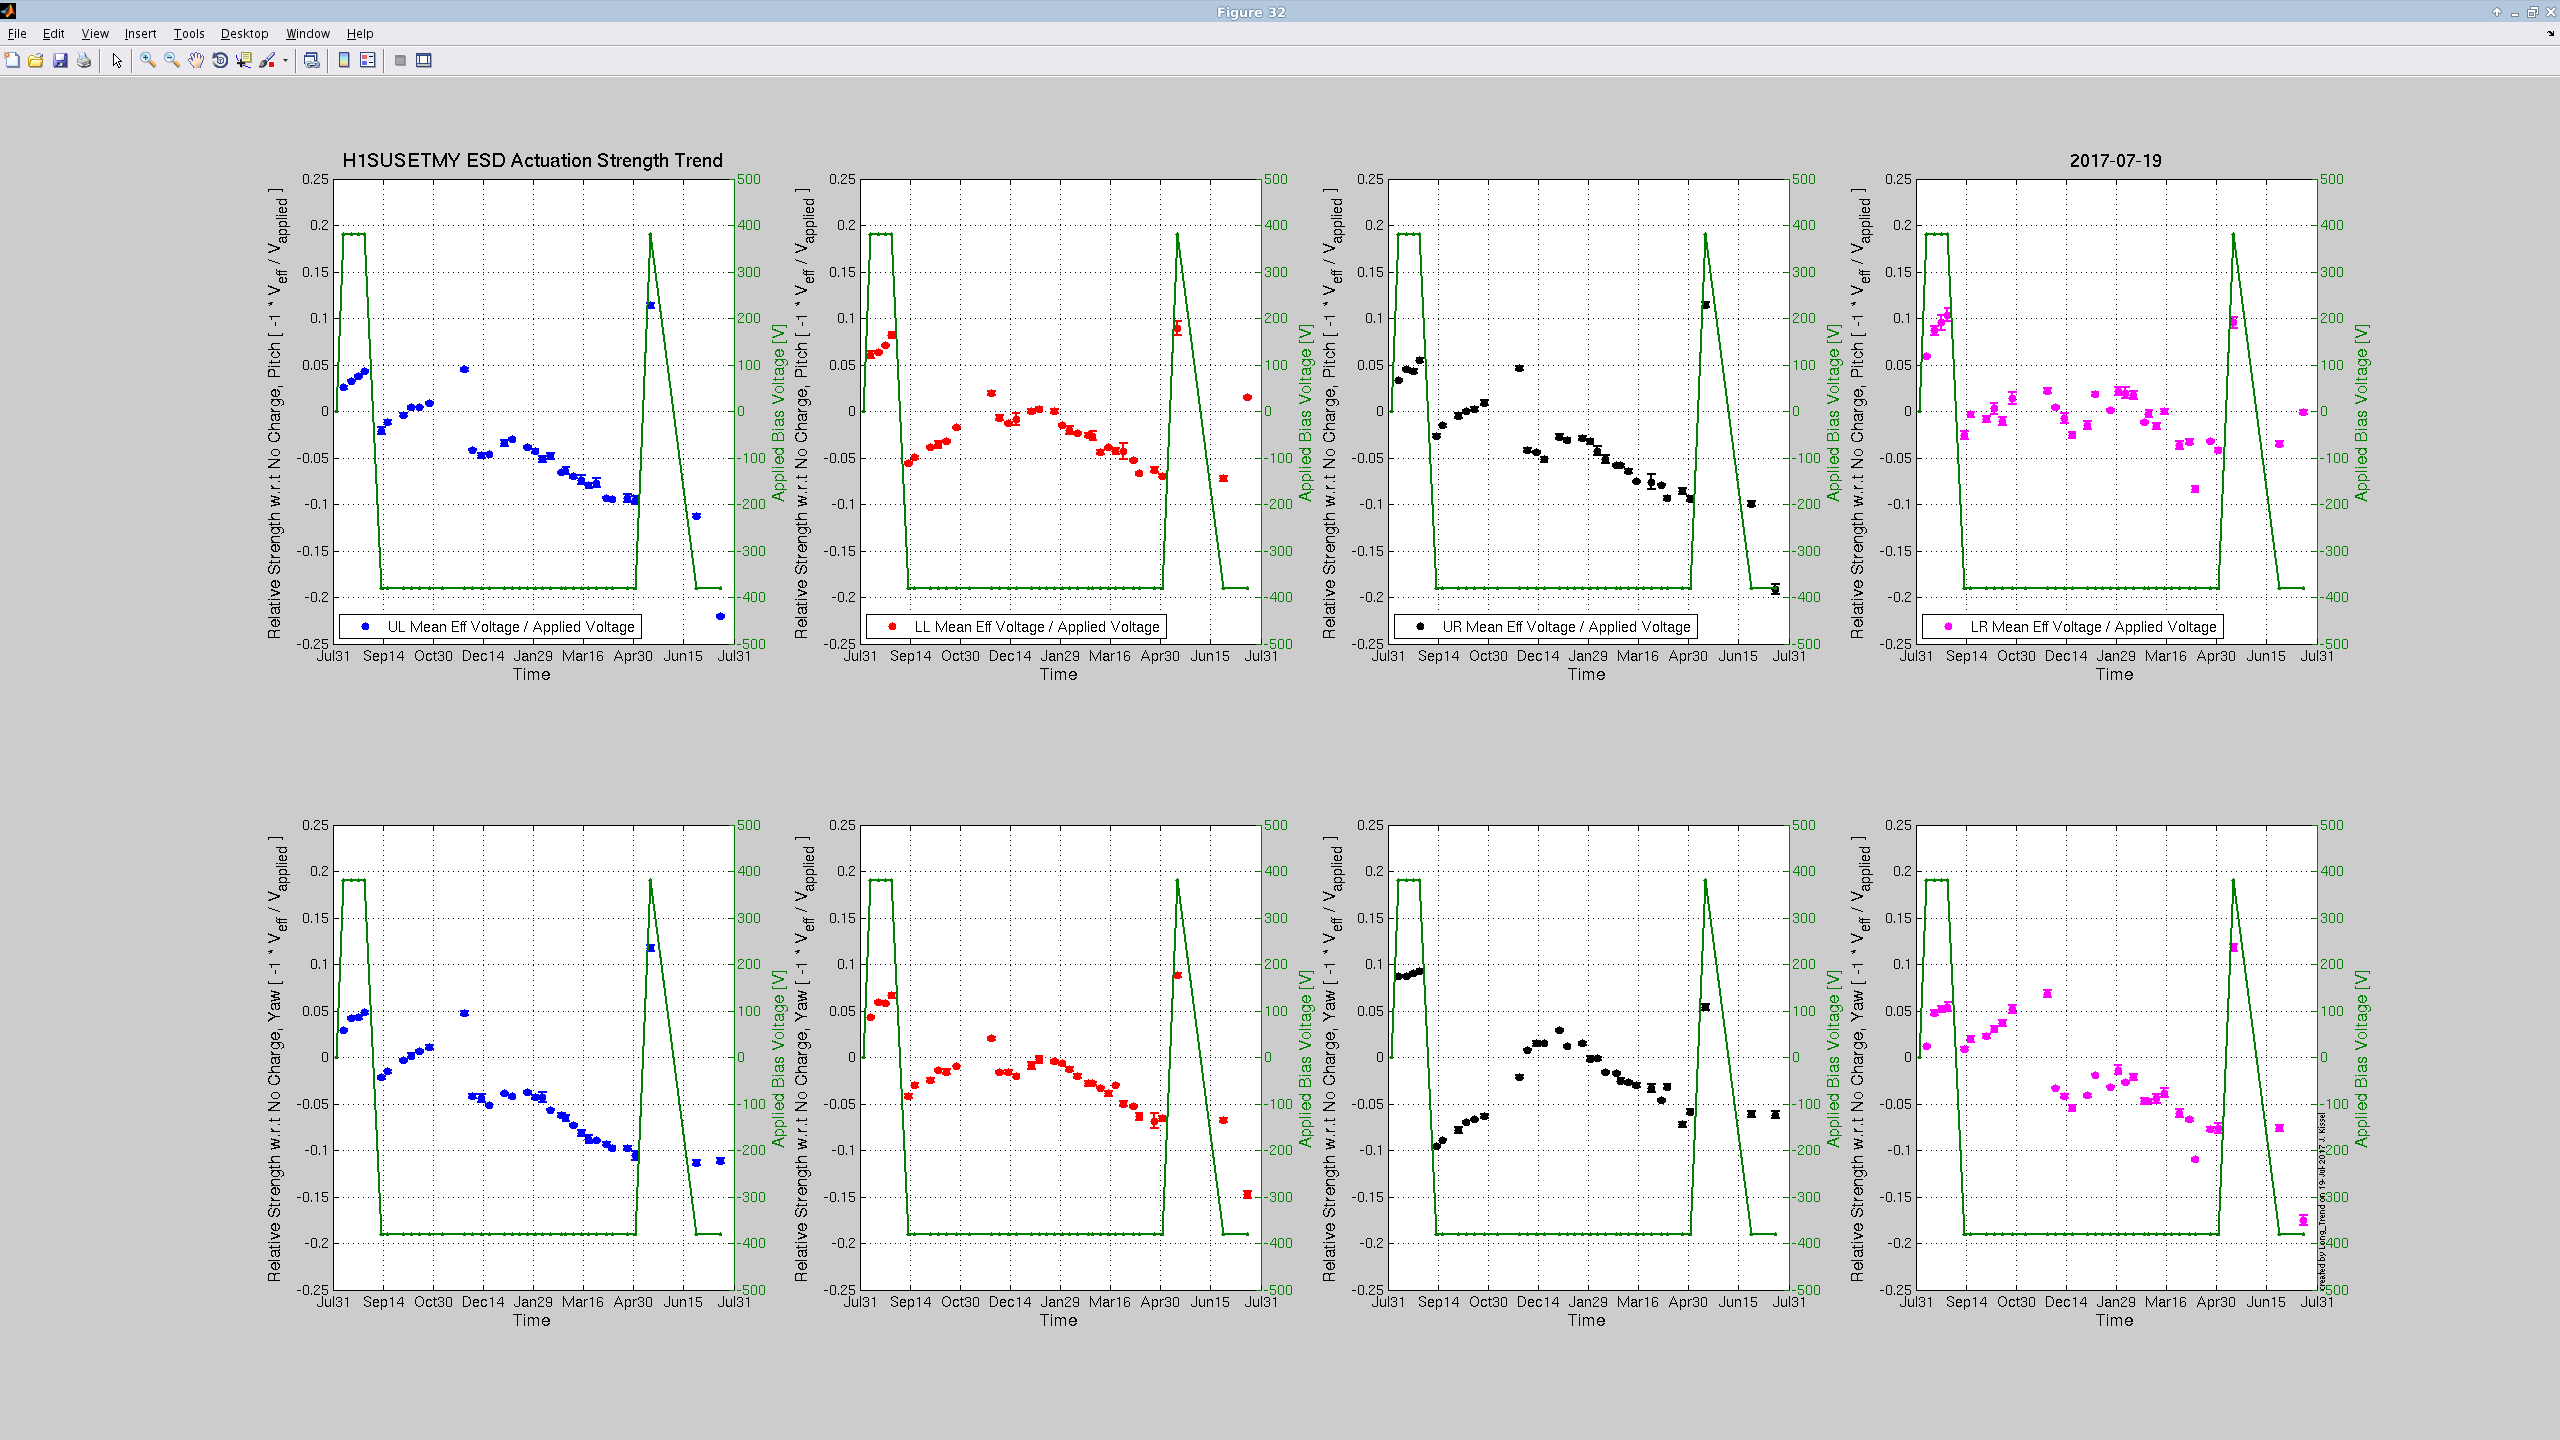
I've measured the effective bias voltages for each quadrant of the ETM ESD systems, as per the usual optical lever angular response method.
Unfortunately, it looks like several of the quadrants of the ETMY ESD have accumulated an effective bias voltage of (negative) ~50-100 [V] -- a change of about 30-40 [V] since the last measurement on Jun 27 2017 -- namely UL in Pitch, LL in yaw, UR in pitch, and LR in yaw. This corresponds to a 15-20% decrease in angular actuation strength (relative to no effective bias voltage; a 10% change since last measured on Jun 27th).
See attached 1-year trends of the effective bias voltage and angular actuation strength.
This seems to have not drastically affected the longitudinal actuation strength, as measured by the calibration lines in DARM, which reports only a ~5% increase in actuation strength with respect to when we last updated the actuation strength in the calibration model in January.
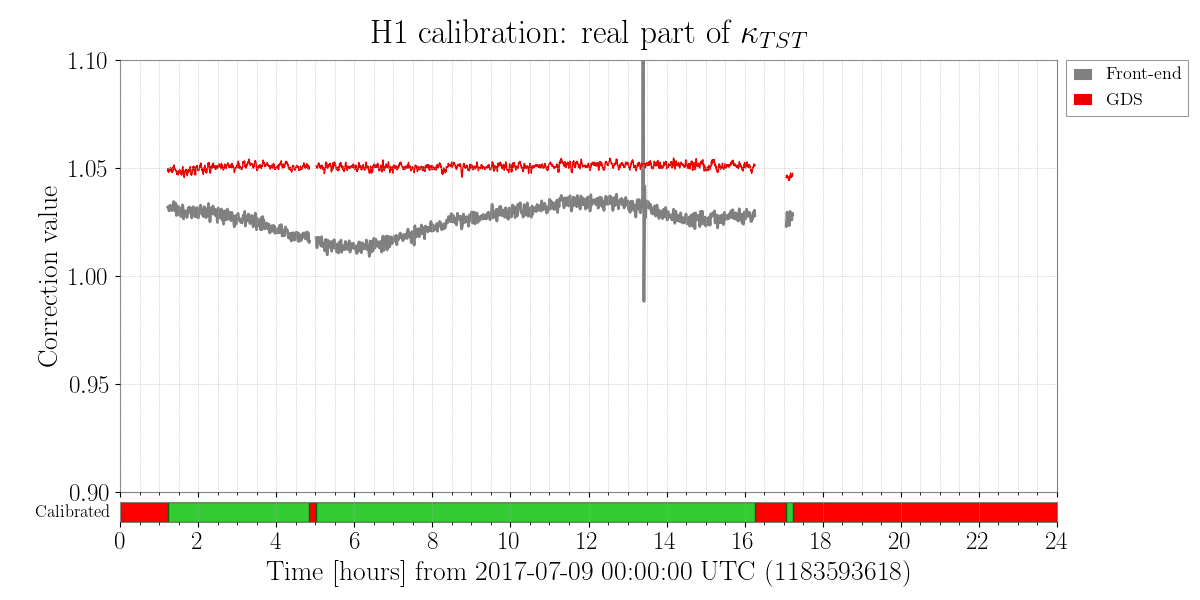
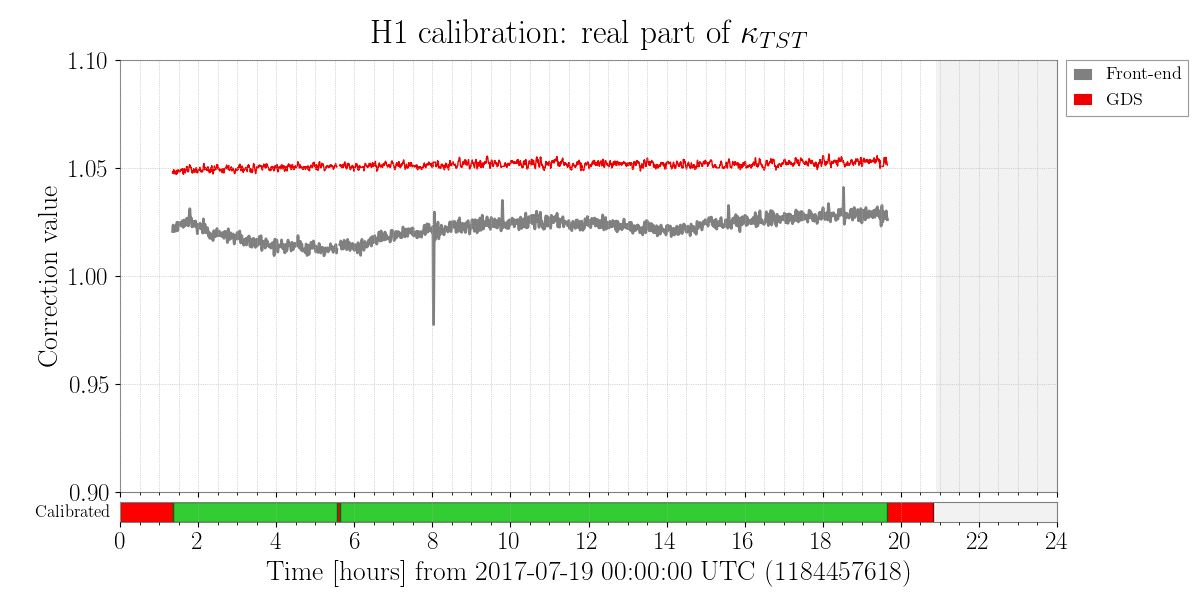
Looking back through the summary pages, one can see a ~1-2% decrease in actuation strength (which corresponds to an increase of the necessary correction factor, kappa_{tst}) between July 6th (when we were hit by the 5.8 Mag Montana Earthquake) and July 9th once we were able to recover the IFO enough to measure with calibration lines. It usually takes a month or two for charge to accumulate a ~1-2% change "naturally."
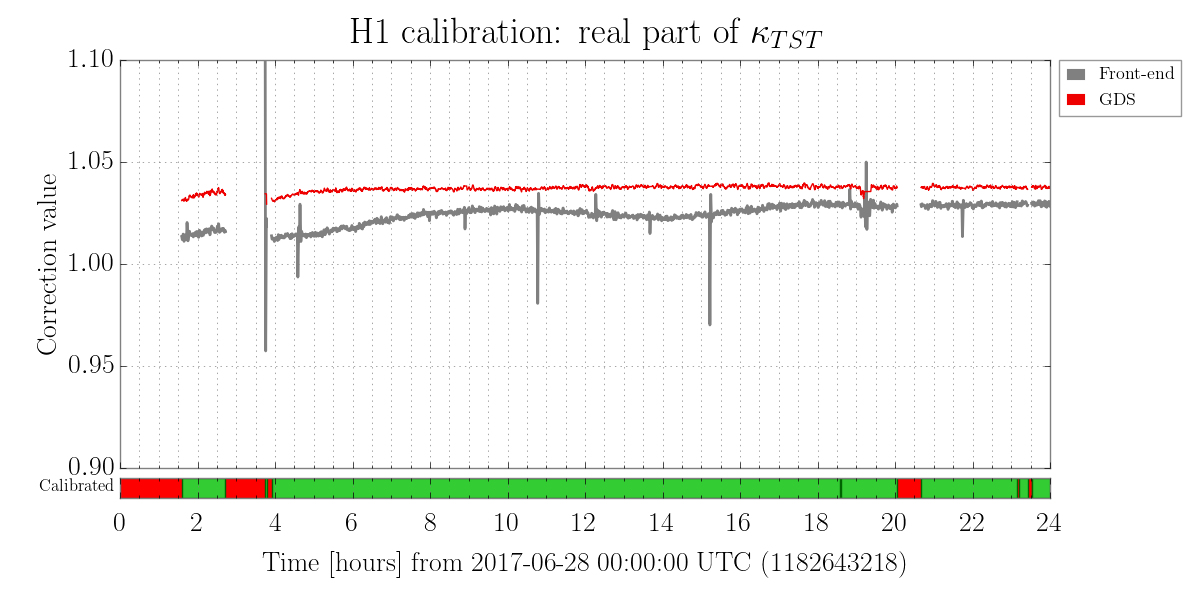
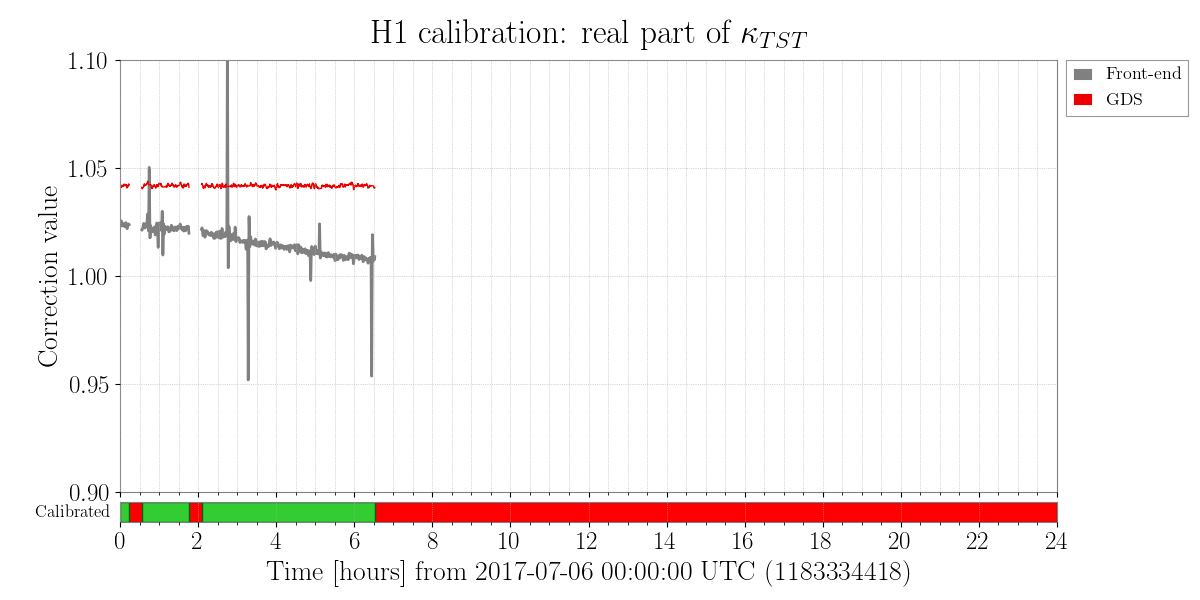
I attach four reports from the summary pages,
2017-06-28 -- Just after the last charge measurement
2017-07-06 -- Just before the 5.8 Mag Montana earthquake
2017-07-09 -- just after the 5.8 Mag Montana earthquake
2017-07-19 -- today.
The overall h(t) calibration is OK, since we correct for this changing actuation strength.
Note that on Jun 27th, the calibration team switched the GDS pipeline's actuation strength reference from H1 PCALY's RX PD to its TX PD, due to known problems with the RX PD clipping. This was *not* done in the front-end calculation. So the red trace should be trusted, and the gray should be ignored.
So, if you asked me "do you think this drastic effective bias voltage change is from the Montana Earthquake?"
I would say "The data isn't as dense as we'd like for a definitive statement, but signs point to yes."
This leaves a few questions open:
(1) Can we ascertain the geometric location of a charge source that would impact the actuation strengths as above?
- Yes, but it'll need a little thinking, and I want to get this data up. Stay tuned.
(2) Is it plausible that that geometric arrangement would cause so little change in longitudinal actuation strength?
- Yes, but contingent upon answer to (1).
(3) Even with glass tips on all EQ stops, is it still possible that charge can accumulate from a violent earthquake?
- I don't know enough about the mechanism to say...
(4) Is there a potential for this effective bias voltage configuration / amount to cause the recent mystery noise (see LHO aLOGs 37616, 37599 and 37590)?
- Plausible; one might imagine if there's enough effective bias voltage, that coupling to ambient electric fields is larger...
Remember there are three potential ways that the ESD system is vulnerable to stray charge changing its canonical actuation strength (alpha),
(a) Charge accumulated in between the test mass and reaction mass, (beta)
(b) Charge accumulated on areas outside of the gap, on the test mass (beta_2)
(c) Charge on the surrounding cage (gamma)
and these angular actuation measurements cannot distinguish between these, as
V_eff = (beta - beta_2) / [2 (alpha - gamma)]
See discussion in T1500467.
(5) Is it worth spinning up the TMDS band-wagon?
- My vote is no, but this decision should be made with a much more broad audience of input.
For the record, ETMX looks OK (all quadrants' effective bias voltage is below +/-40 [V]), but the data is to sparse to make conclusive statements about whether there was (a) a similar ~30-40 [V] jump, or (b) it was suddenly relative to the Montana quake. The majority of quadrants look to be continuing on the same trend as before; only UL in yaw and LR in pitch are suspicious.
Images attached to this report