I have slowly been looking at suspension pitch sensors around the times of the EQ, here are a few more plots.
Quads during comparable EQs
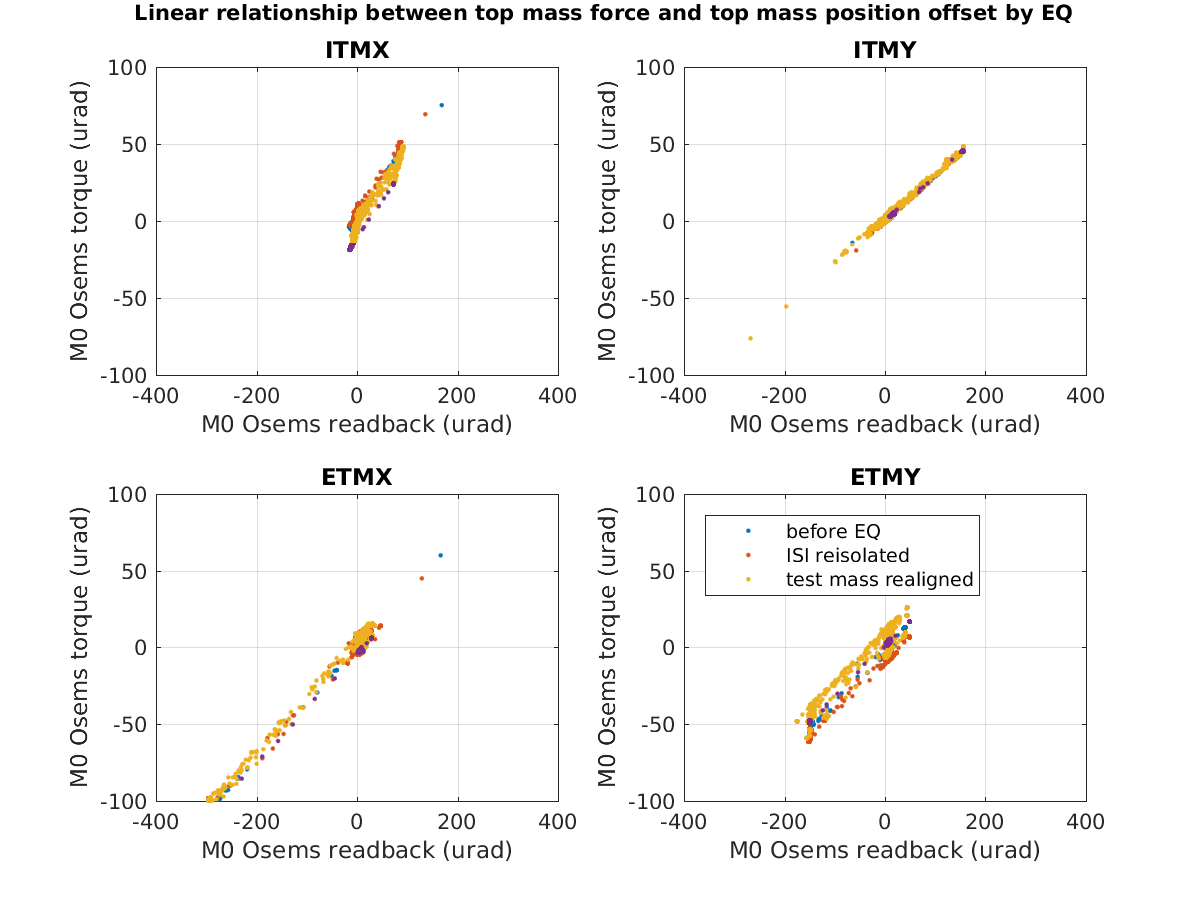
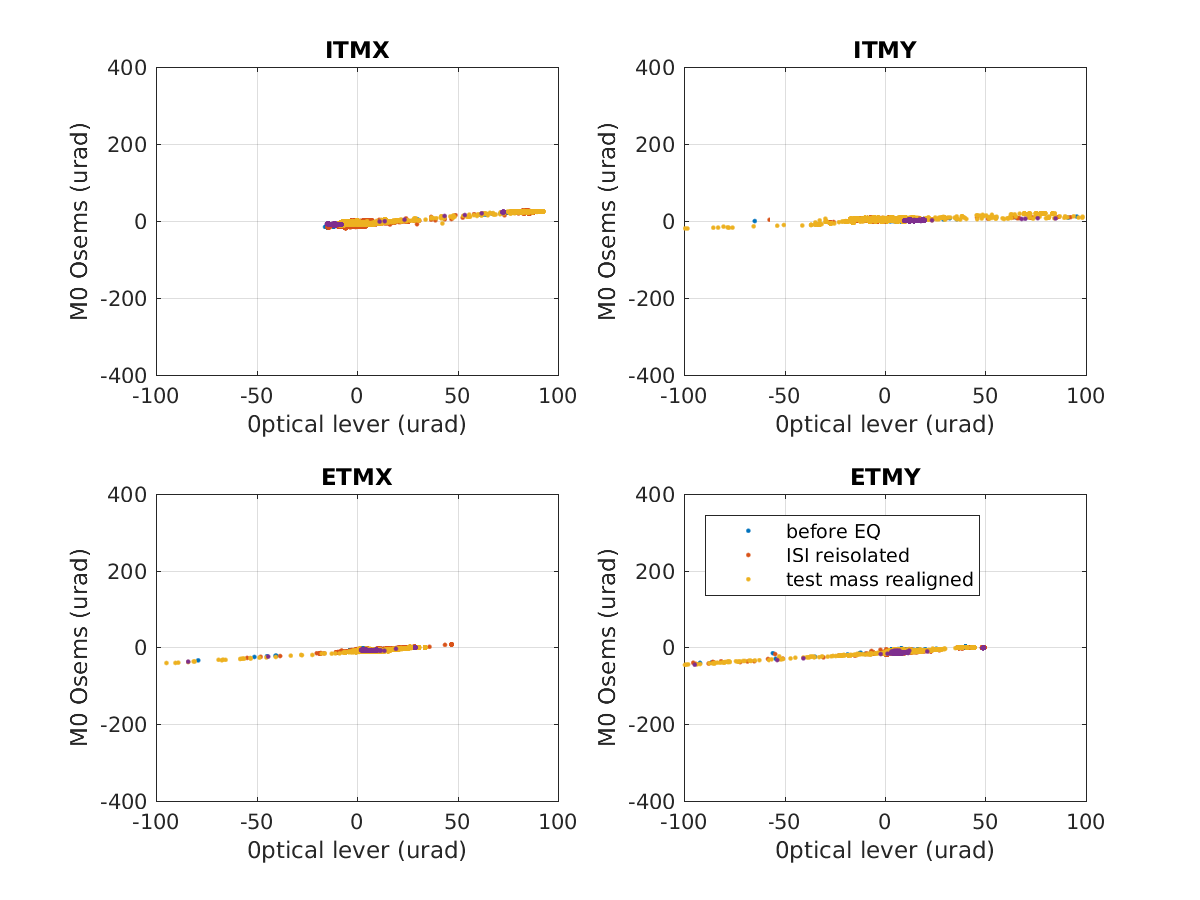
From December 10th to January 25th, we had three EQs which were larger (in 30-100mHz BLRMS of vertical ground velocity) than the July 6th Montana EQ. (One of these EQs was also larger in the 100mHz-300mHz band) The attached plots are directly comparable to the plots in 37799 except that each color is the time period between a different EQ. While there are some shifts in the top mass (smaller than what we had in the Montana EQ), there are not comparable shifts in the relationship between the top mass pitch and the oplev pitch.
Triples
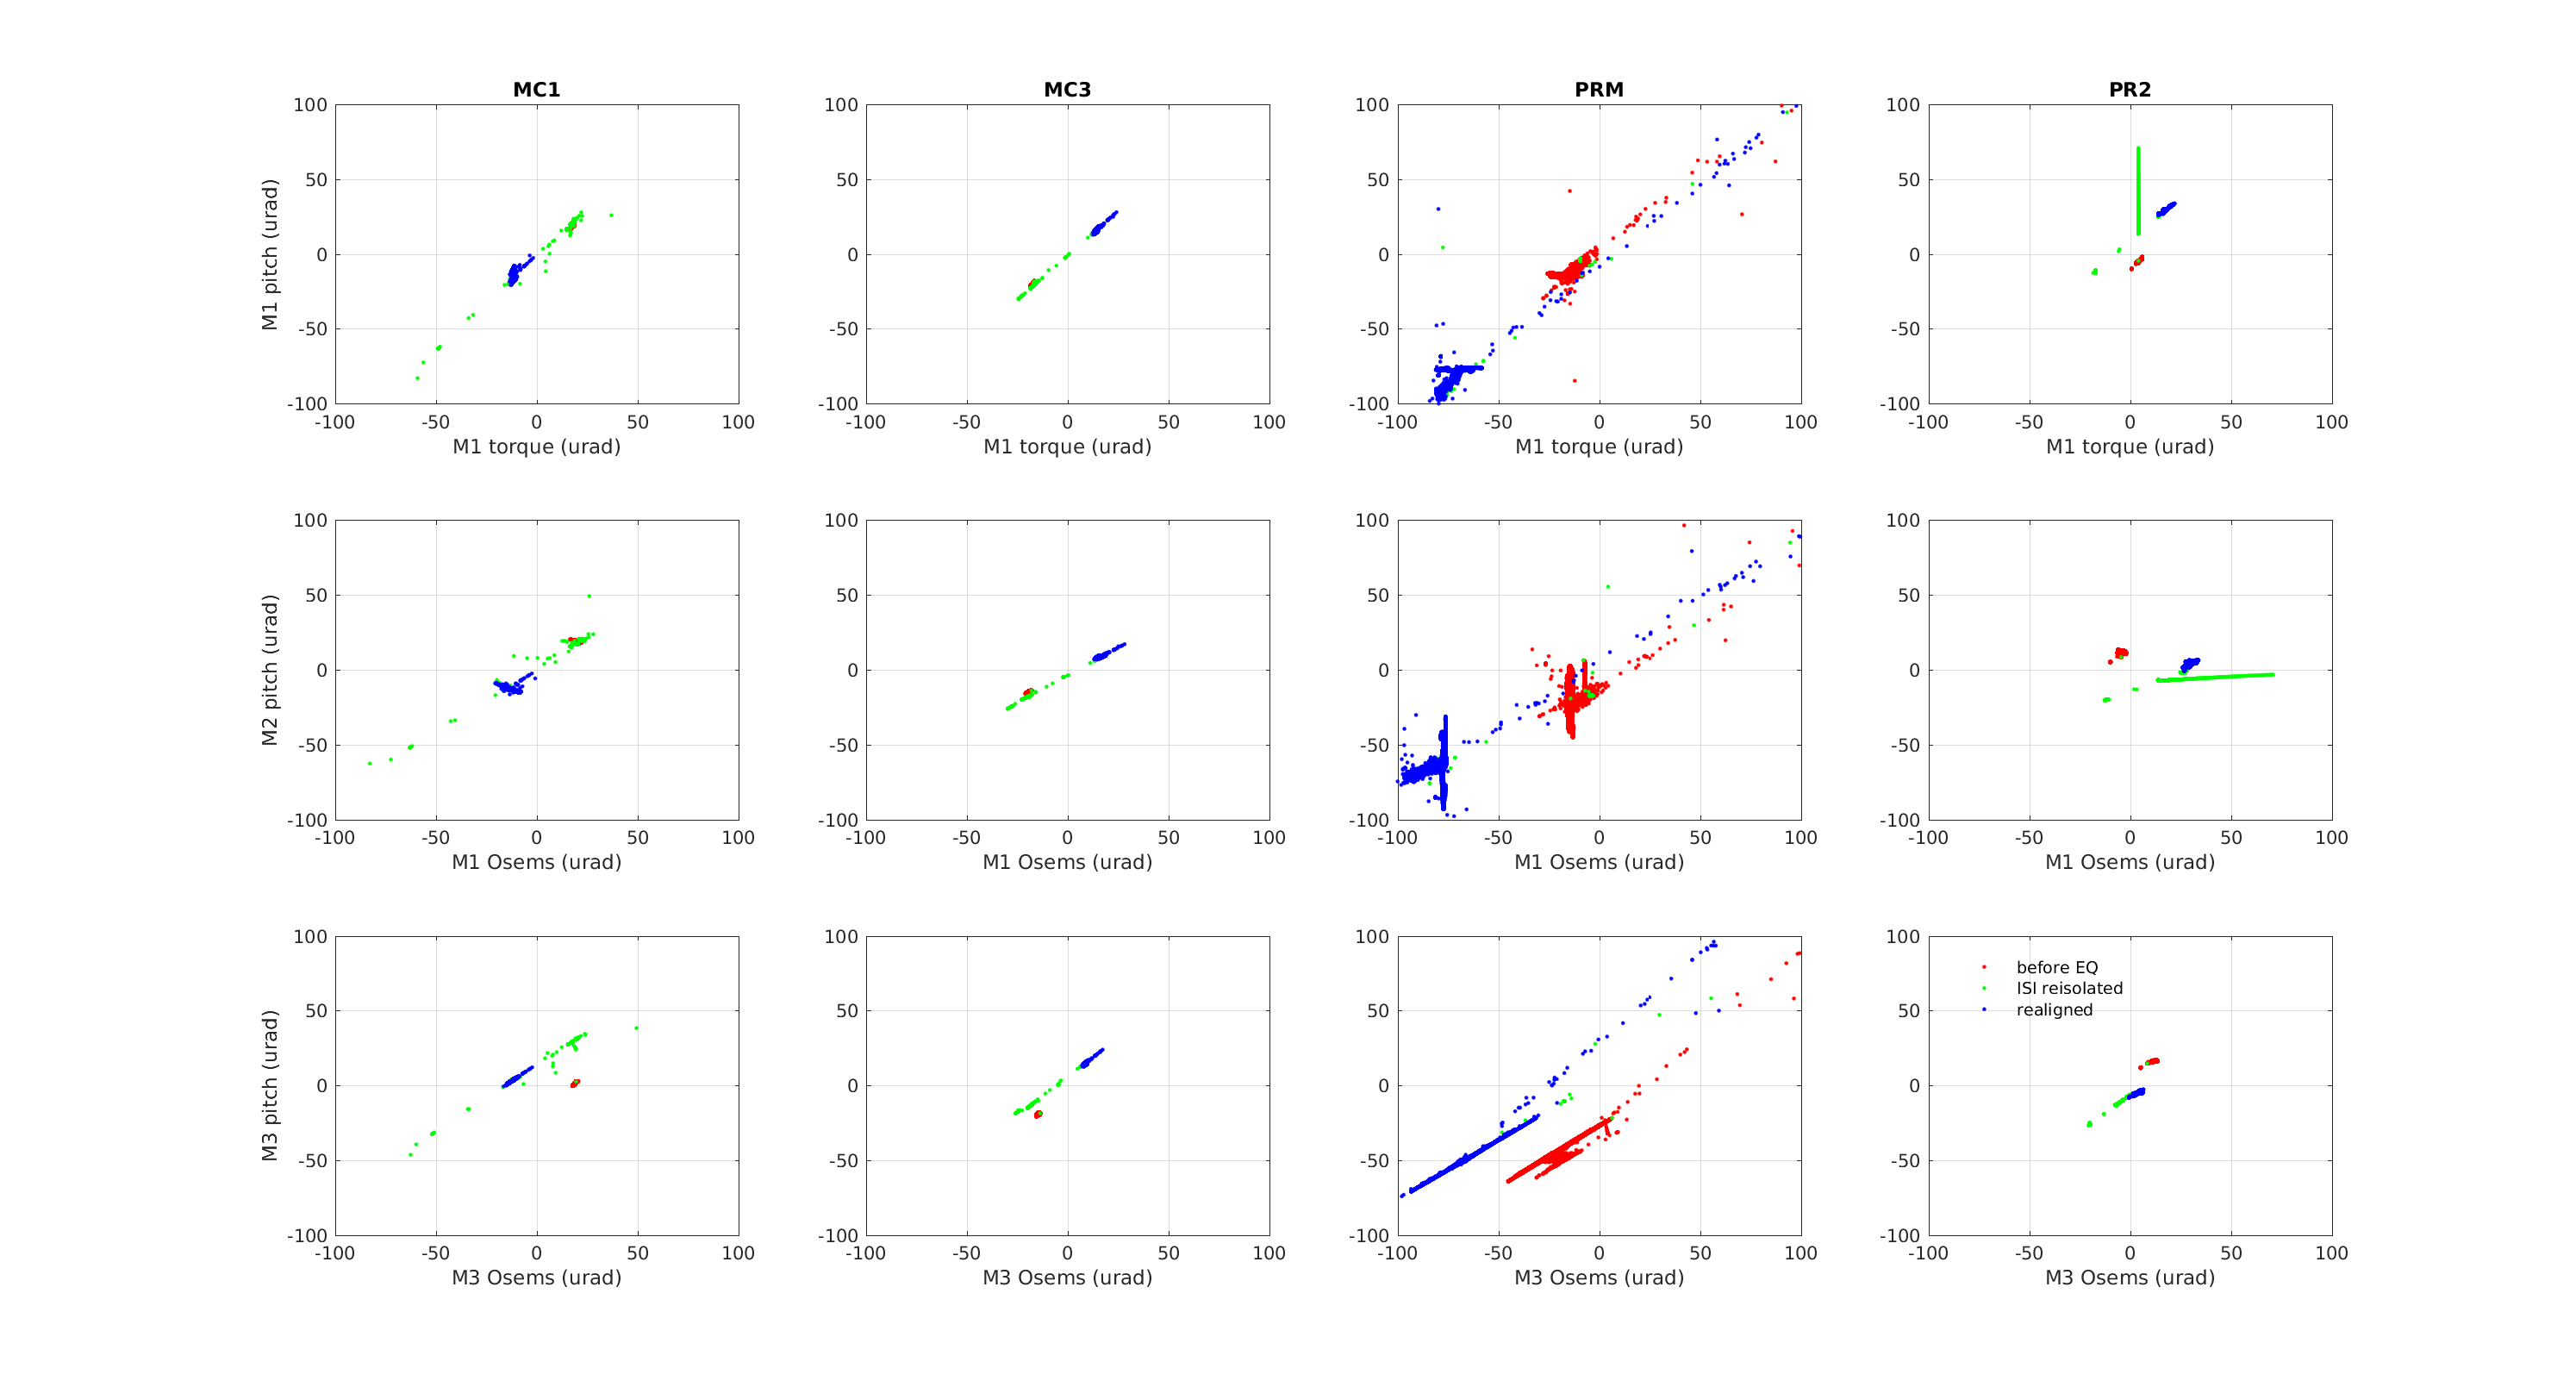
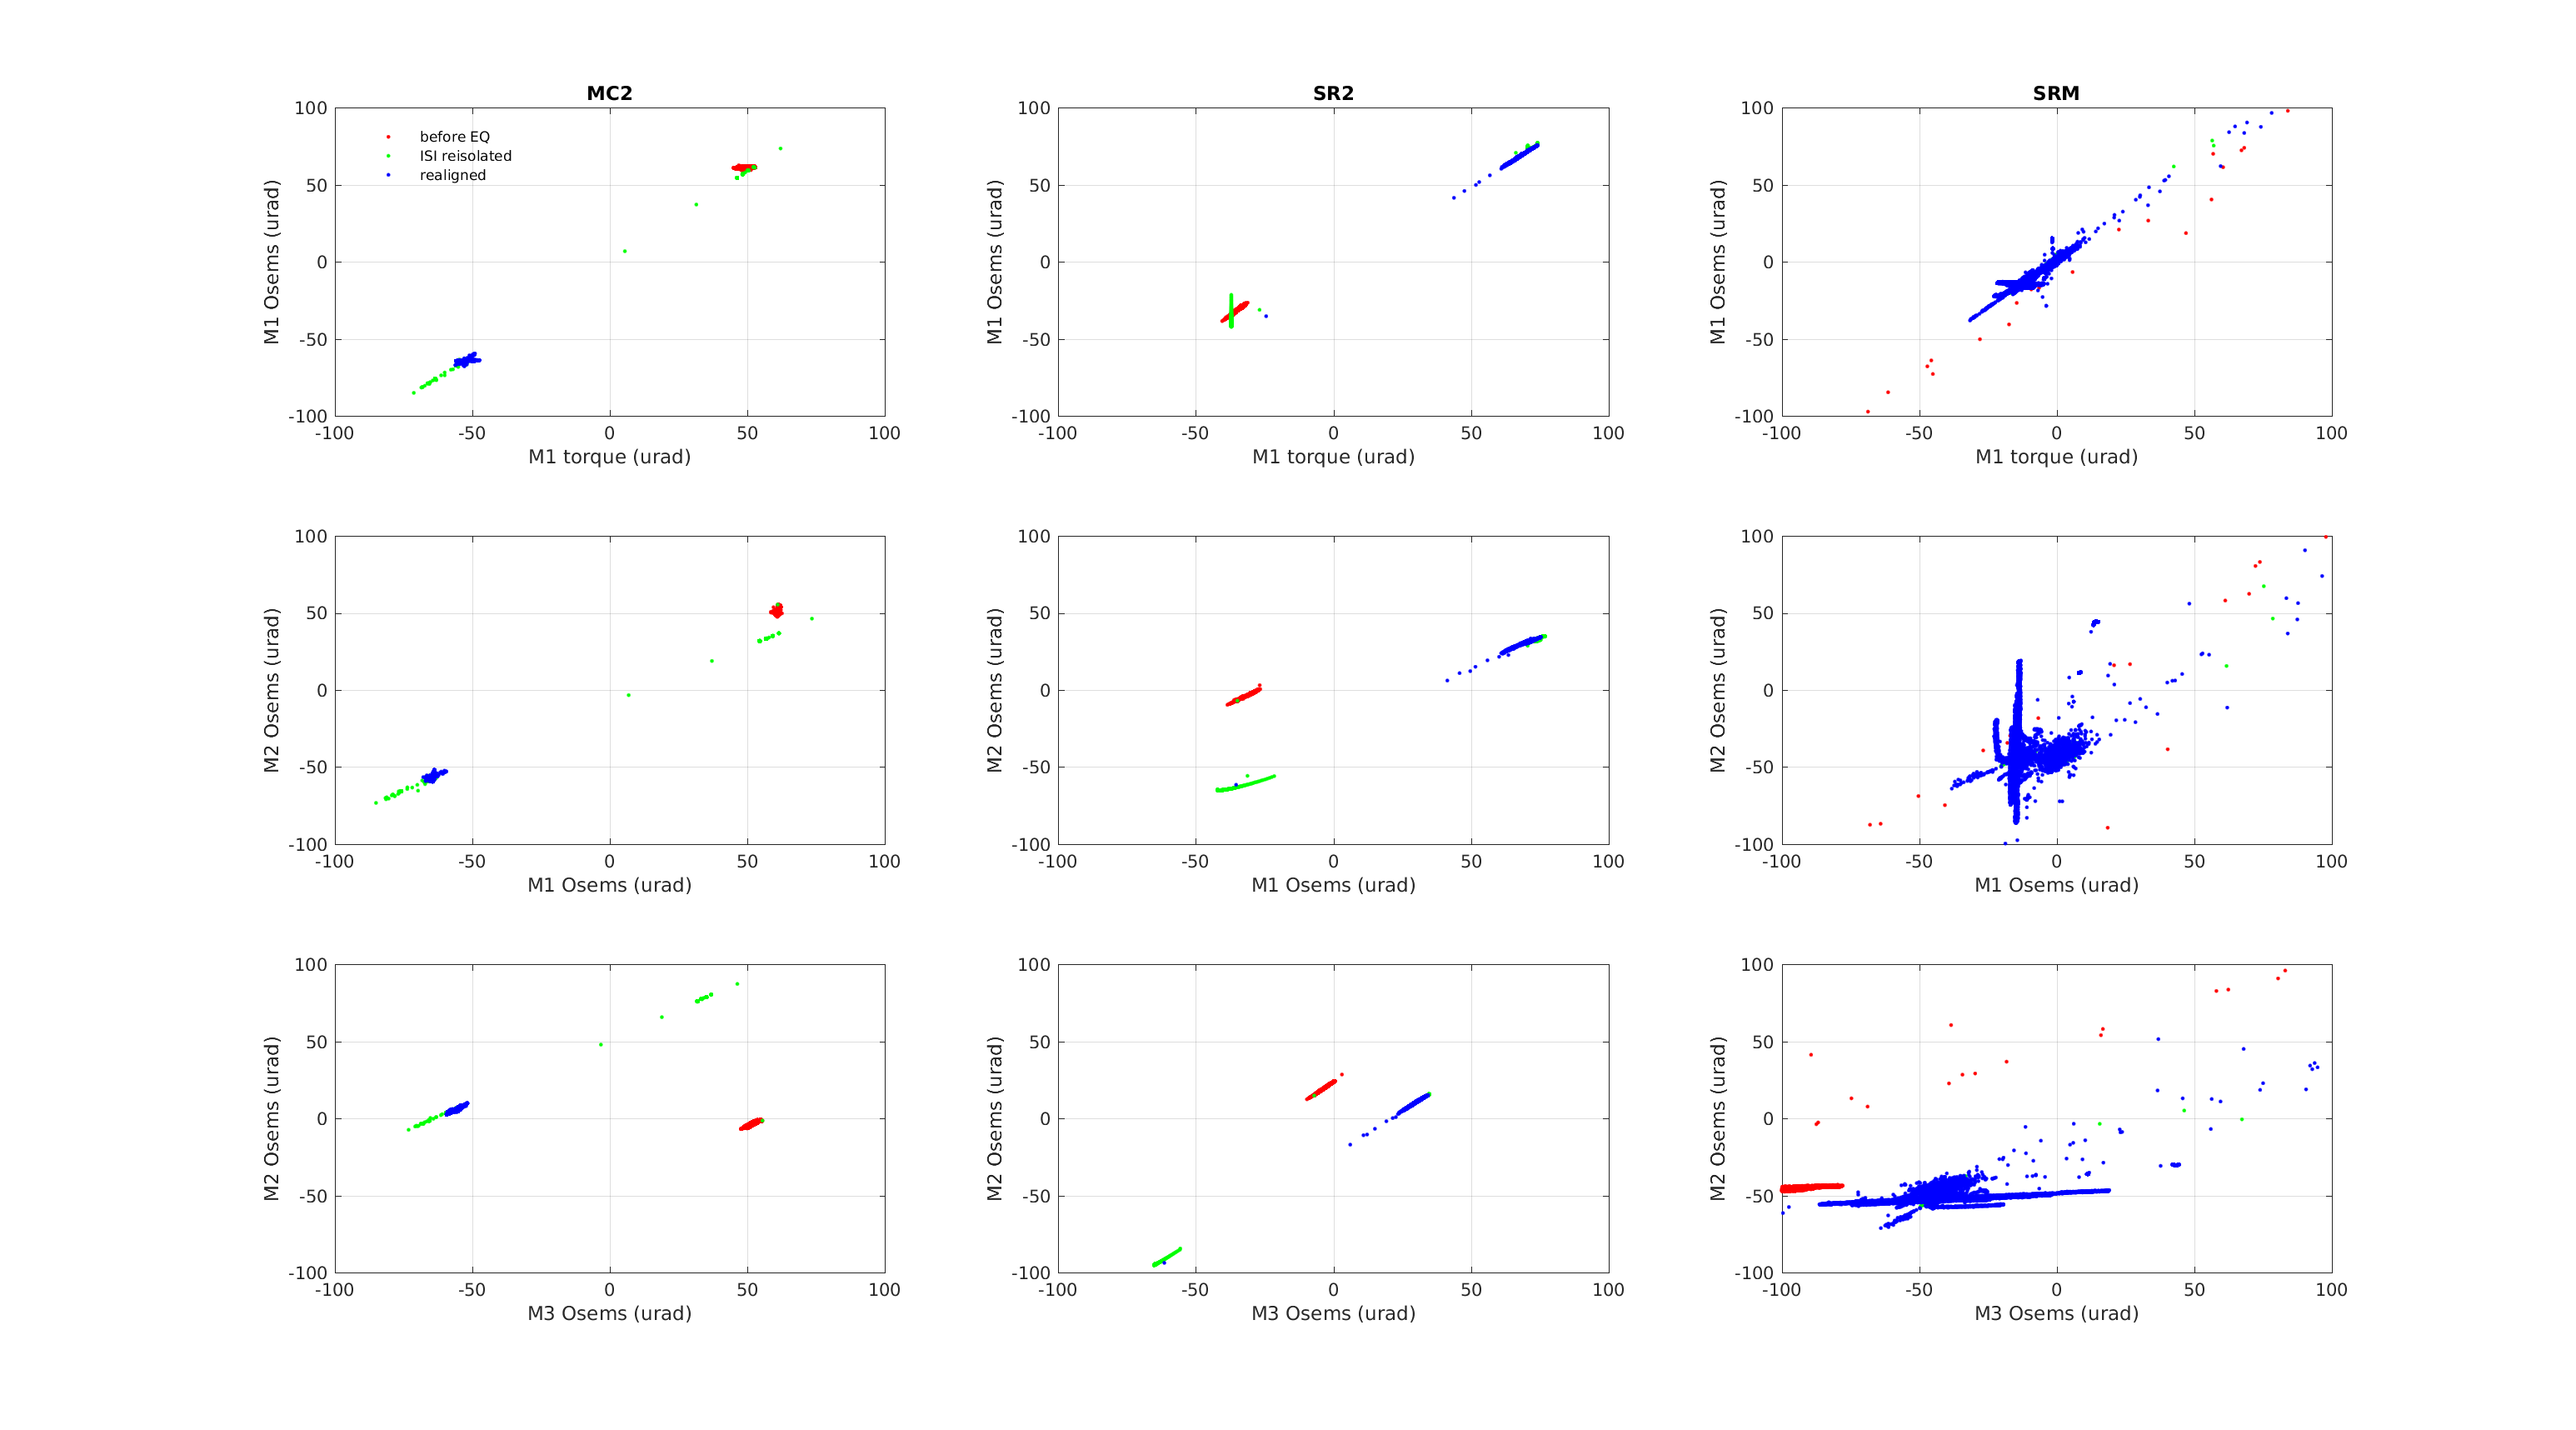
I was hoping that the triples would be easier to understand than the quads, since all the sensors are relative to the cage. In the end I don't think this is very illuminating, but I am posting the plots anyway. Attached are plots for all the small triples showing scatter plots of different osems before and after the Earthquake, analogous to the plots attached to 37799
You can see that for some of the triples, there is no change in the linear relationship between top mass torque and pitch and top mass vs intermediate mass pitch, and small offsets between the intermediate mass and bottom mass. These could just be unreliable readings from the bottom mass osems (MC1, and MC3 are good examples) PR2+SR2 seem to have real shift similar to the shifts we see on all the quads.