patrick.thomas@LIGO.ORG - posted 18:04, Wednesday 02 August 2017 - last comment - 12:13, Monday 07 August 2017(37974)
H1 ISI CPS Noise Spectra Check - Weekly
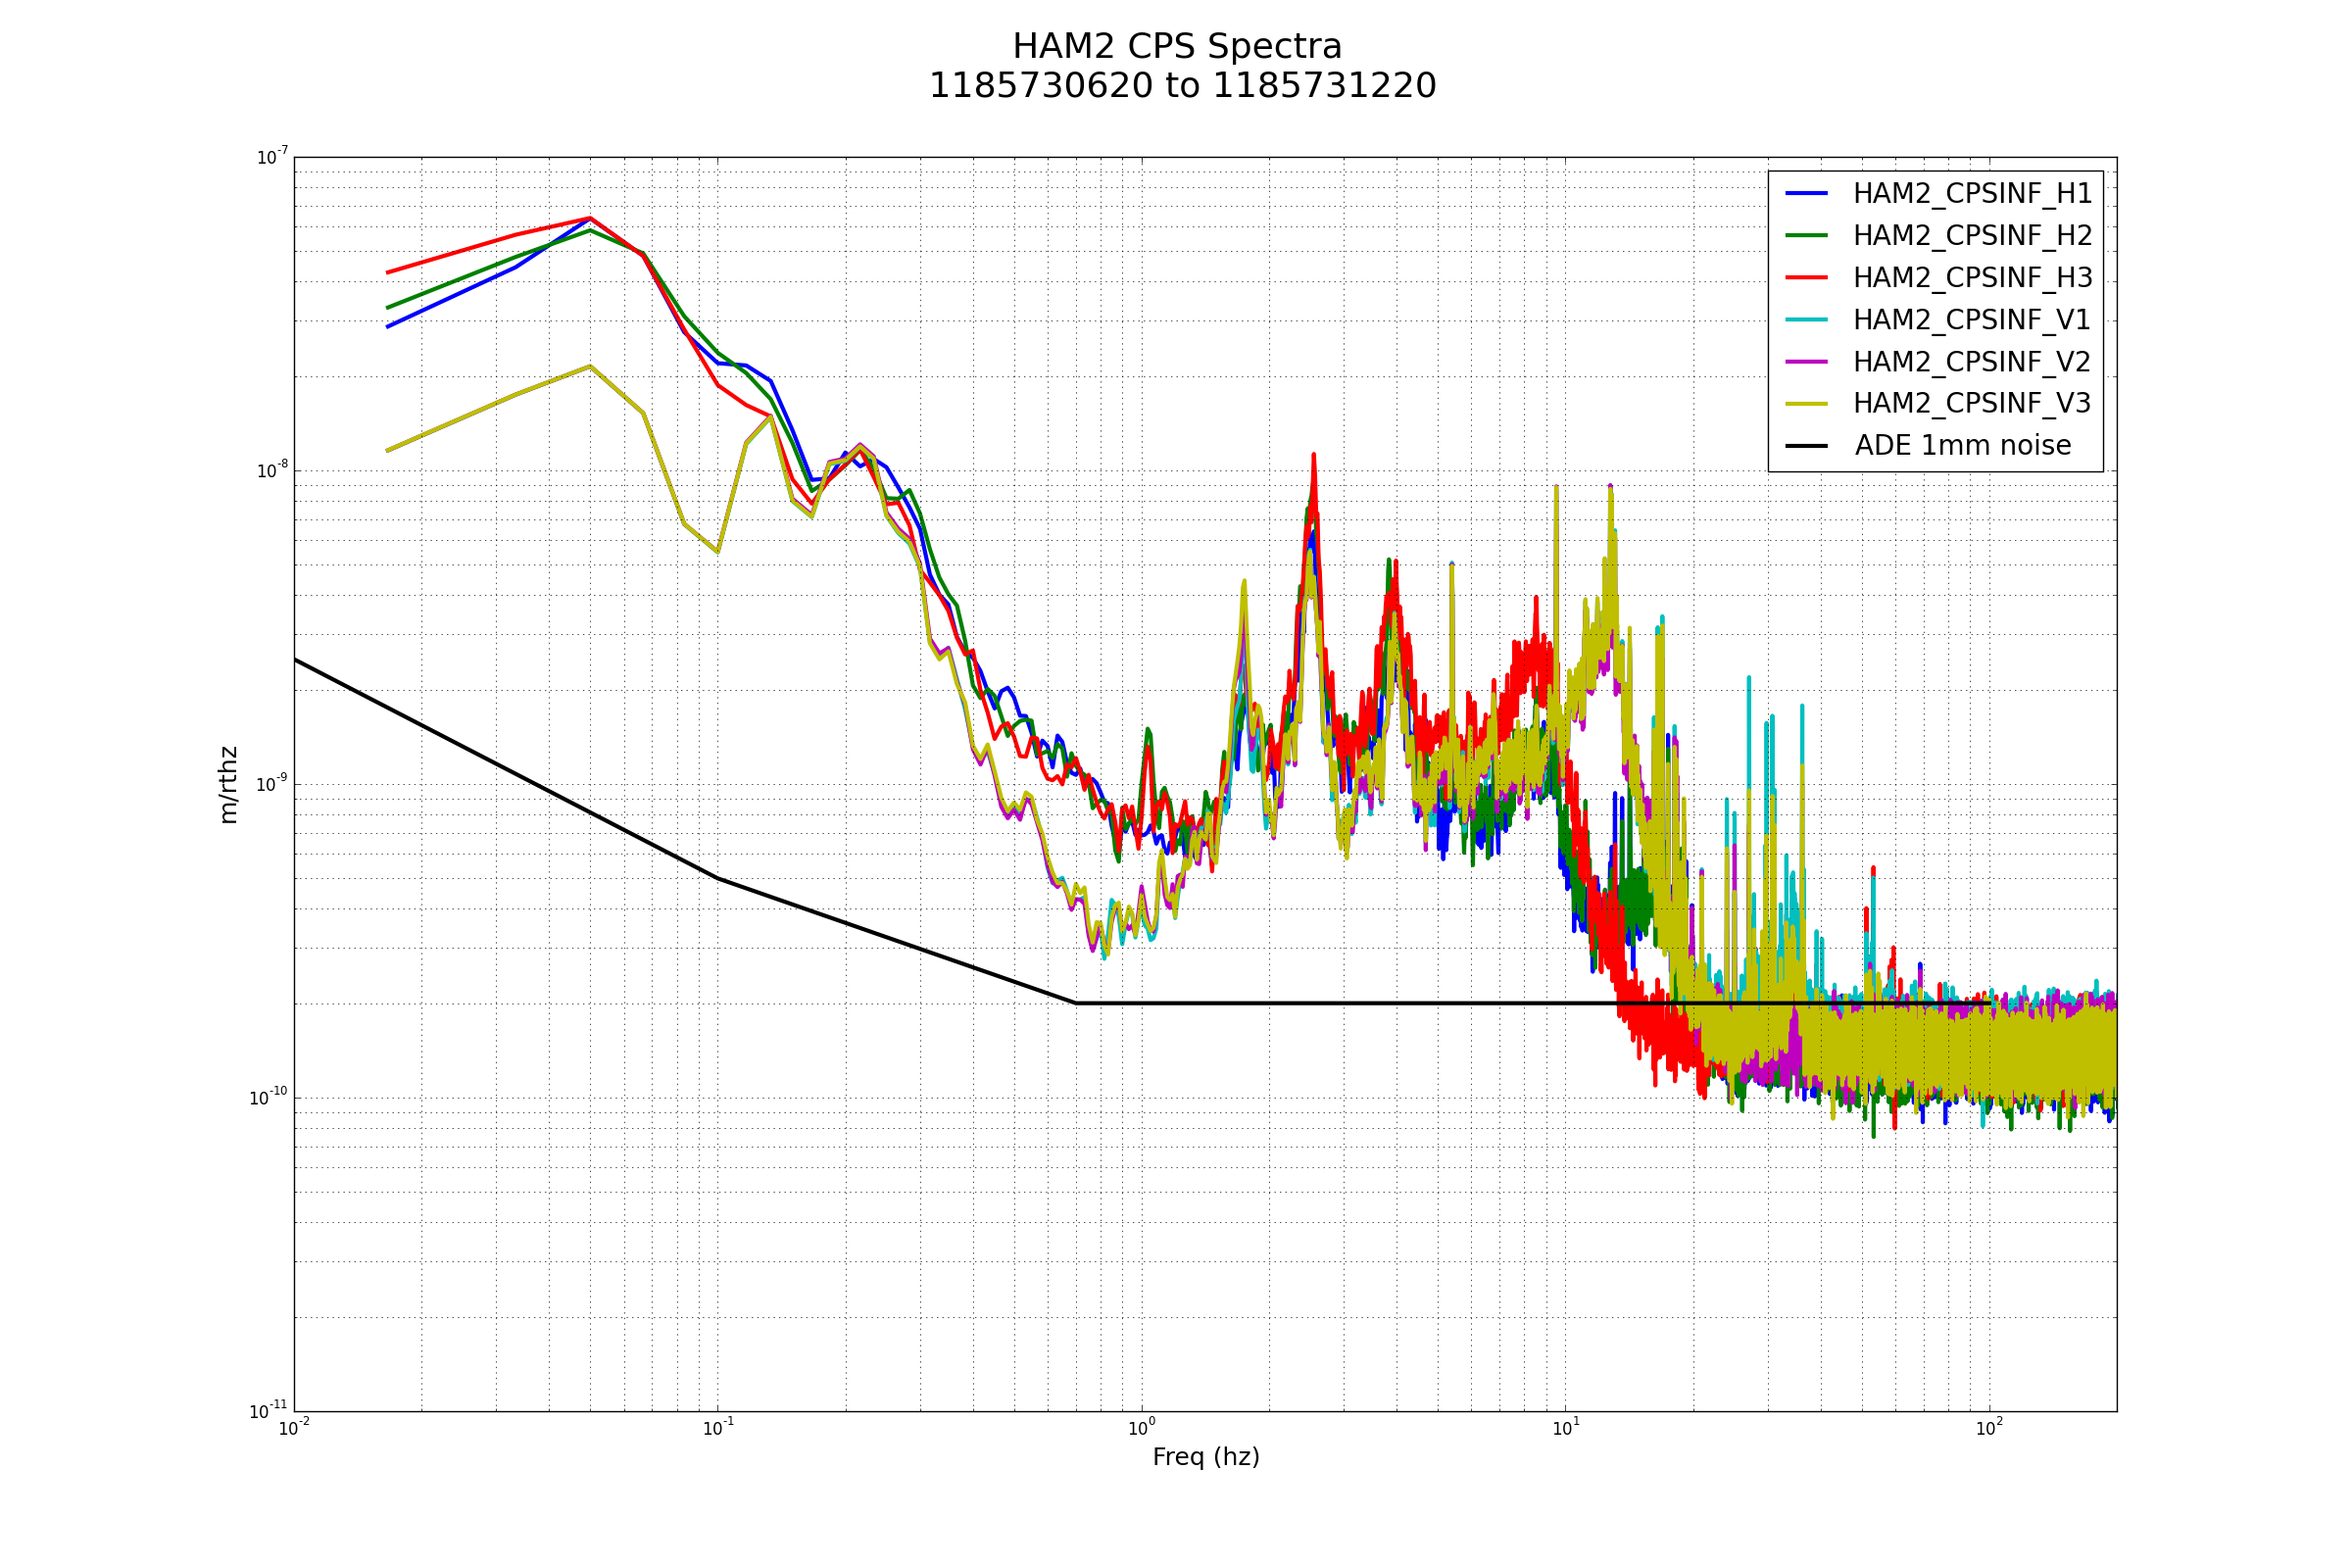
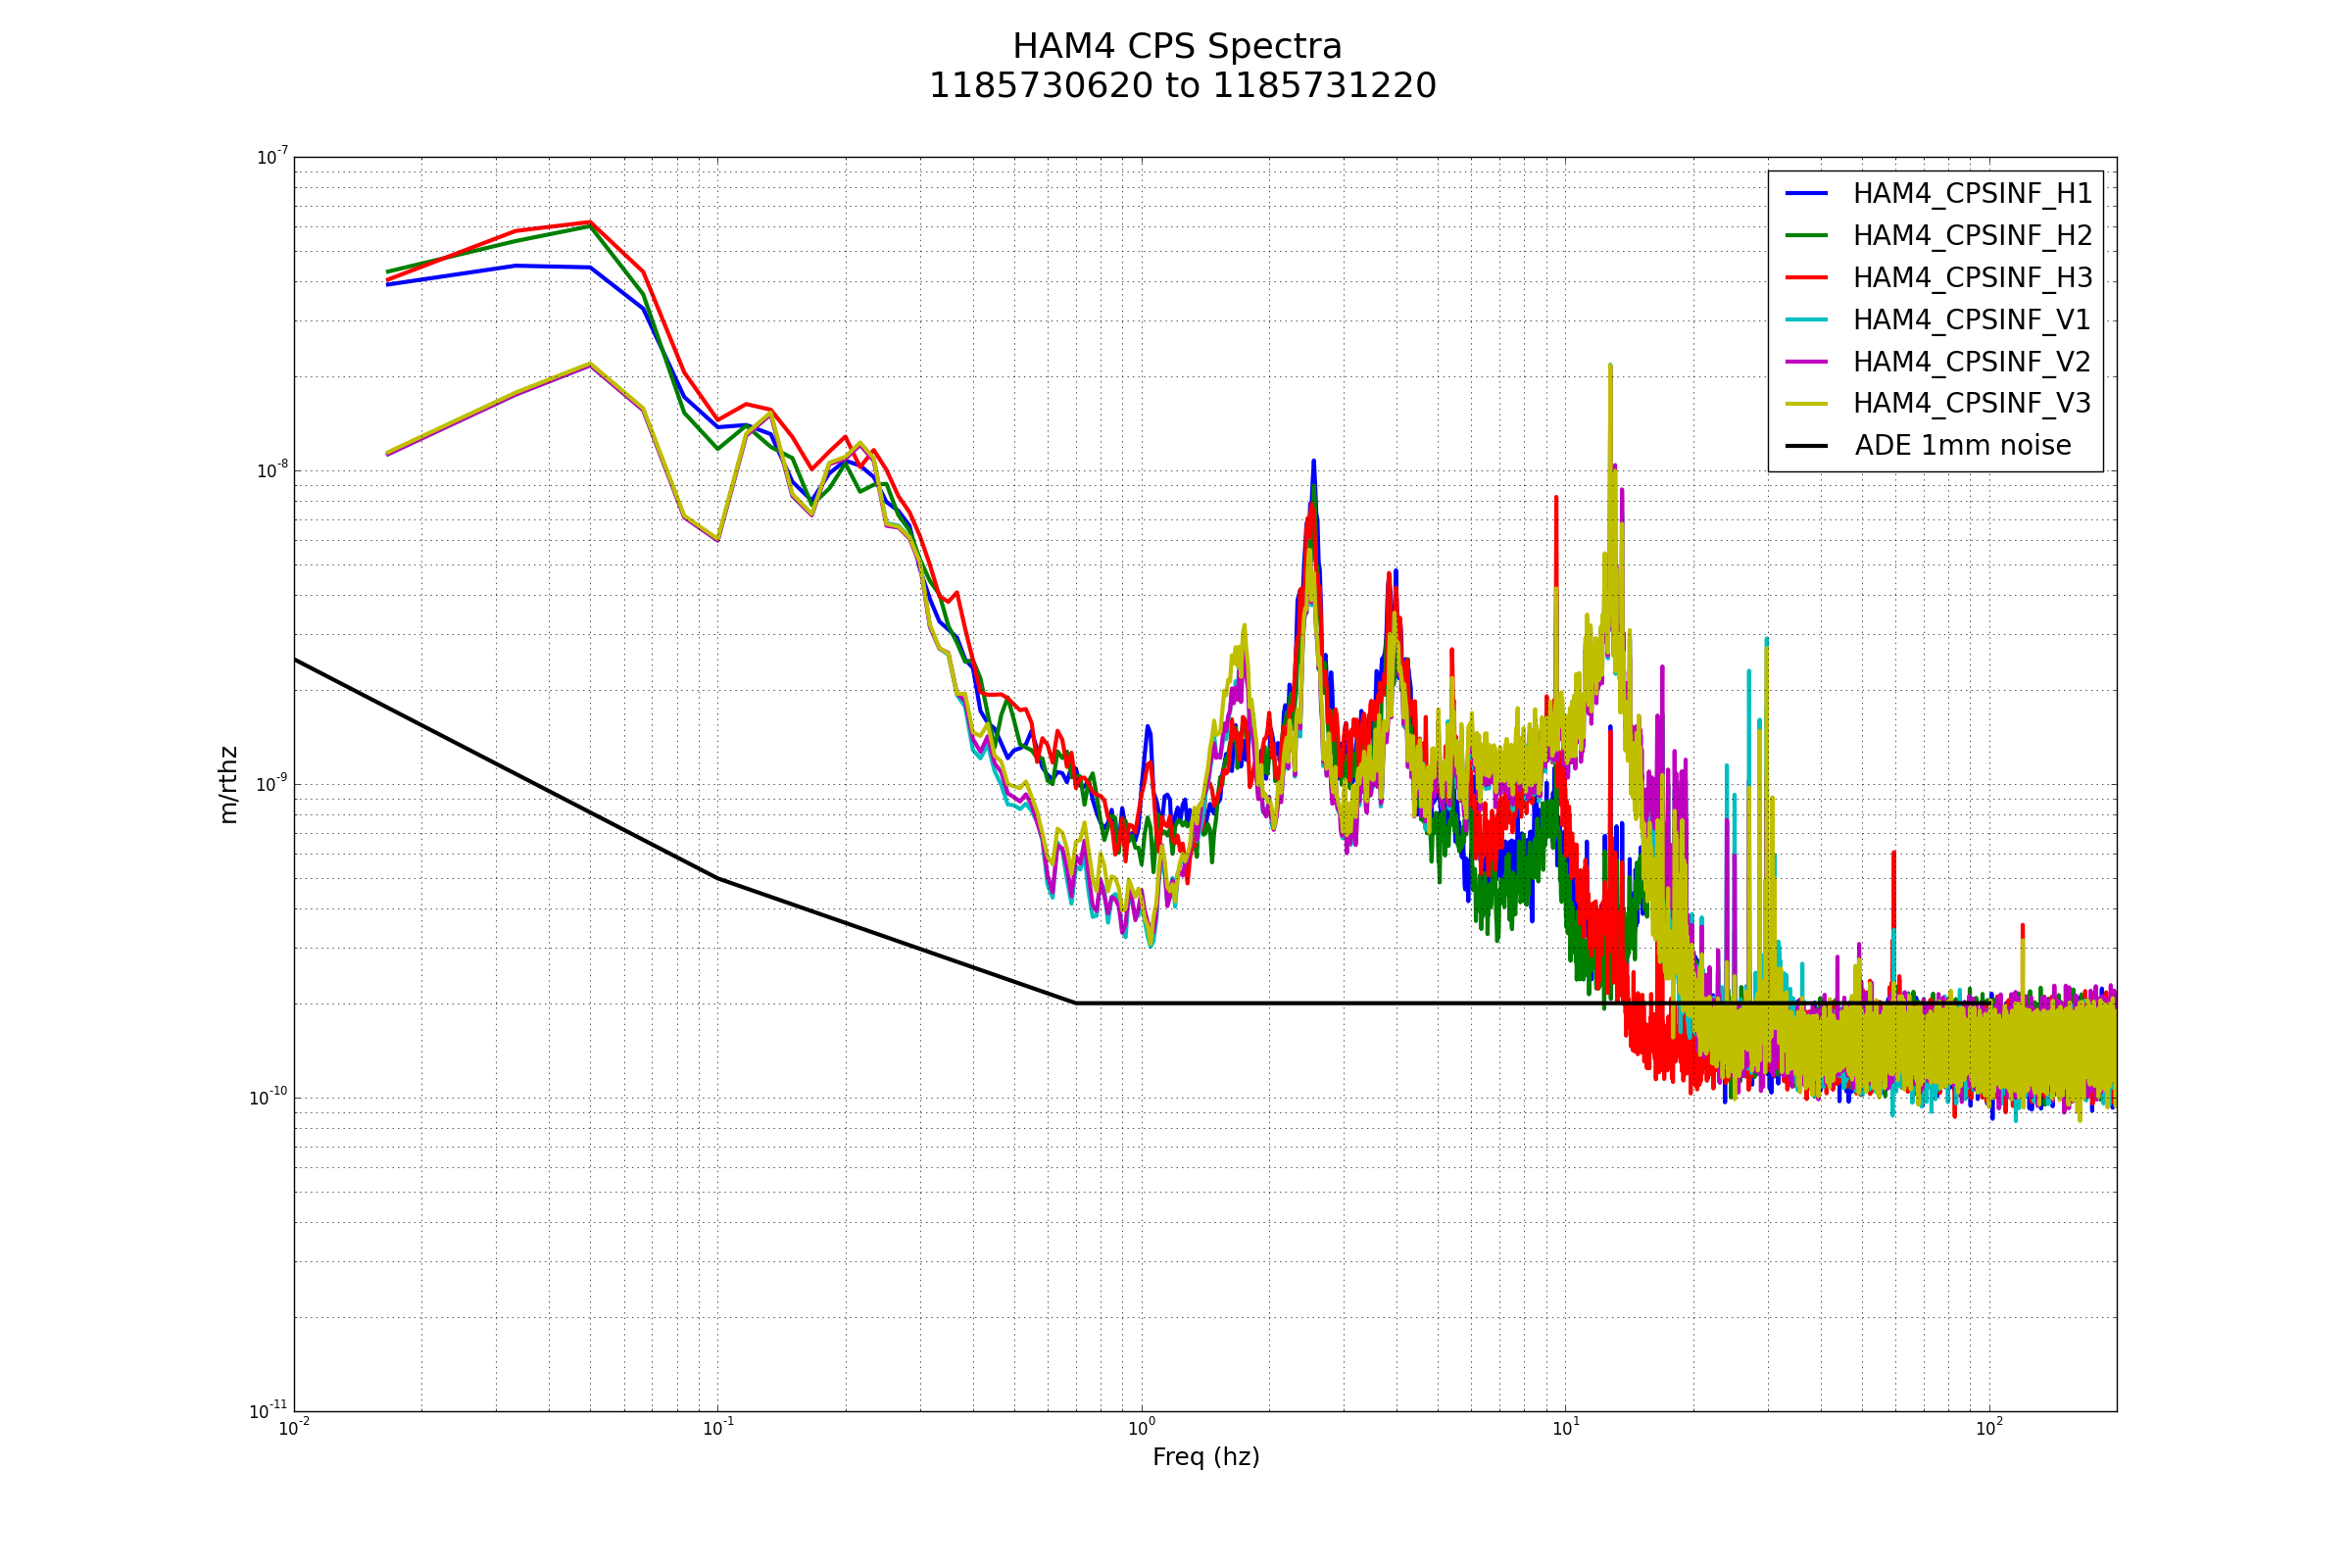
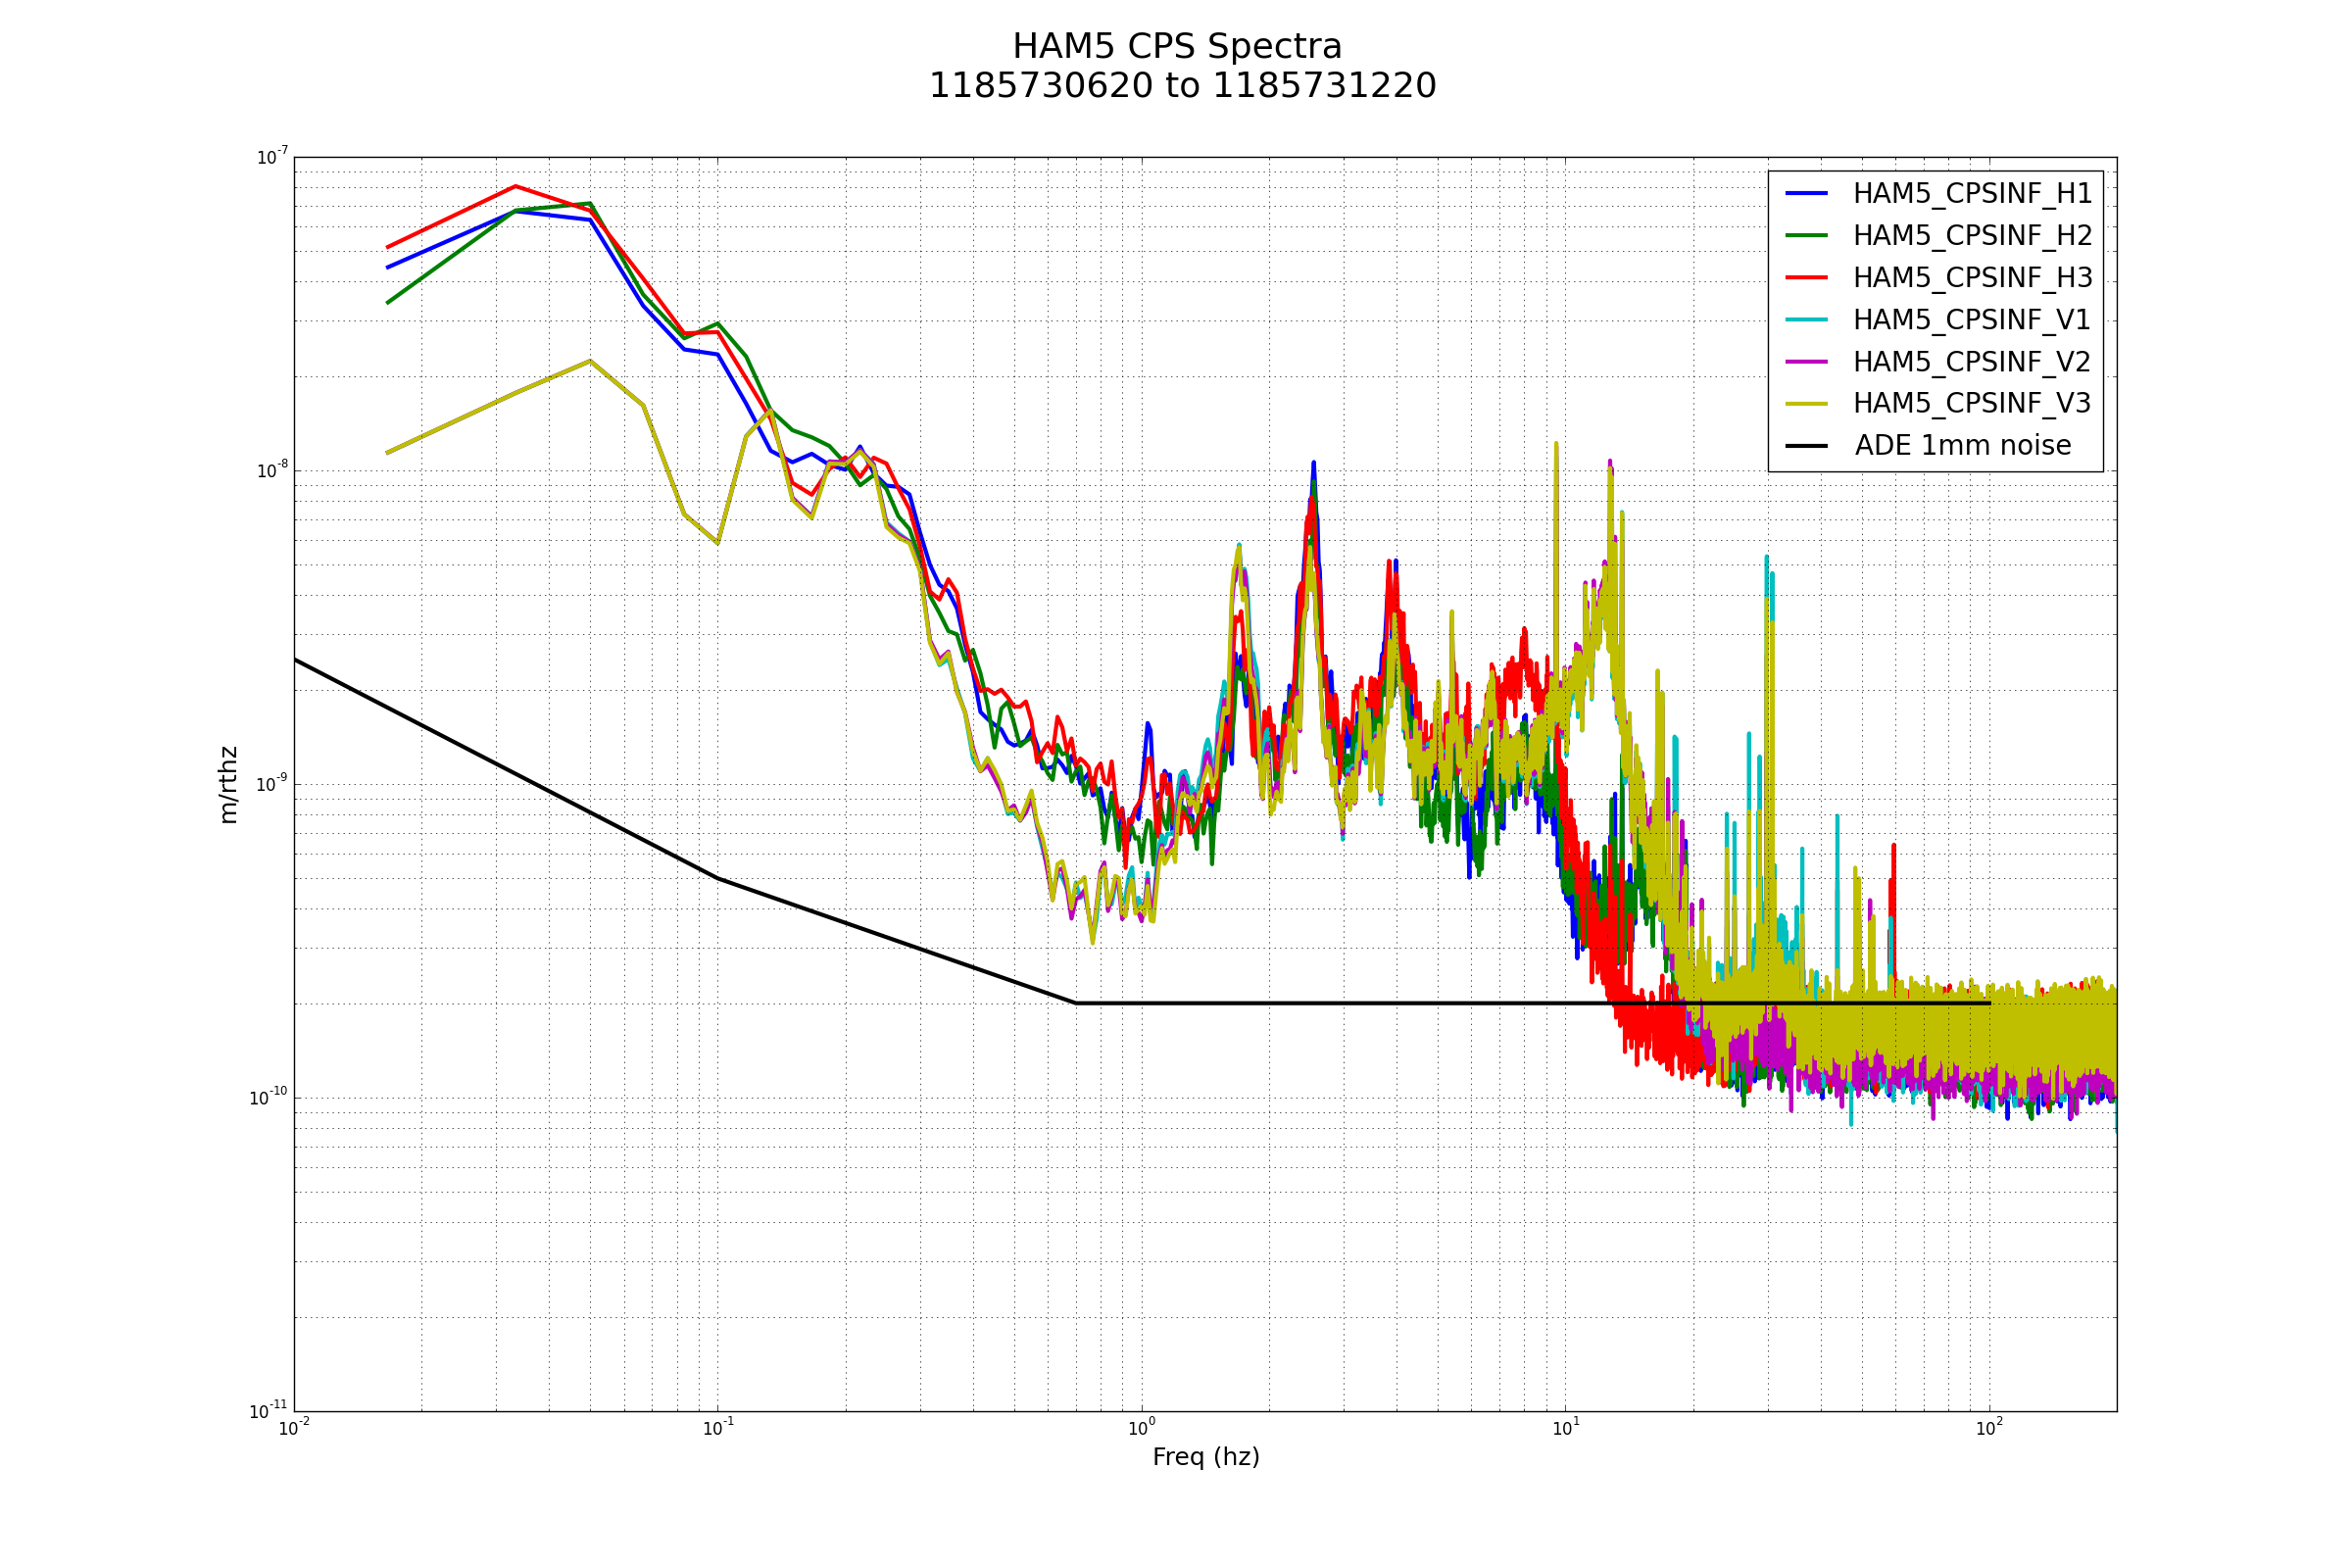
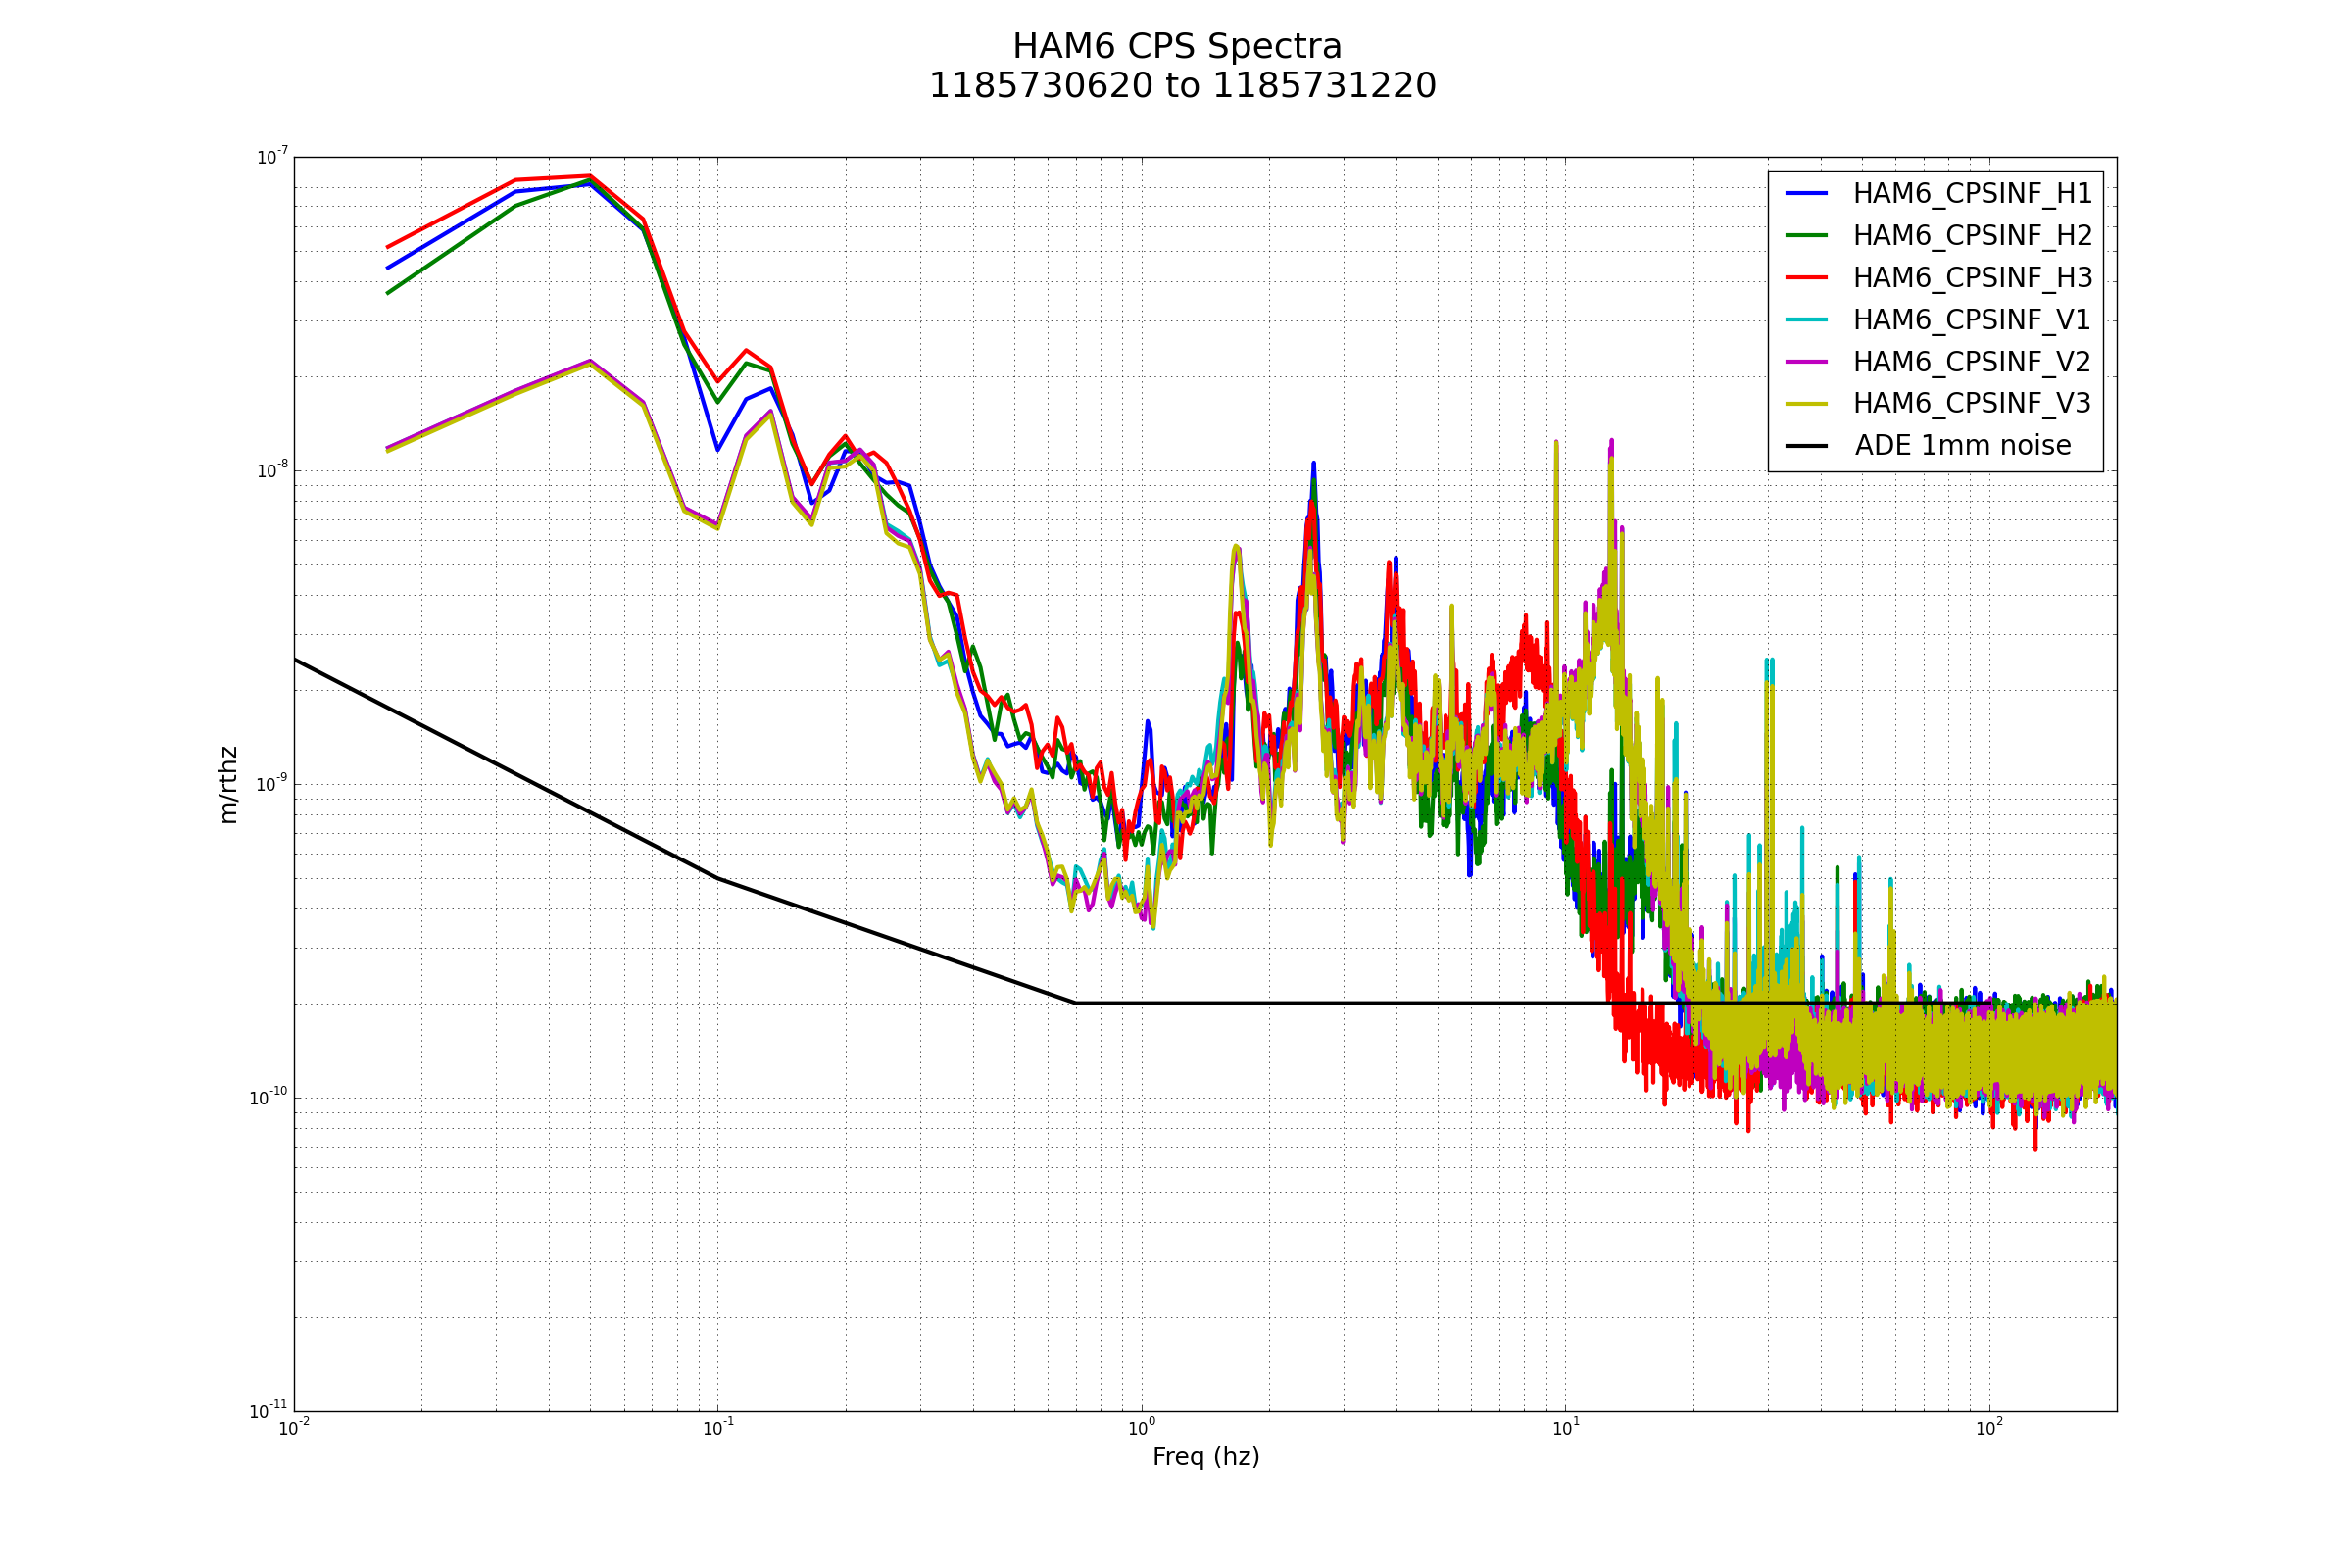
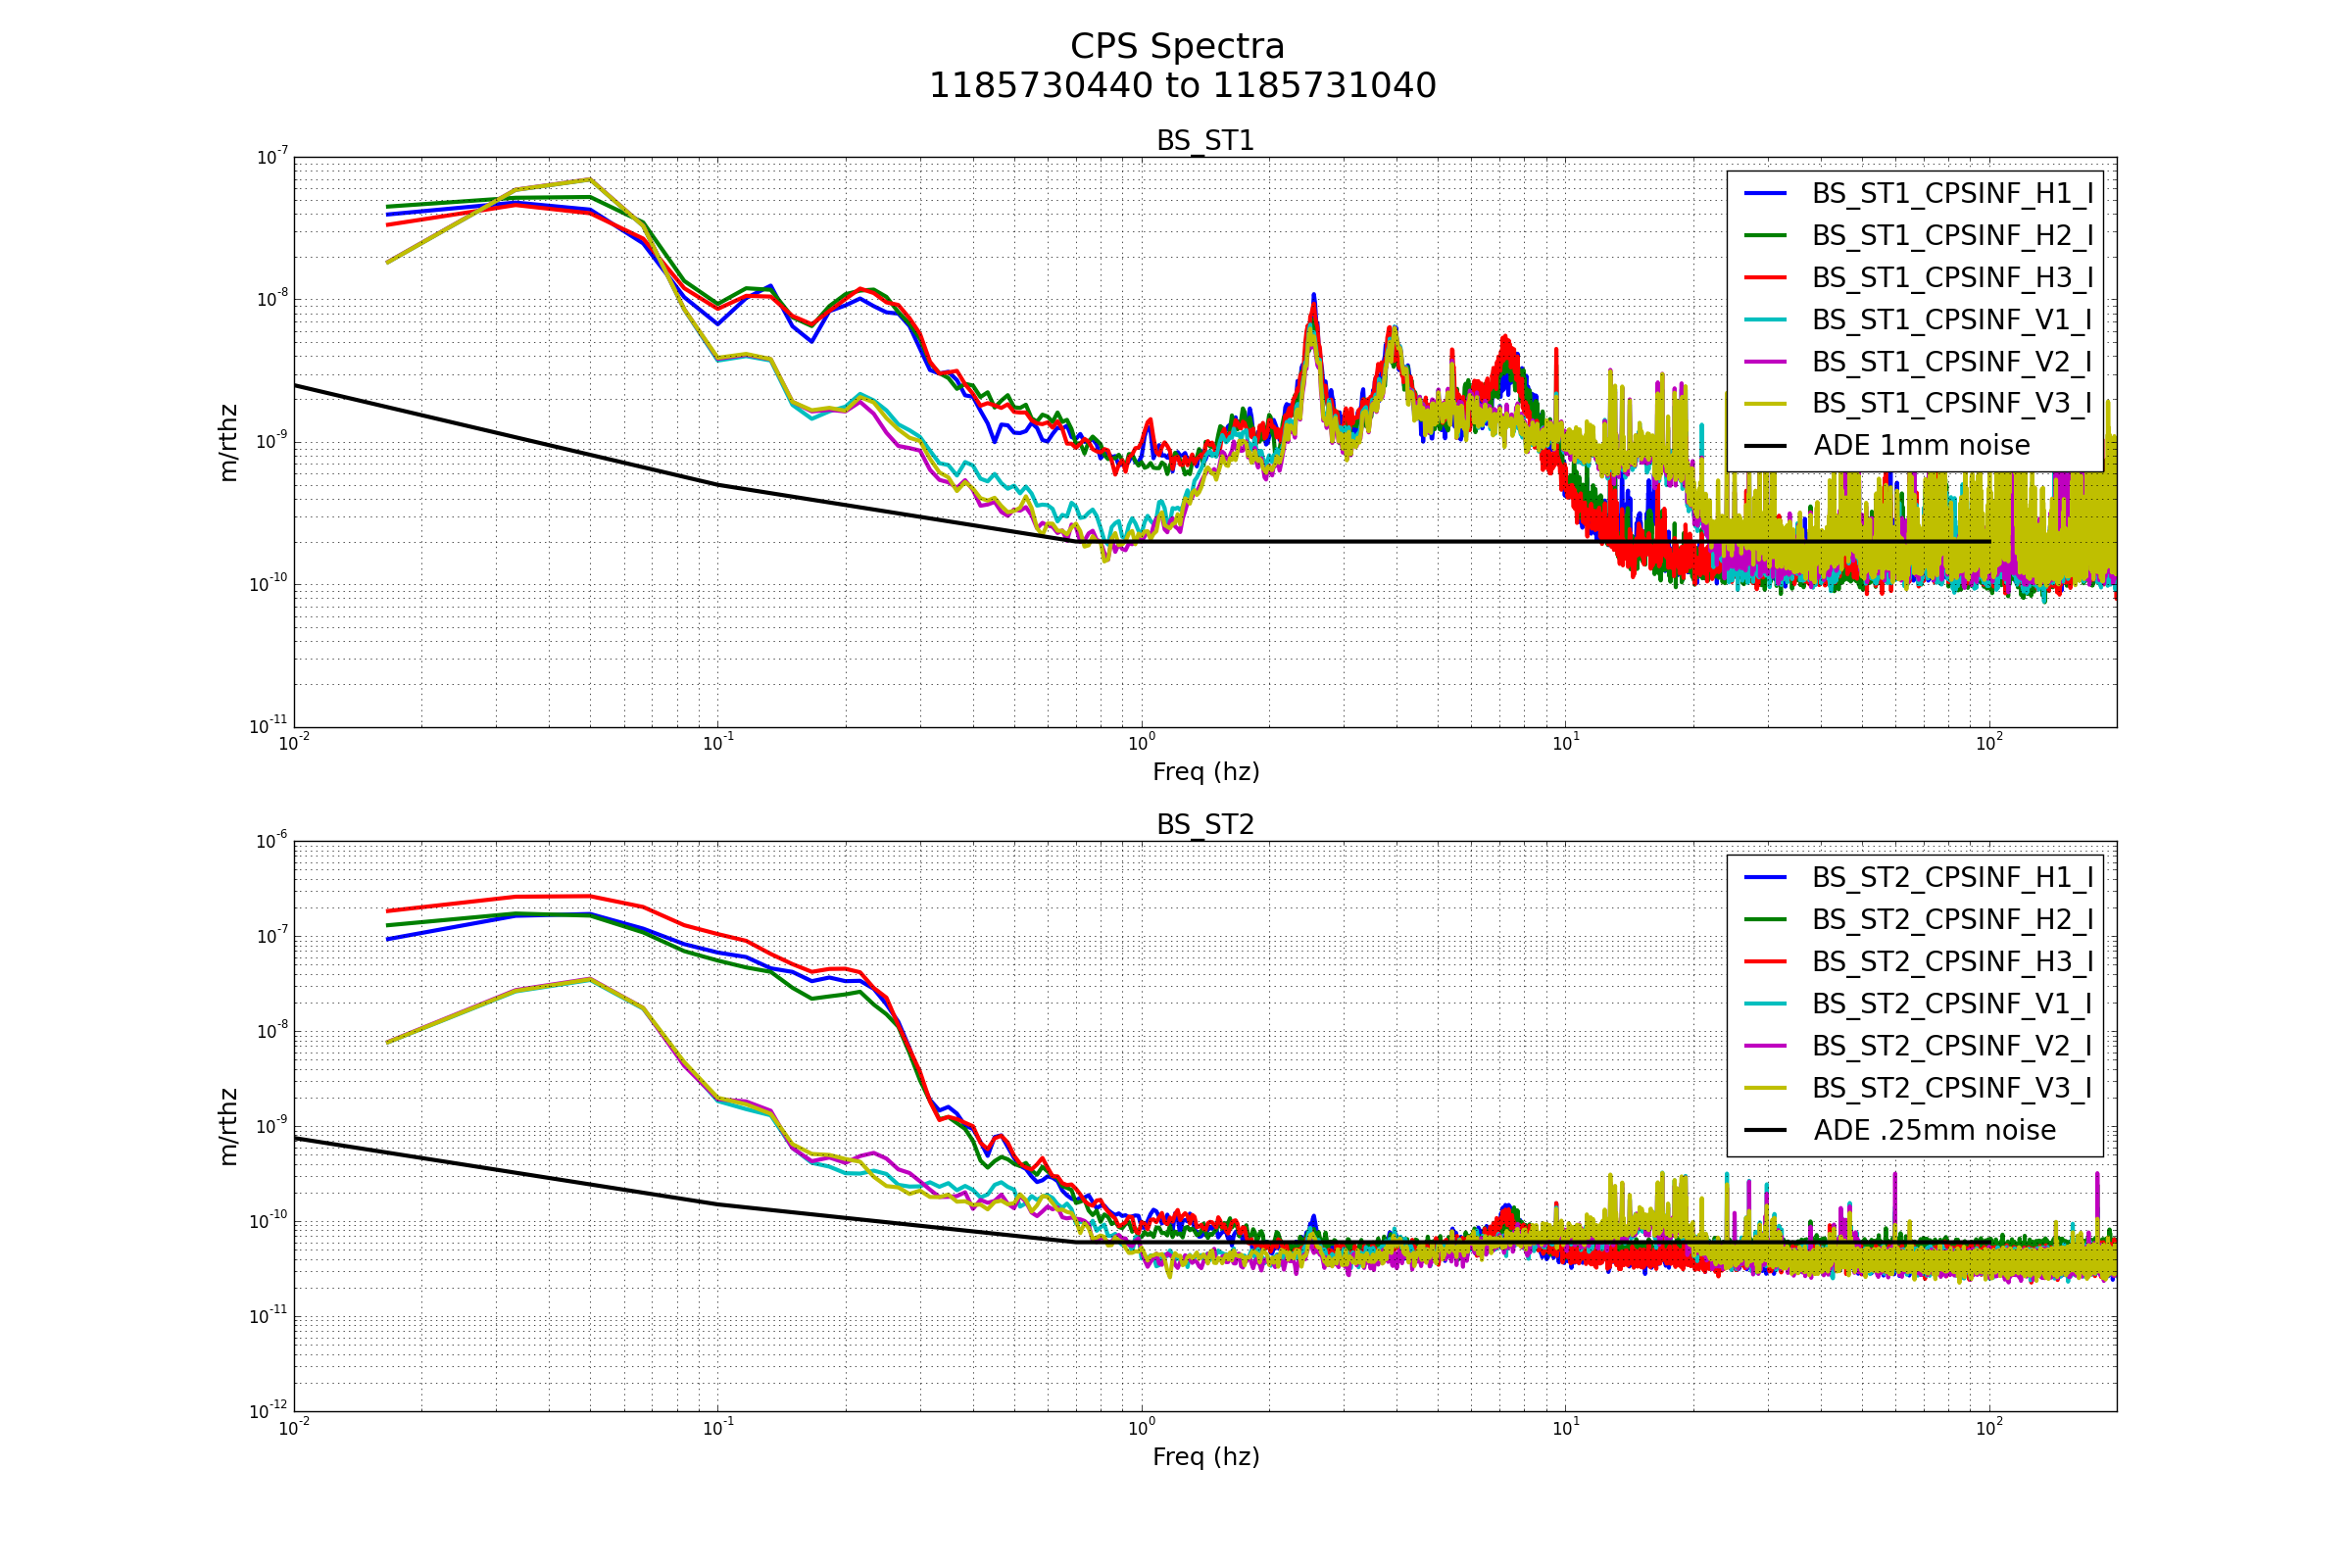
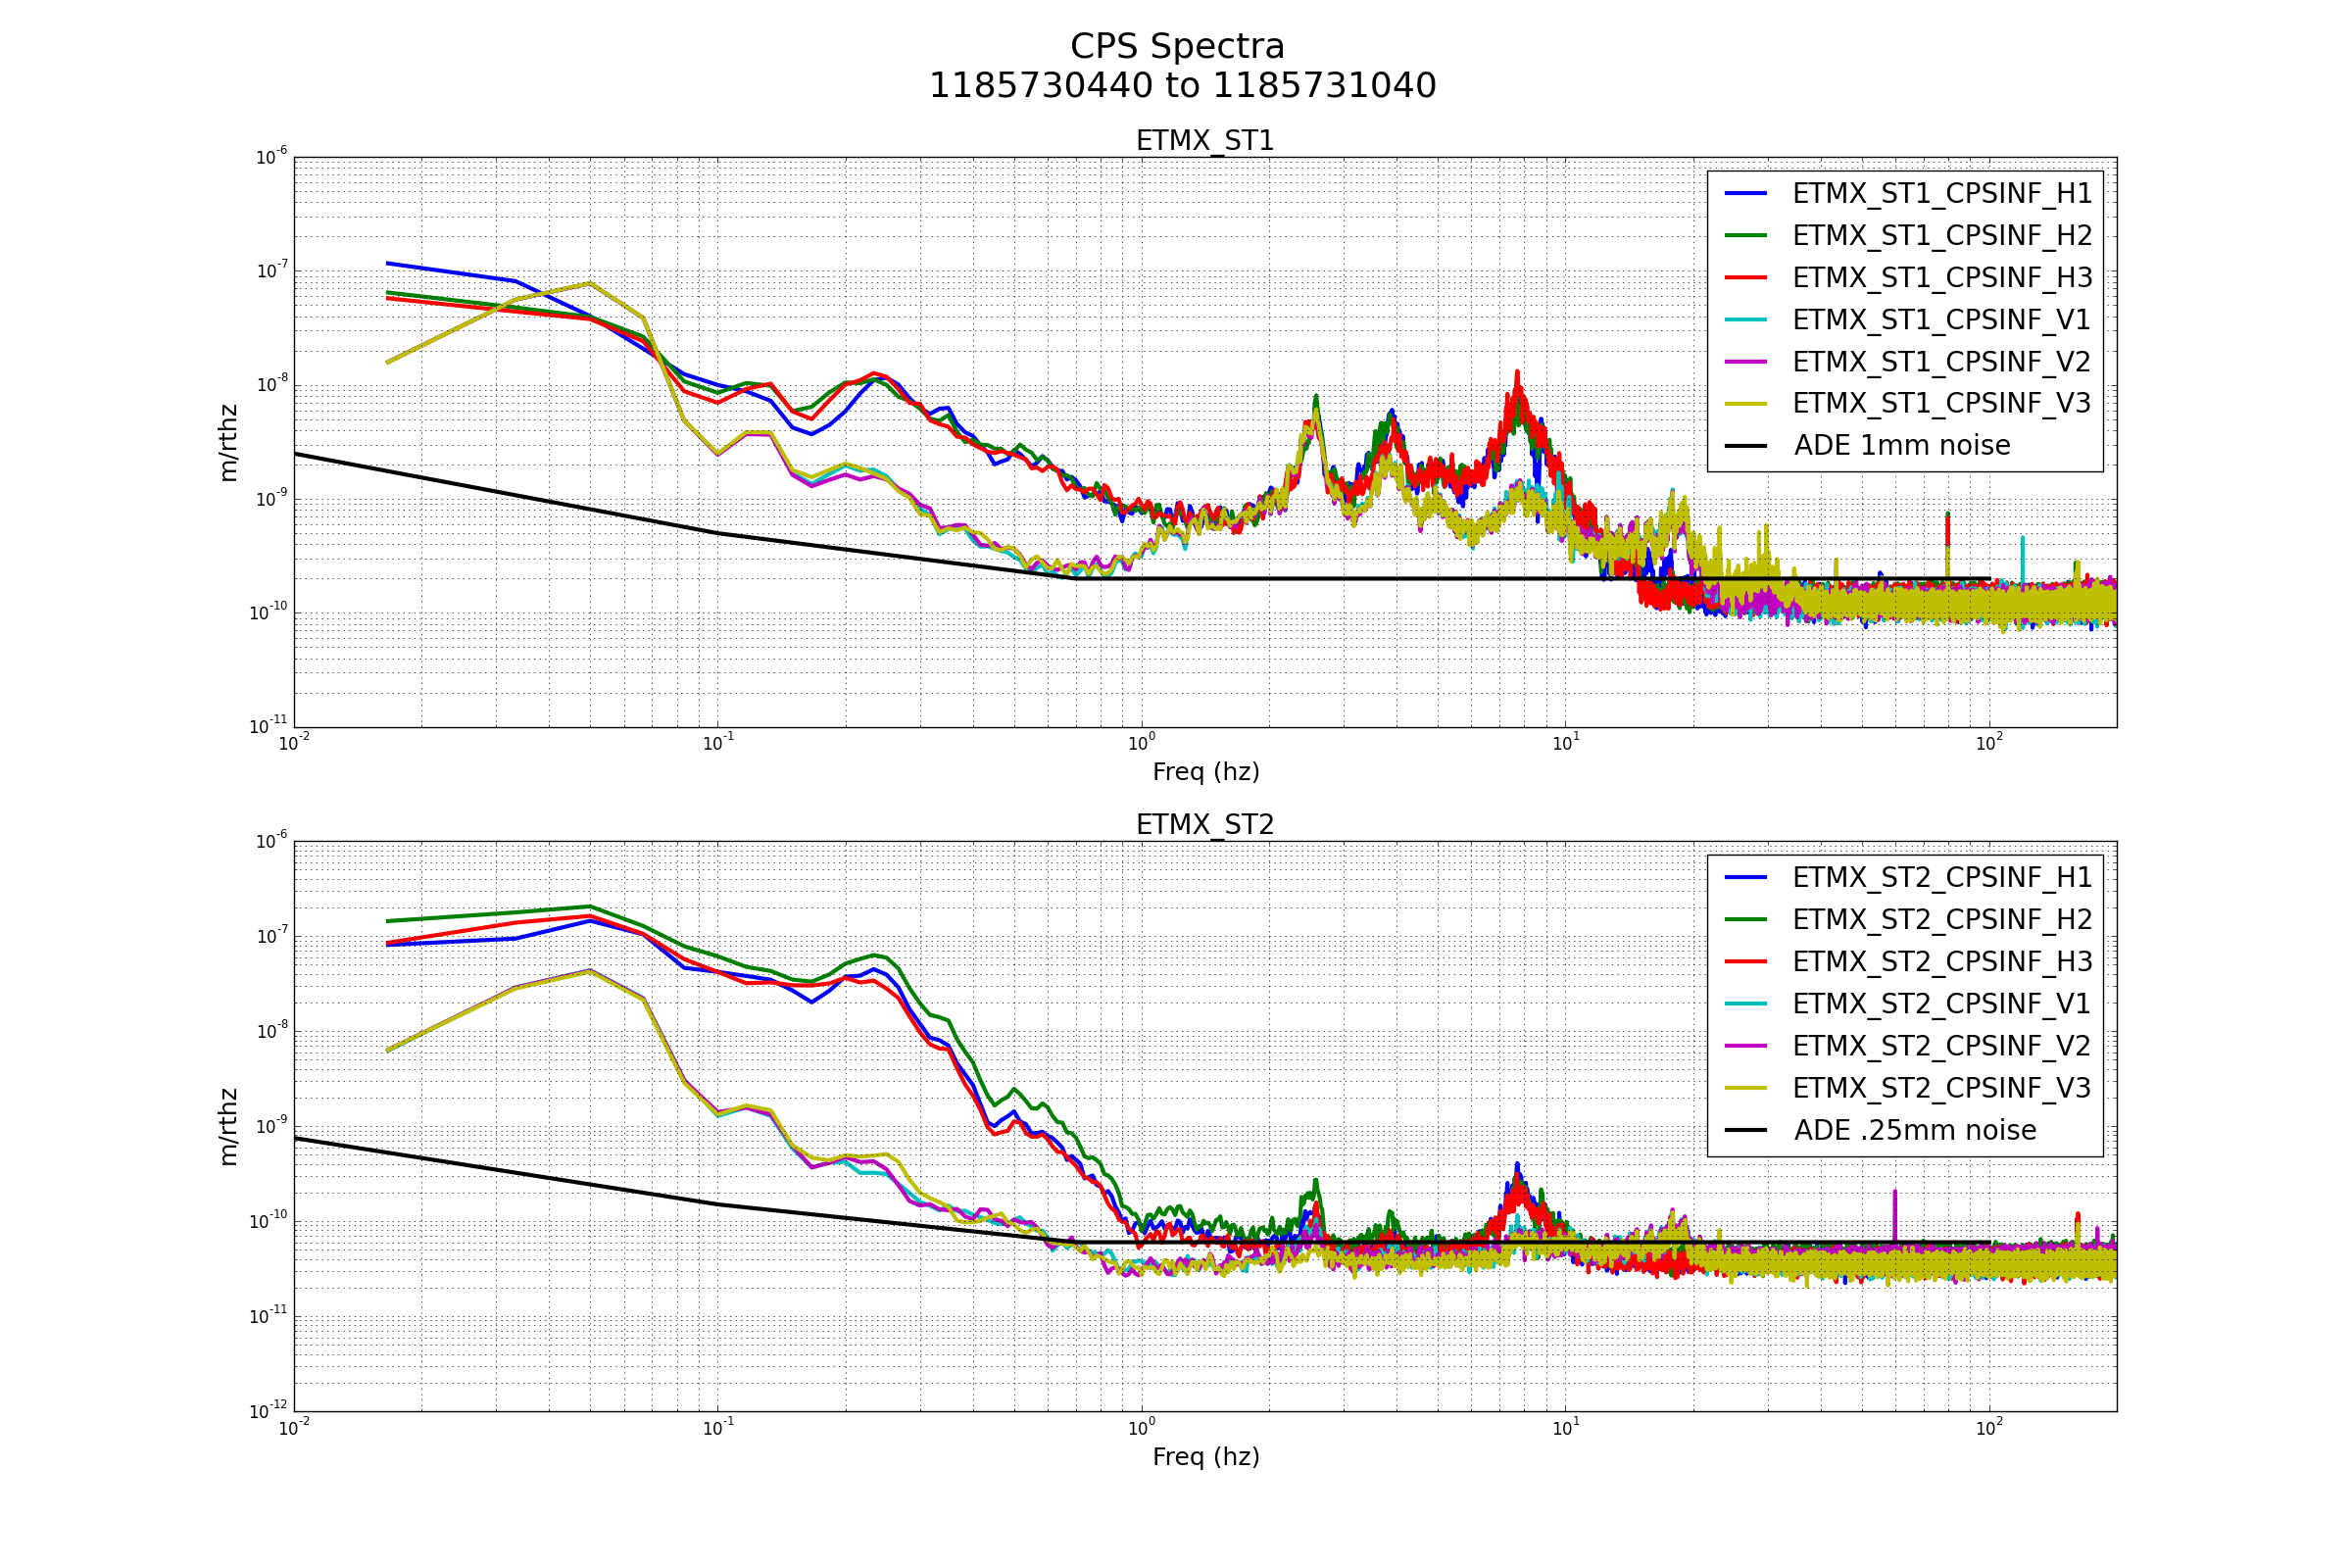
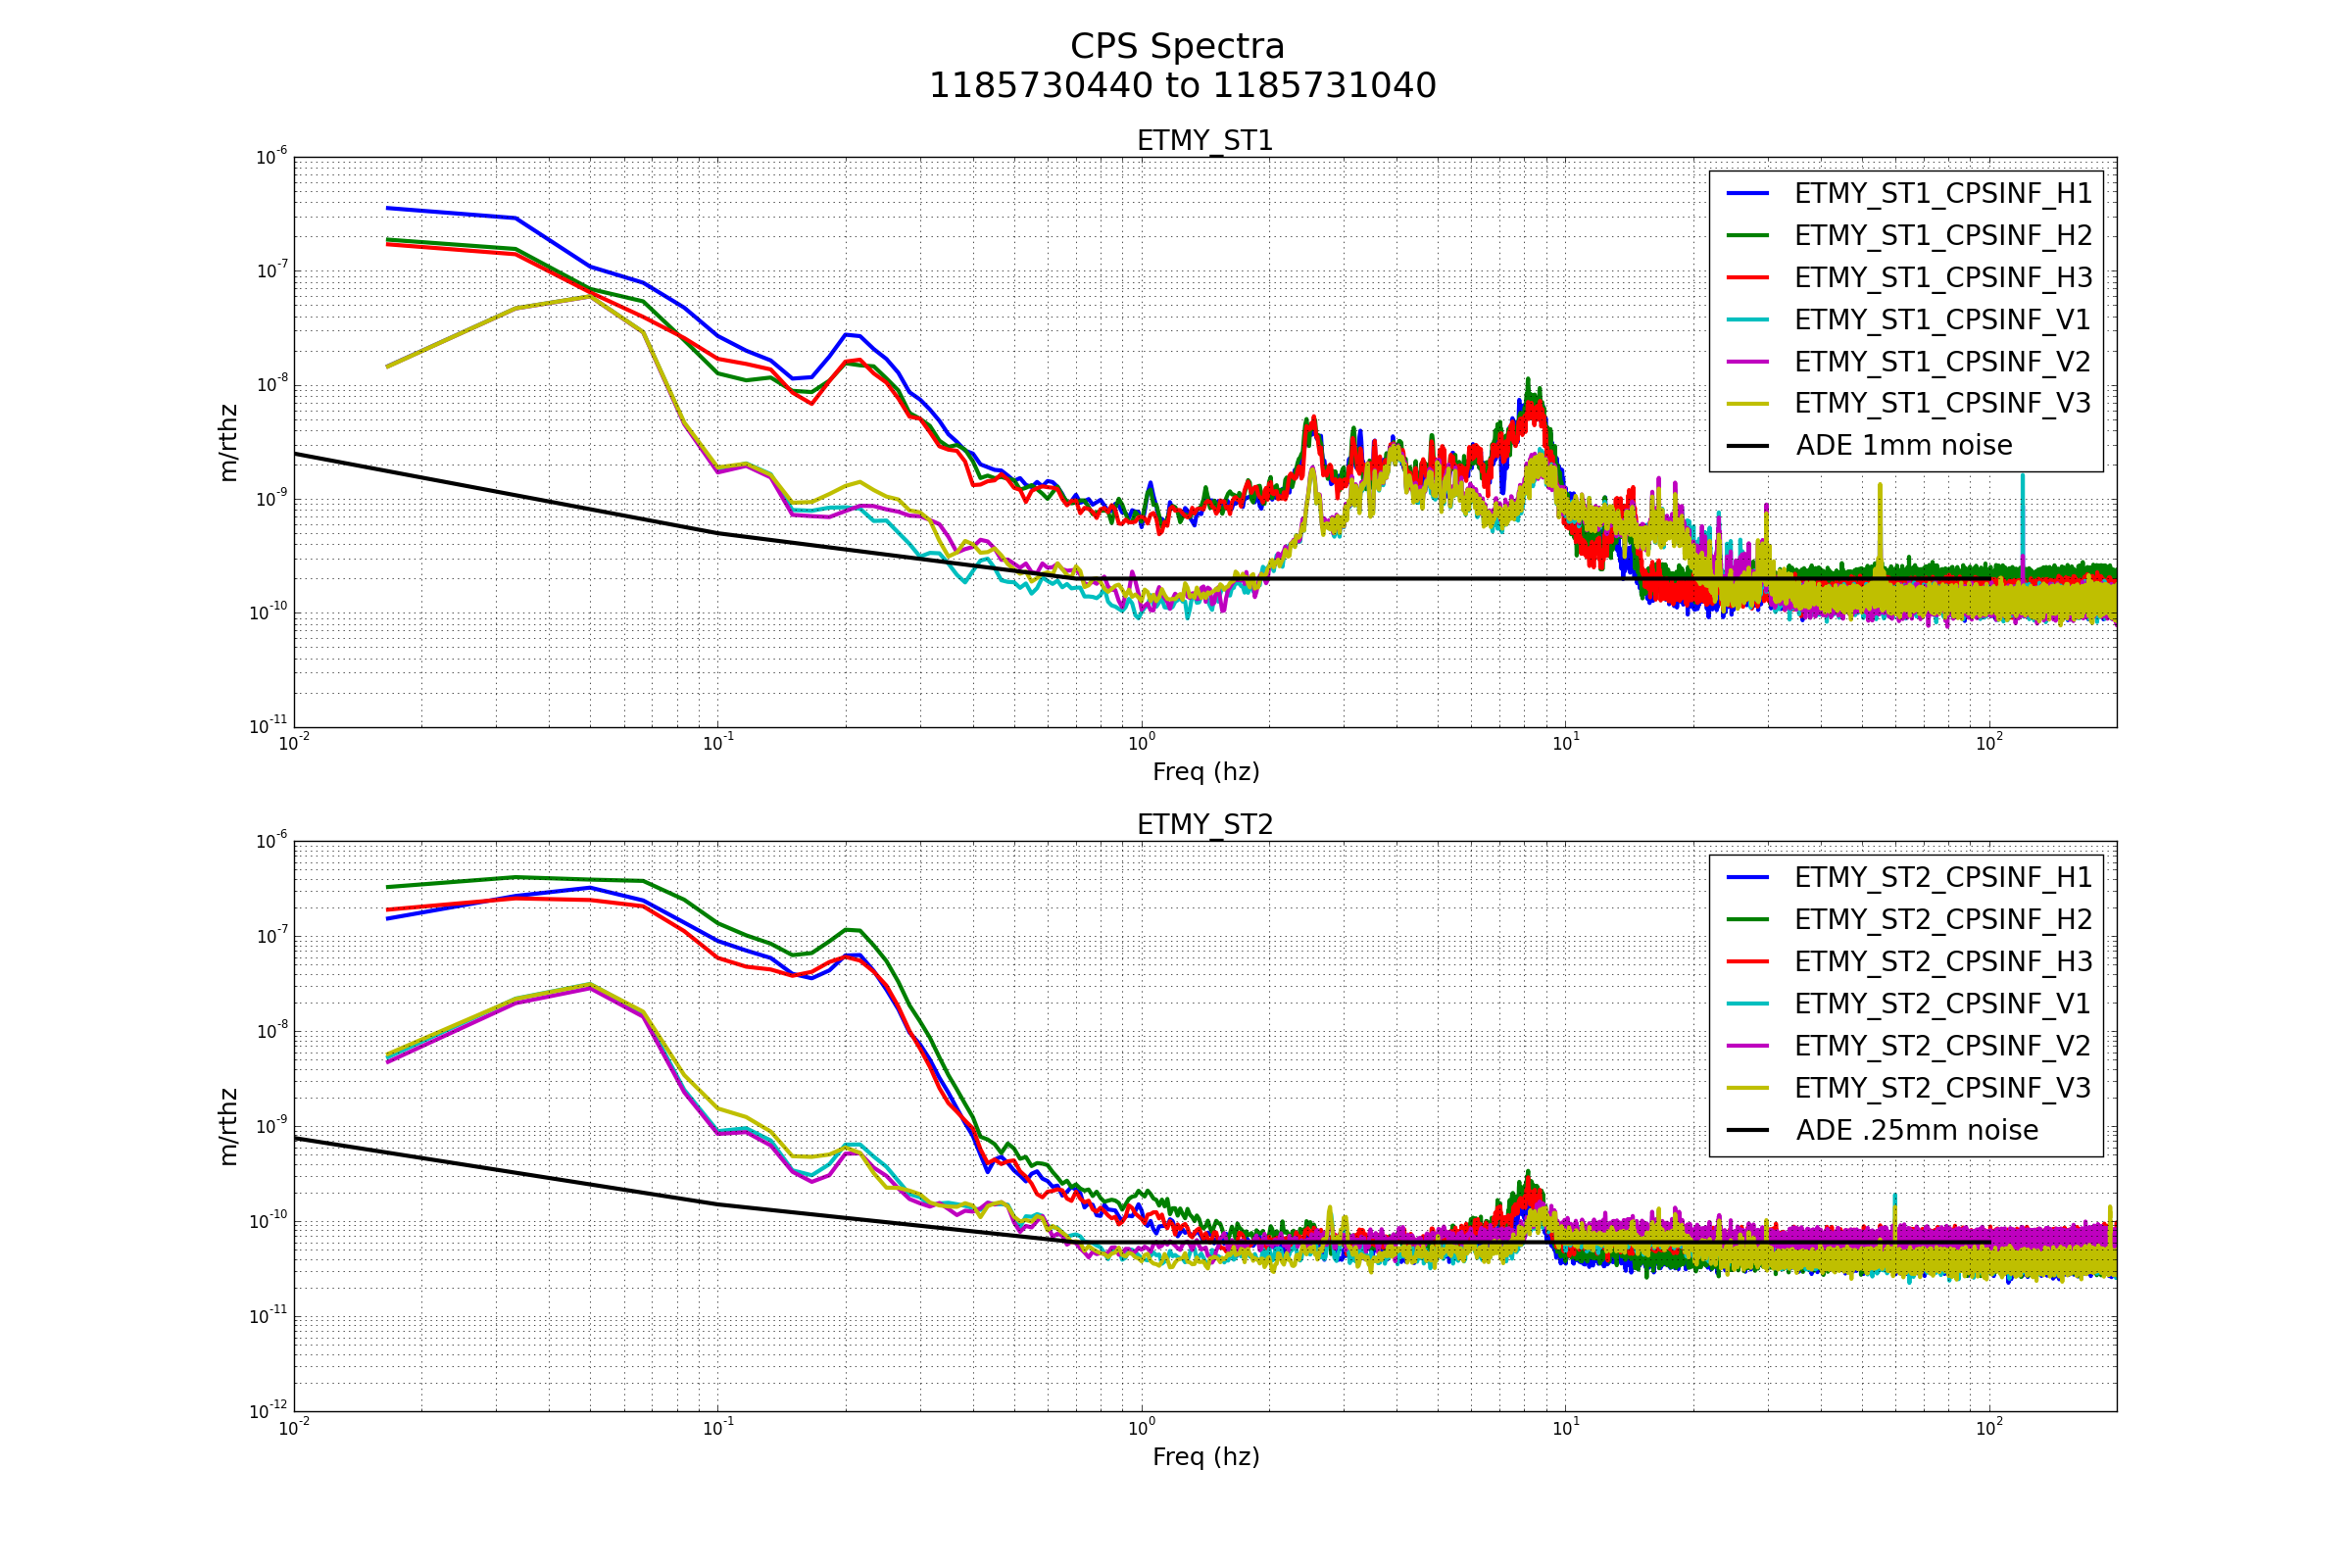
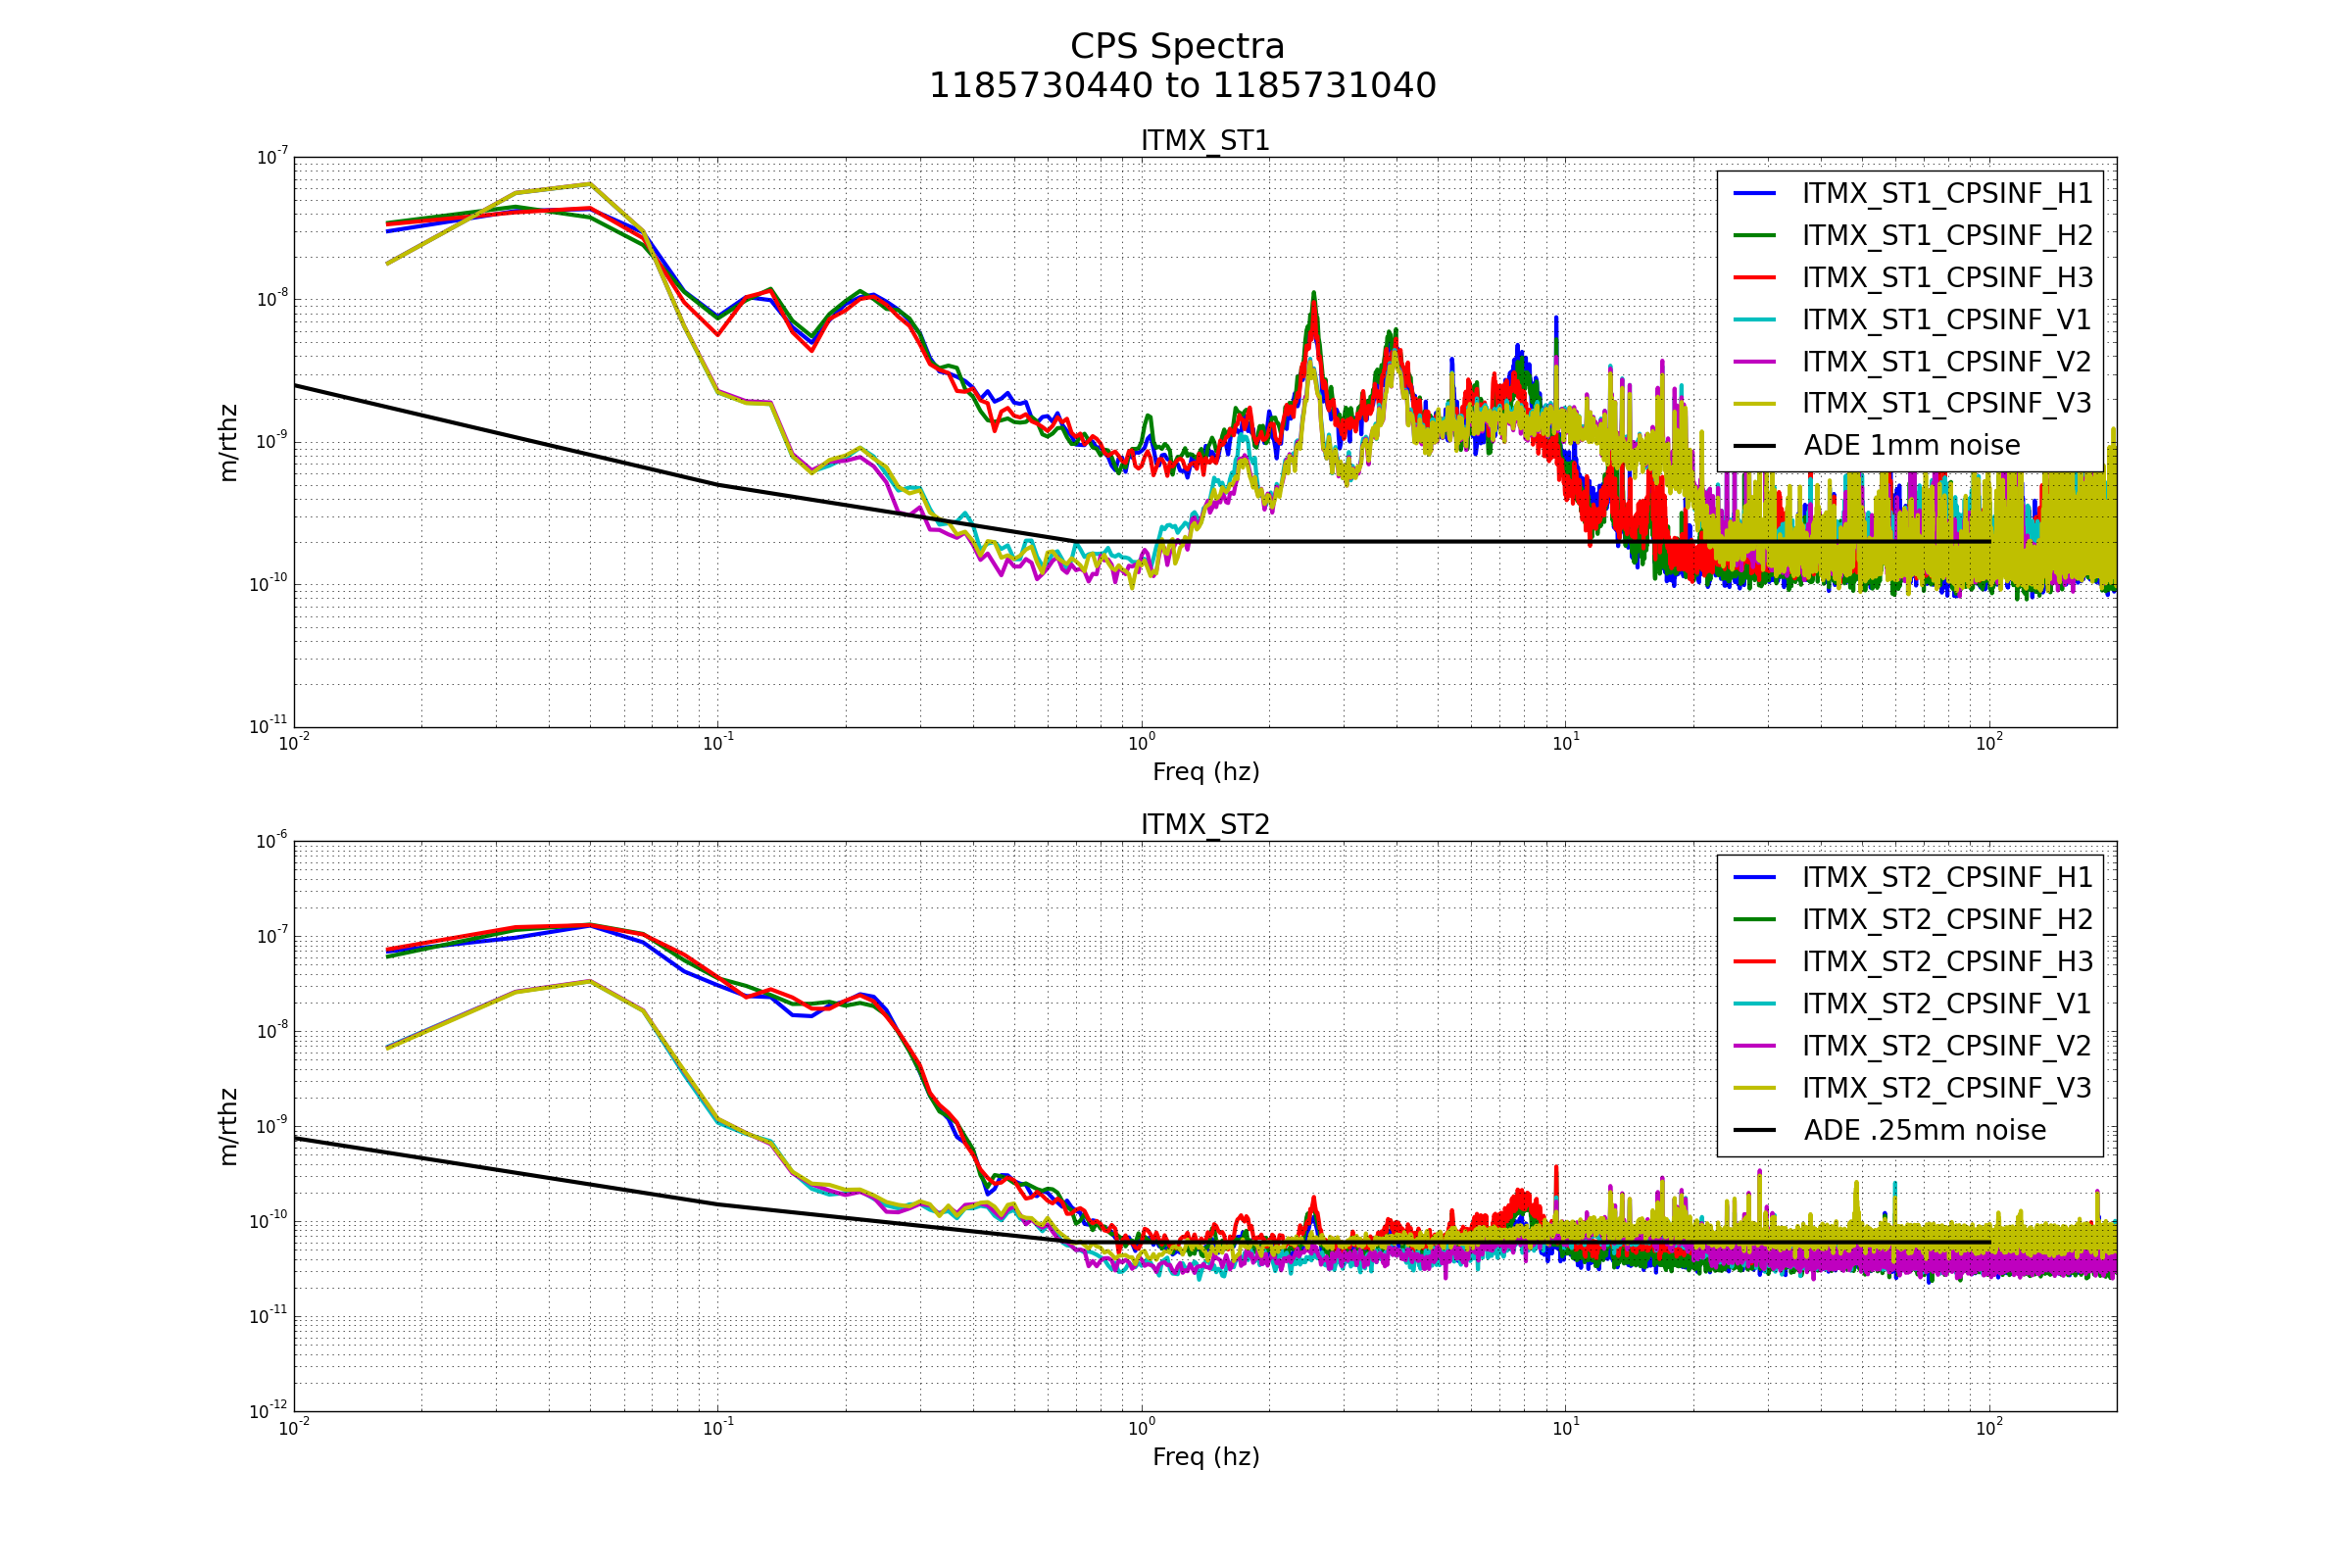
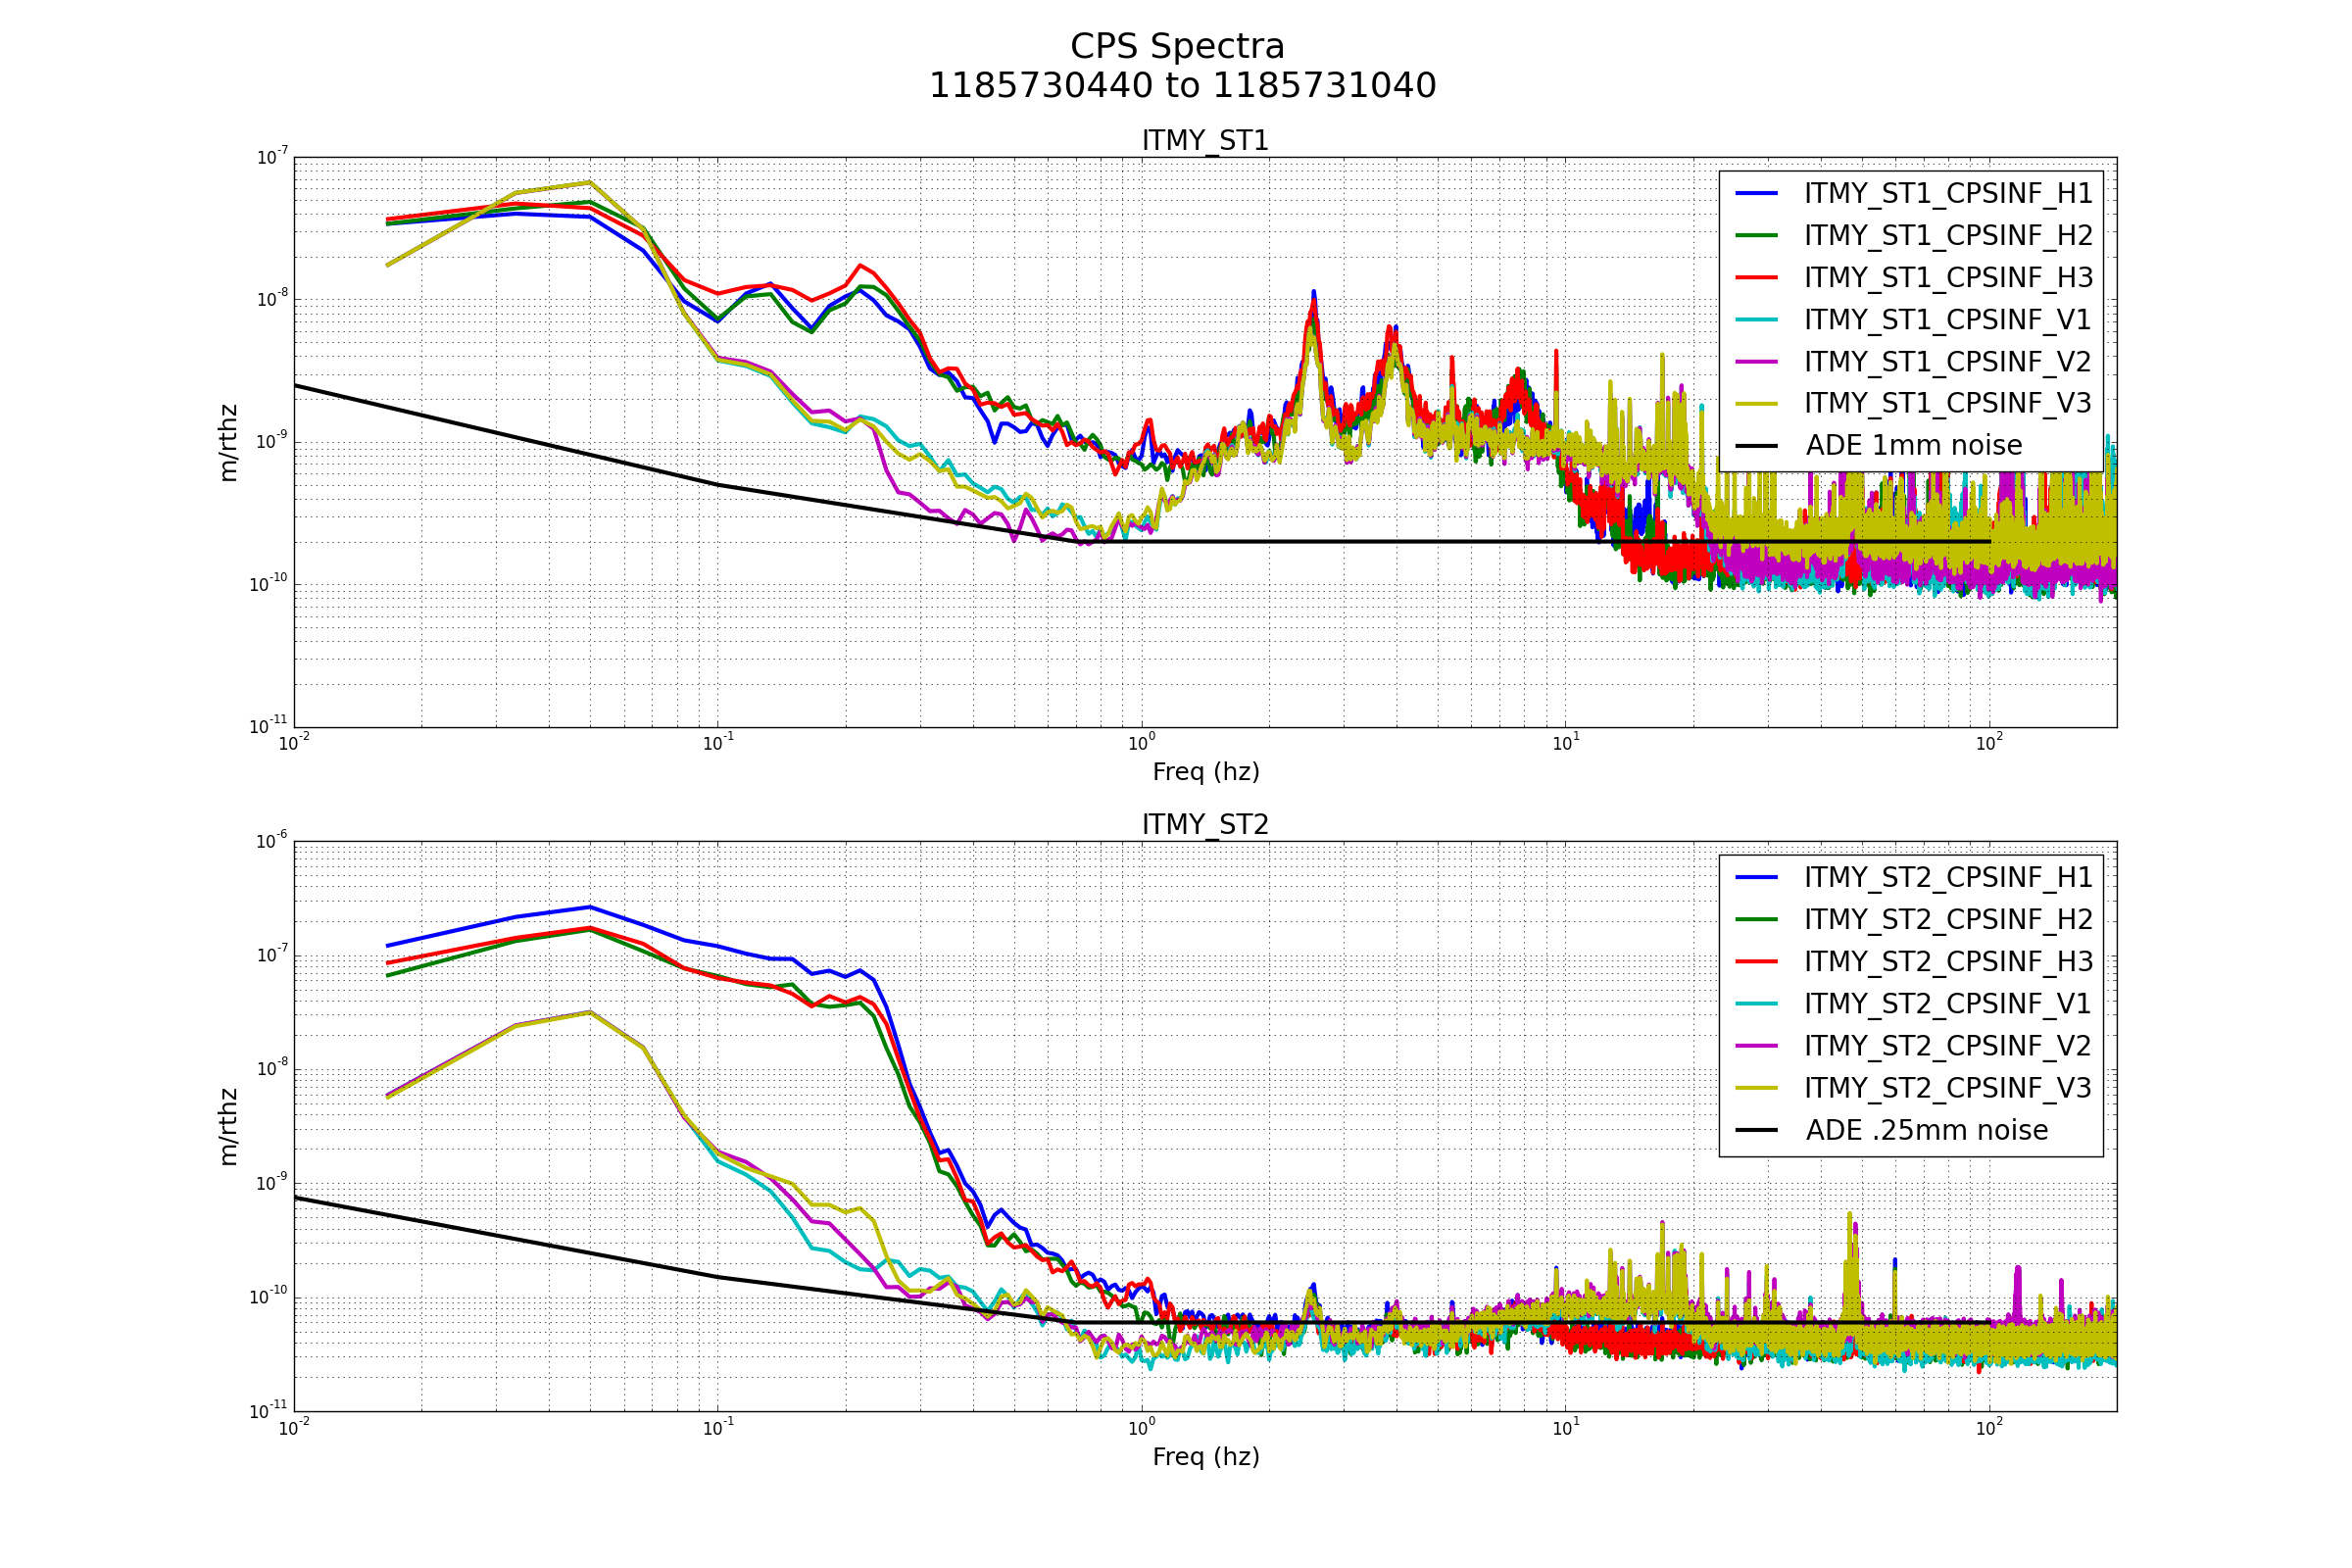
FAMIS 6909

HAM3 V1 seems elevated.
BS ST1 all DOF seem elevated.
ETMY ST1 H2 seems elevated.
ETMY ST2 V2 seems elevated.
ITMX ST1 all DOF seem elevated.
ITMX ST2 V3 seems elevated.
ITMY ST1 all DOF seem elevated.
Images attached to this report

Comments related to this report
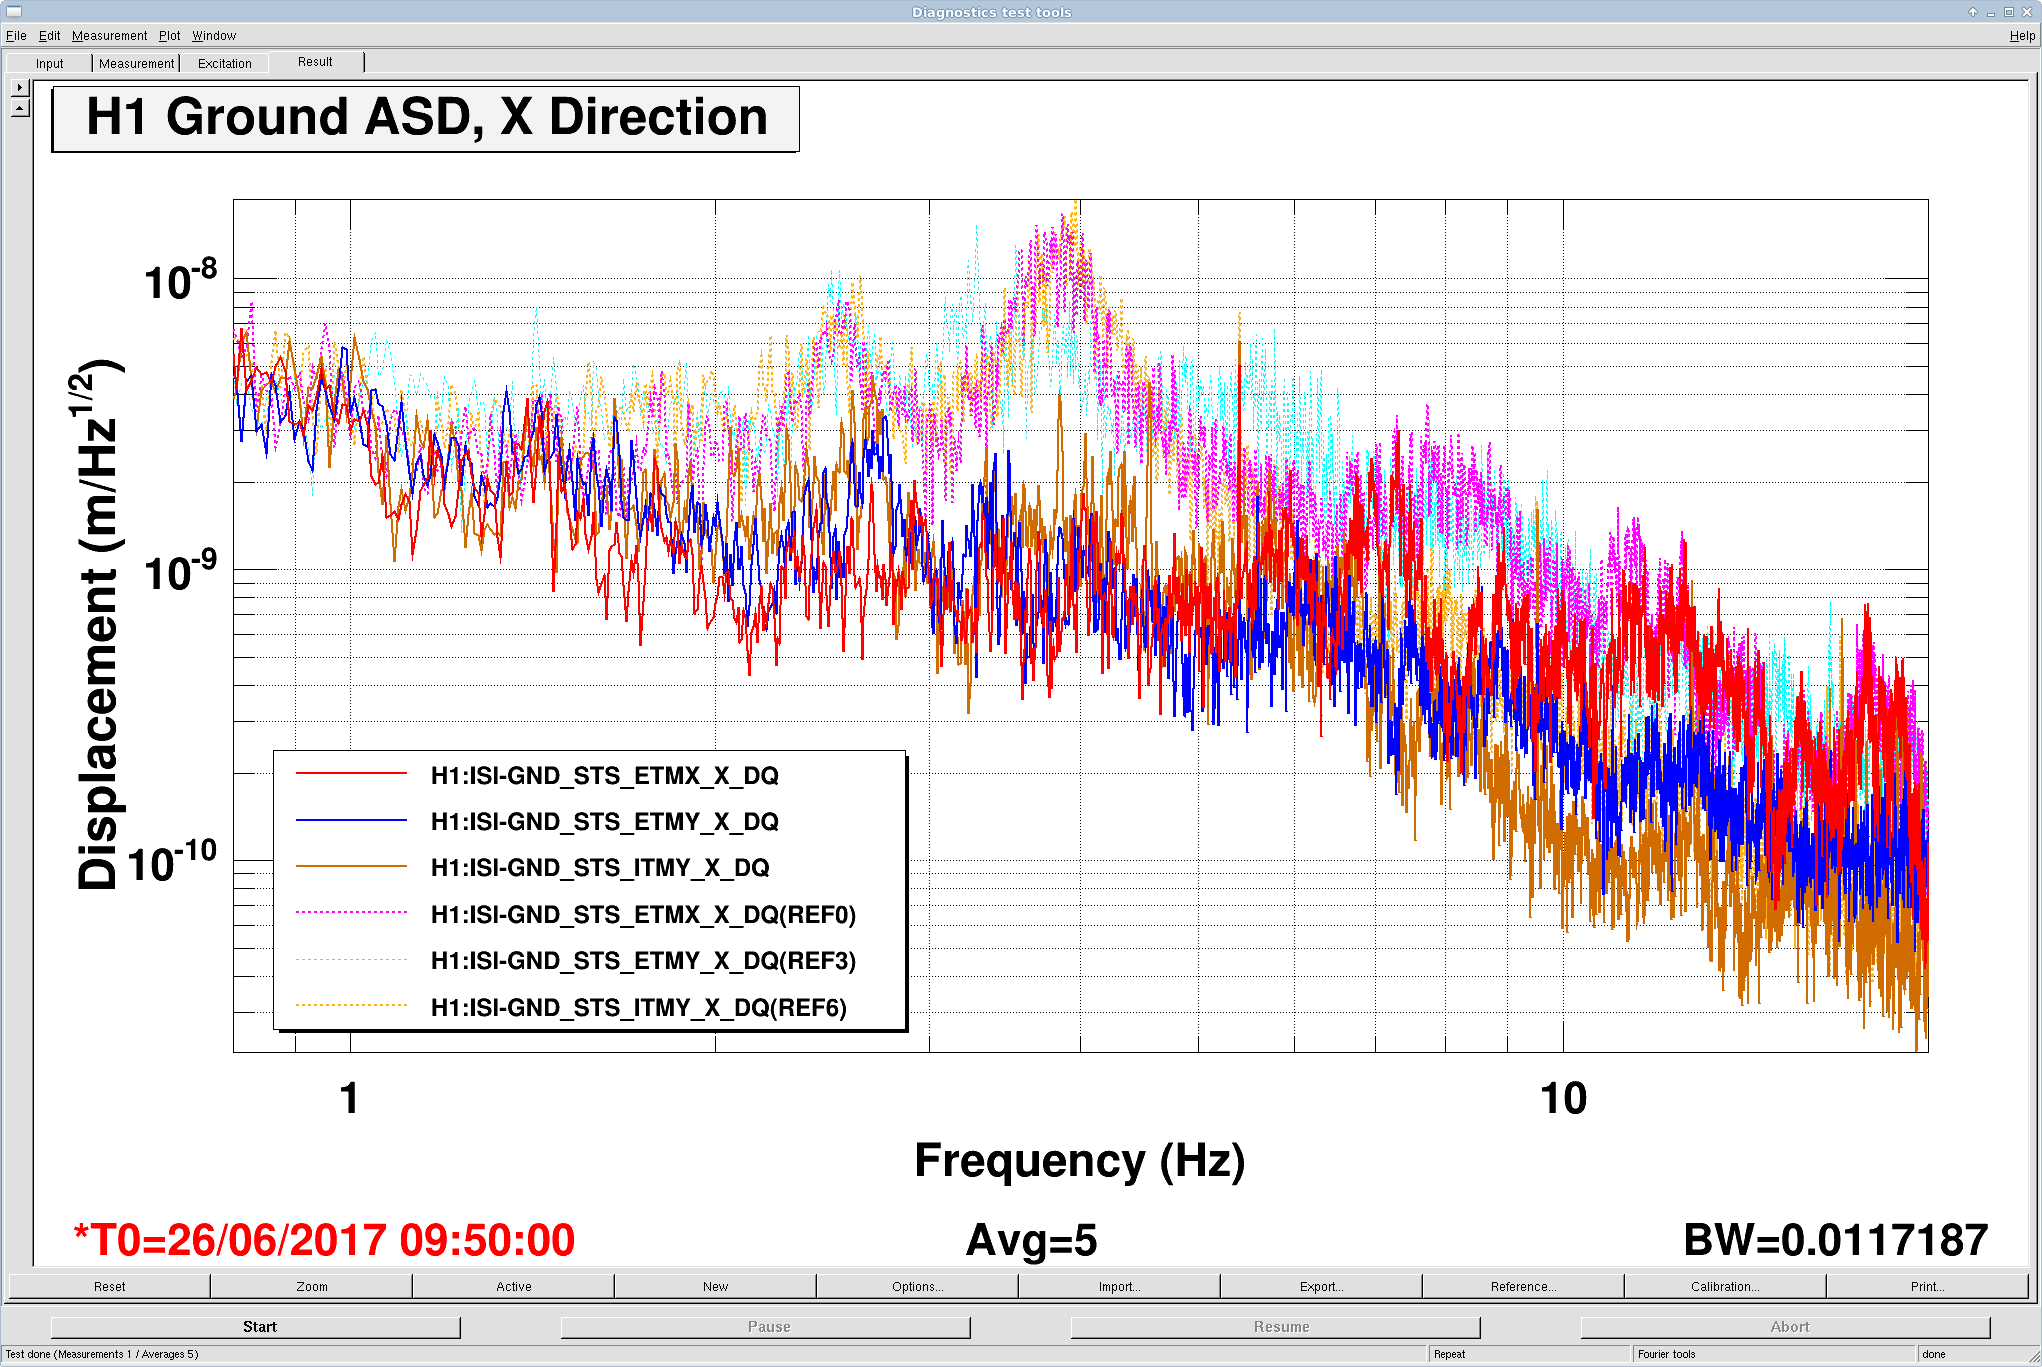
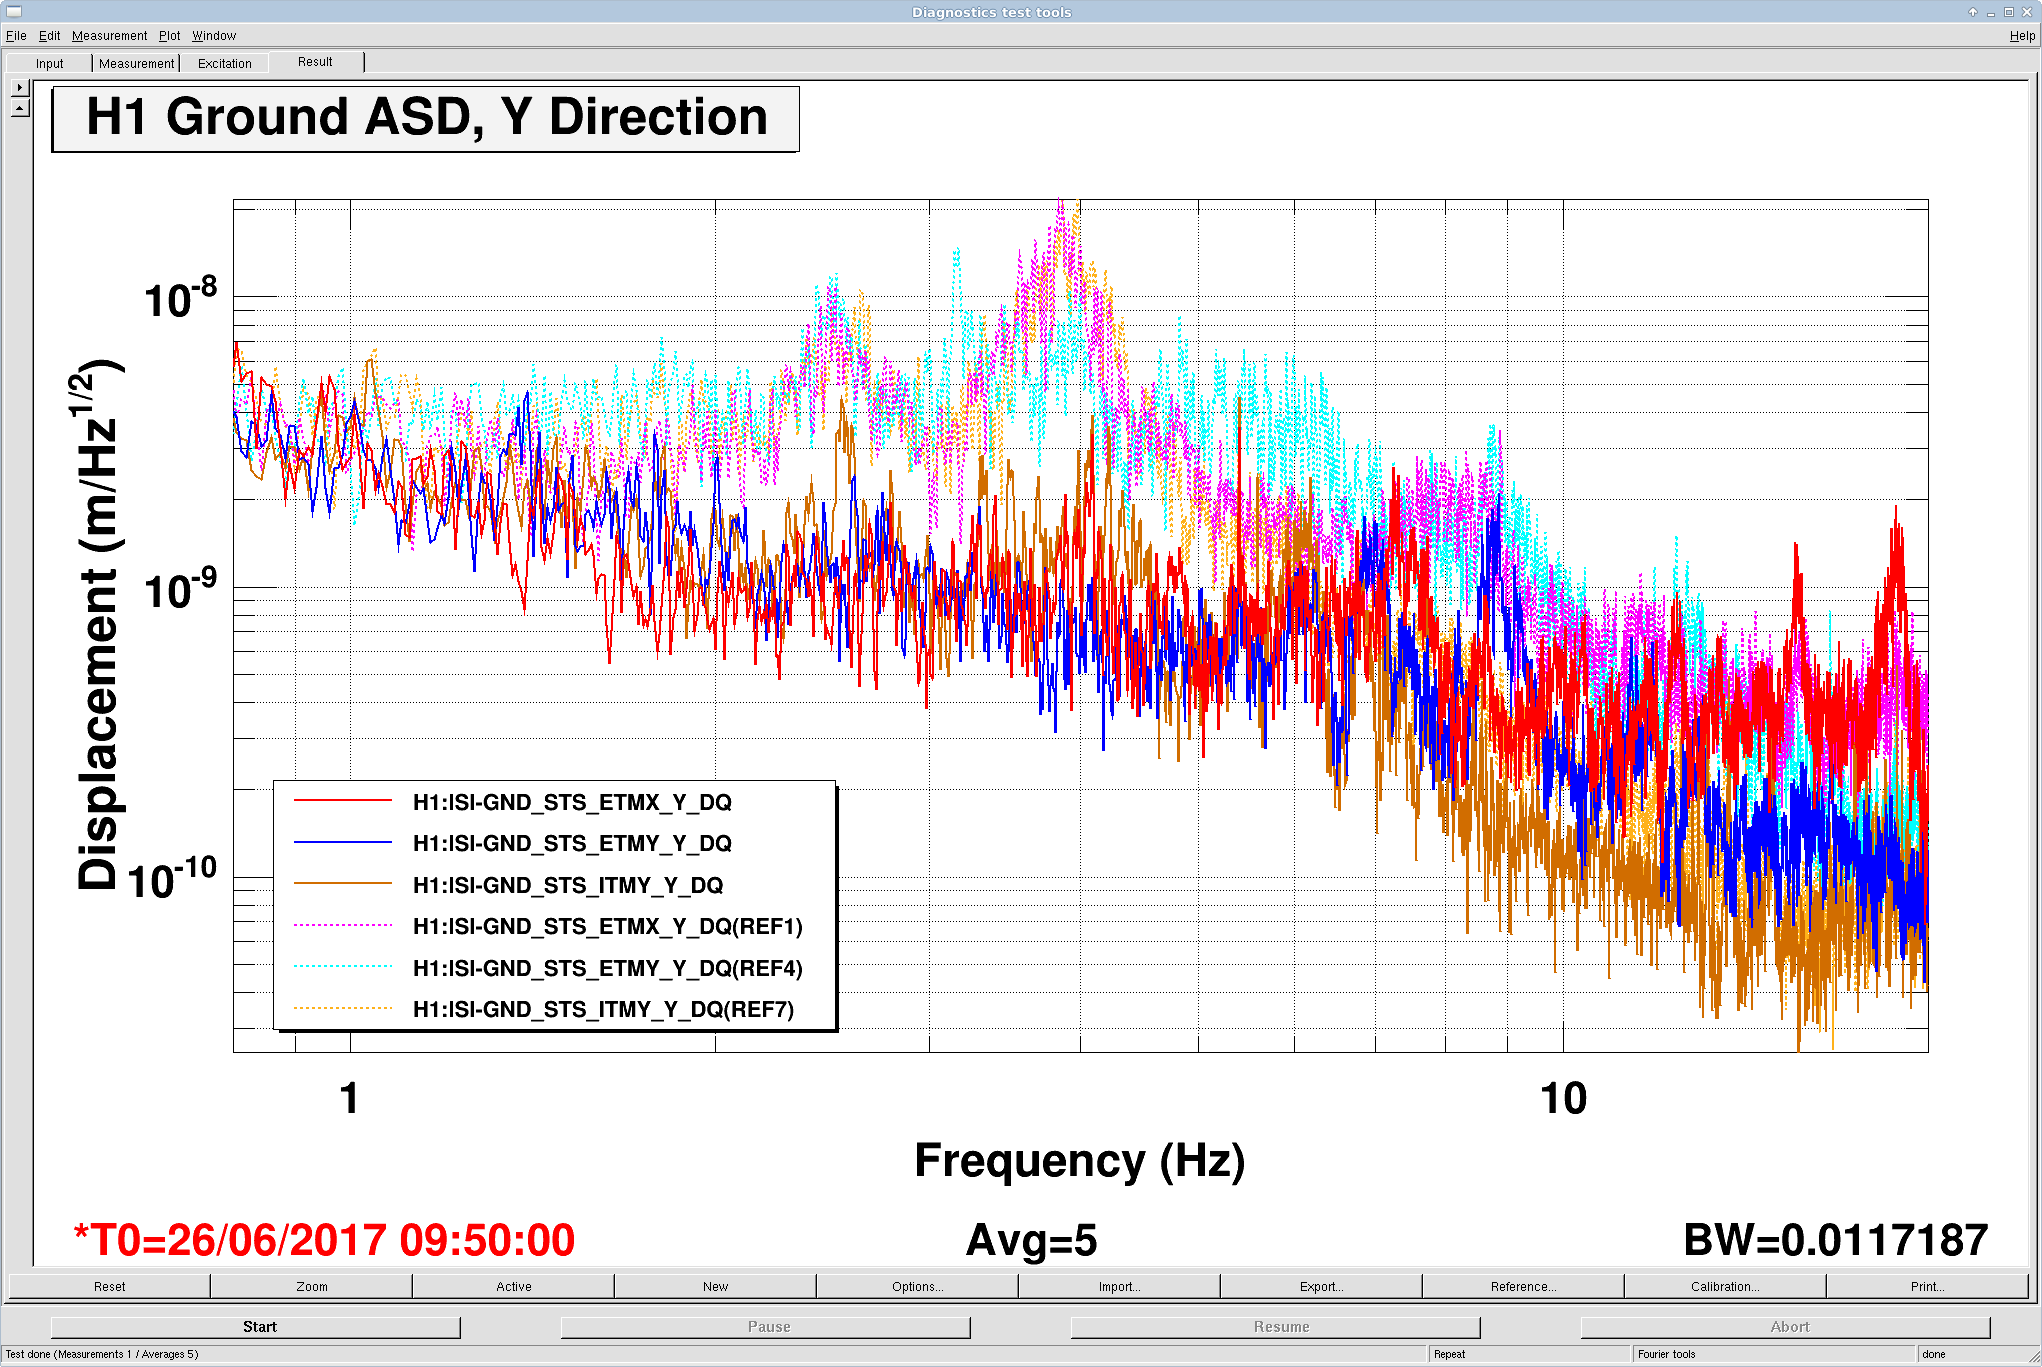
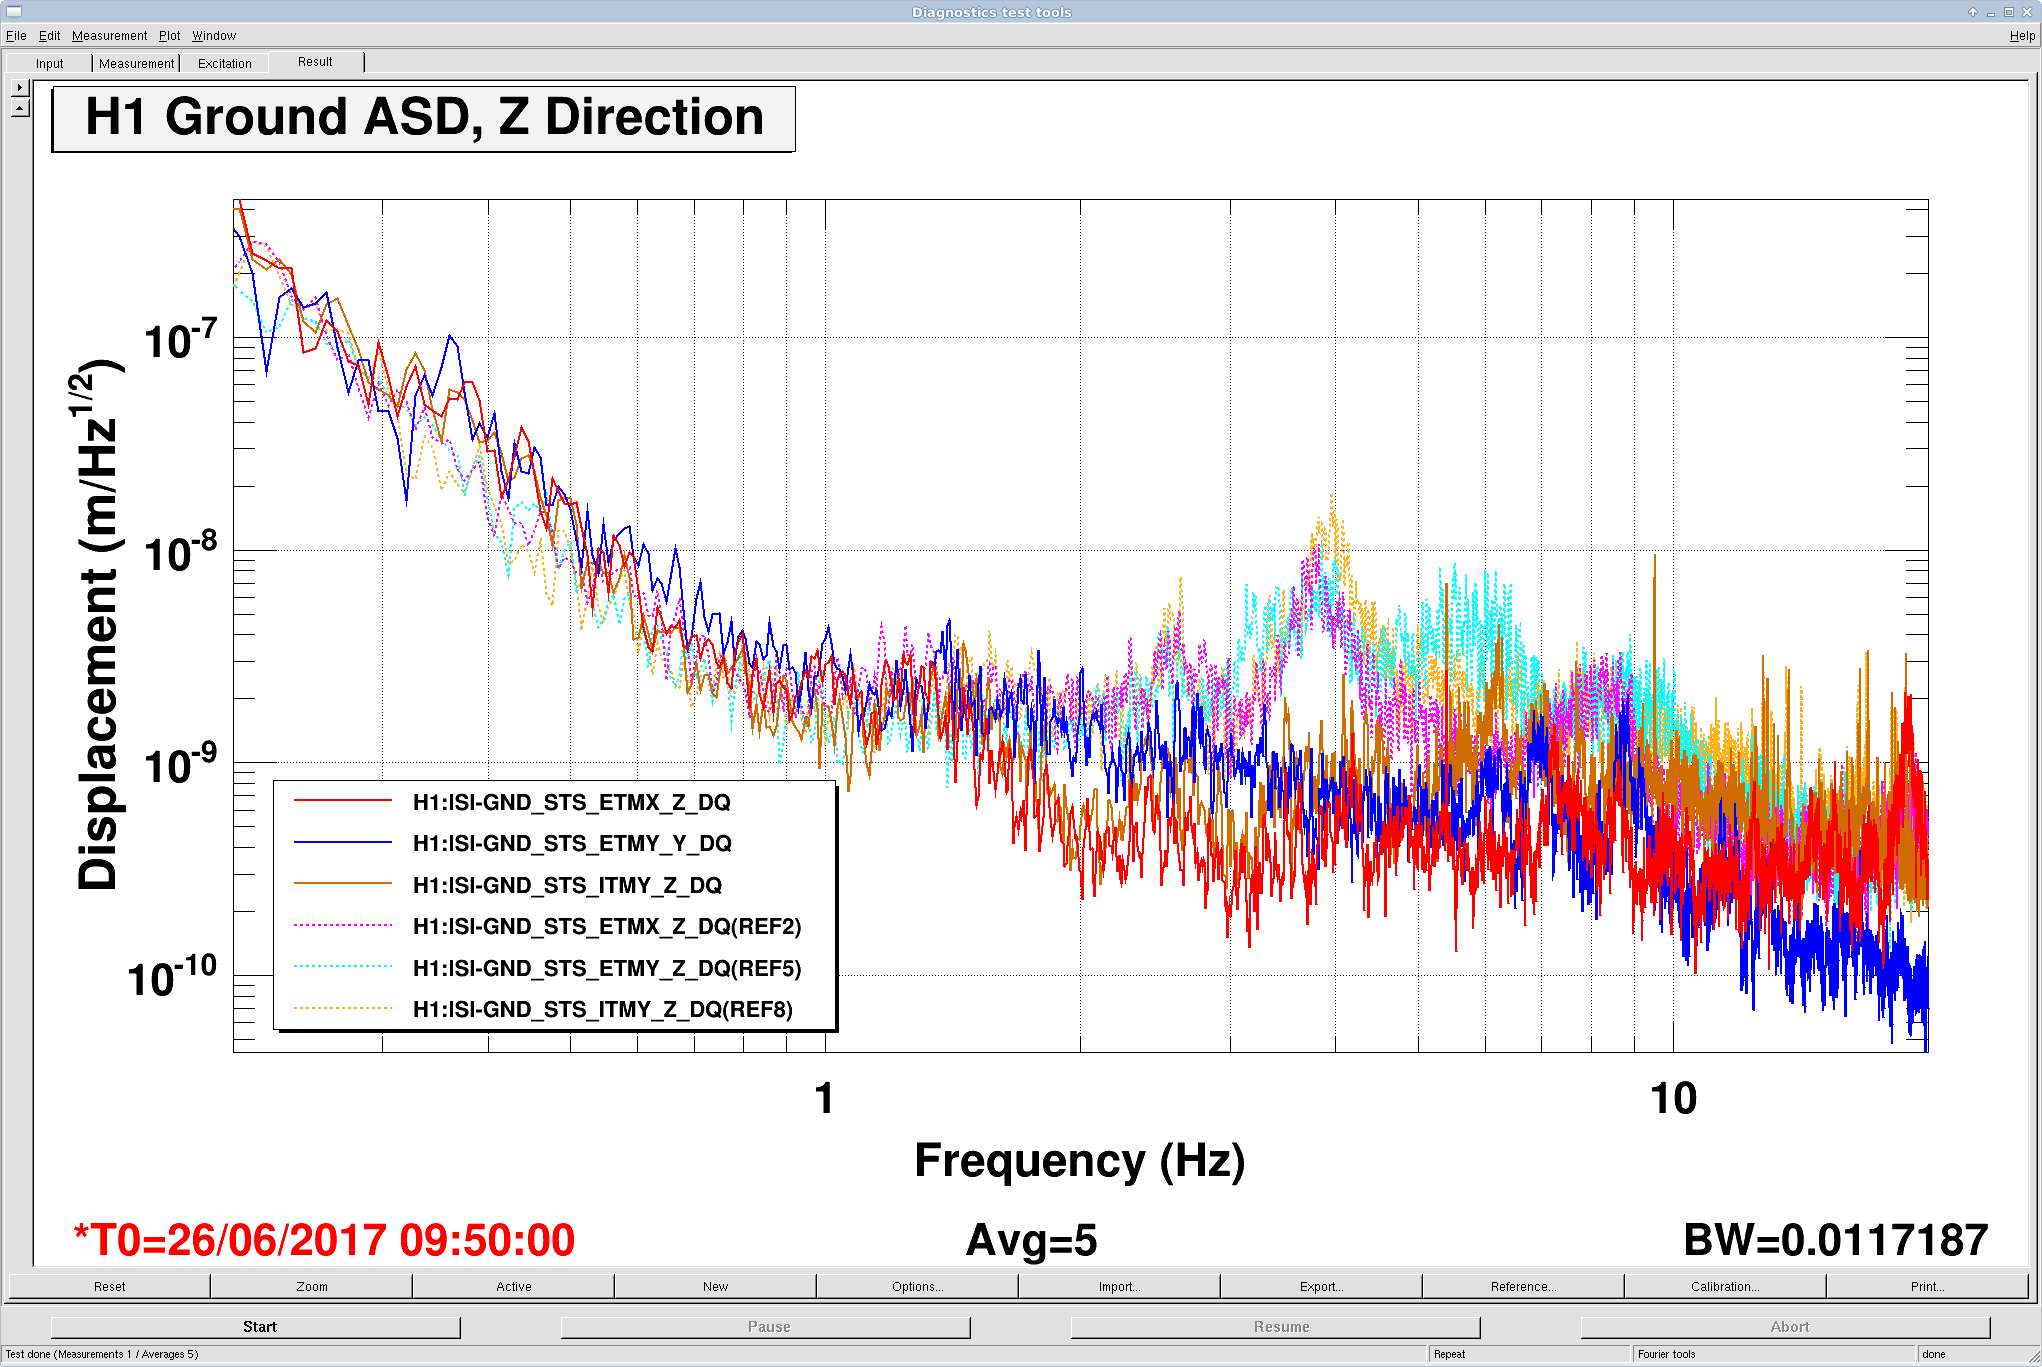
J. Kissel, R. McCarthy

Some investigation on this...
Date         Jun 26 2017                    Aug 02 2017
Time GPS    1182506160 - 1182506760         1185730620 - 1185731220
Time UTC    09:55:42 - 10:05:42             17:36:42 - 17:46:42
Time PDT    02:55:42 - 03:05:42             10:36:42 - 10:46:42

Richard points to data from the Jun 26th FAMIS check, in LHO aLOG 37138, worried that this might be exposing something wrong after the July 6th Montana EQ.

- I've trended the global seismic configuration, and we were in "WINDY" at both these times, so this rules out a different configuration of the ST1 controls (i.e. I'd thought it was maybe that we were in a higher blend filter, or sensor correction for the site was off or something.)
- The summary pages don't show a difference between the ST2 / Suspension Point performance on these two days, which means whatever excess that ST1 is seeing is controlled below the sensor noise of ST2 GS13s, which is good. (Not summary pages are a media spectra for the entire UTC day, not just for these 10 minute periods used for this FAMIS test).
- Then I realized there should be a large difference in the 1-3, 3-10 Hz input ground motion, just due to the difference between 3am local and 10am local anthropogenic activity.

I attach spectra comparing ground motion (as measured by the STSs on the ground in all VEAs), and they agree with what's shown in the ST1 CPS -- in the 0.8 to 20 Hz region, there are features that show roughly an order of magnitude more motion in all buildings comparing the Jun 26th time and Aug 02 time. This is not at all indicative of anything wrong.
(Aug 02 is the reference, Jun 26 is the non-reference data).


We should standardize at what time of day we use to gather data for inspection in this FAMIS task.
The test was designed to look for elevation in the *sensor noise* of the ISI's capacitive position sensors, indicative of problems we've seen with the electronics -- i.e. the flat, above 10 Hz, featureless part of the spectra will be elevated above the black line if there's badness.
There will likely *always* be feature-full, residual seismic motion that's visible in these spectra that can be different from test-to-test, especially on stage 1 in the 1-30 Hz range because ST1 does not isolate this region (that job is left for stage 2 / ST2).
One can't necessarily *know* that the feature-full full stuff is "real" residual seismic data, but this test is designed for you to ignore that stuff, and focus on the high frequency flat portion of the spectra.
Standardizing that we take the data in the middle of the night, local time, when there is less 1-30 Hz input ground motion (since most people are asleep), means the platform will be moving less, and expose more CPS sensor noise, and this'll be a more focused test.
Images attached to this comment
I've updated both HAM and BSC python scripts to look at 2 am local using gpstime.tconvert('2am today') . I've also left code in, commented out, so that the measurement time can be specified in the terminal. It would be nice to have some easier to find or use documentation for some of these libraries. I knew there was tconvert python stuff, but had no idea where to find how to use it.