Message: Our current charge measurement (Veff) doesn't tell us everything we want to know about how much charge is on the optics, or do a good job of predicting noise in DARM caused by electrostatics. Here is a way of measuring the ESD actuation strength that could give us a slightly more complete picture of what is happening. These measurements still don't give us a conclusive charge measurement that we can rely on to understand the DARM noise.
Motivation:
In an effort to track the charging of our optics, we have been measuring and tracking the bias voltage at which our ESD actuation strength is minimized for a few years (38604) , but we have some clues that this measurement gives us incomplete information about the charge that creates noise in DARM. After the July EQ, we saw a large increase in the noise in DARM. There was also a change in the charge measurements, but not a significant increase in Veff (38401). However, discharging the end test masses partially reduced the noise in DARM, and reduced Veff. We also saw coupling from the ETMX and ITMY ISIs to DARM, which made noise that was well below the limiting DARM noise. Discharging fixed this coupling for ETMX.
New measurements:
Over the last few weeks I've been thinking about ways we could measure other parameters that depend on the test mass charge. Four coefficients (alpha, beta, beta2, and gamma) that describe the ESD actuation, their measurements and calibration are described in T1700446. Scripts for making these measurements and the log files for the measurements plotted here are in the userapps repository, at /userapps/sus/common/scripts/quad/InLockChargeMeasurements (revision 16175). These measurements take about 10 minutes to complete for all 4 test masses when we are in low noise. I suggest that after this vent we repeat this measurement in a way similar to the optical lever charge measurements for tracking the charges on the optics.
Calibration:
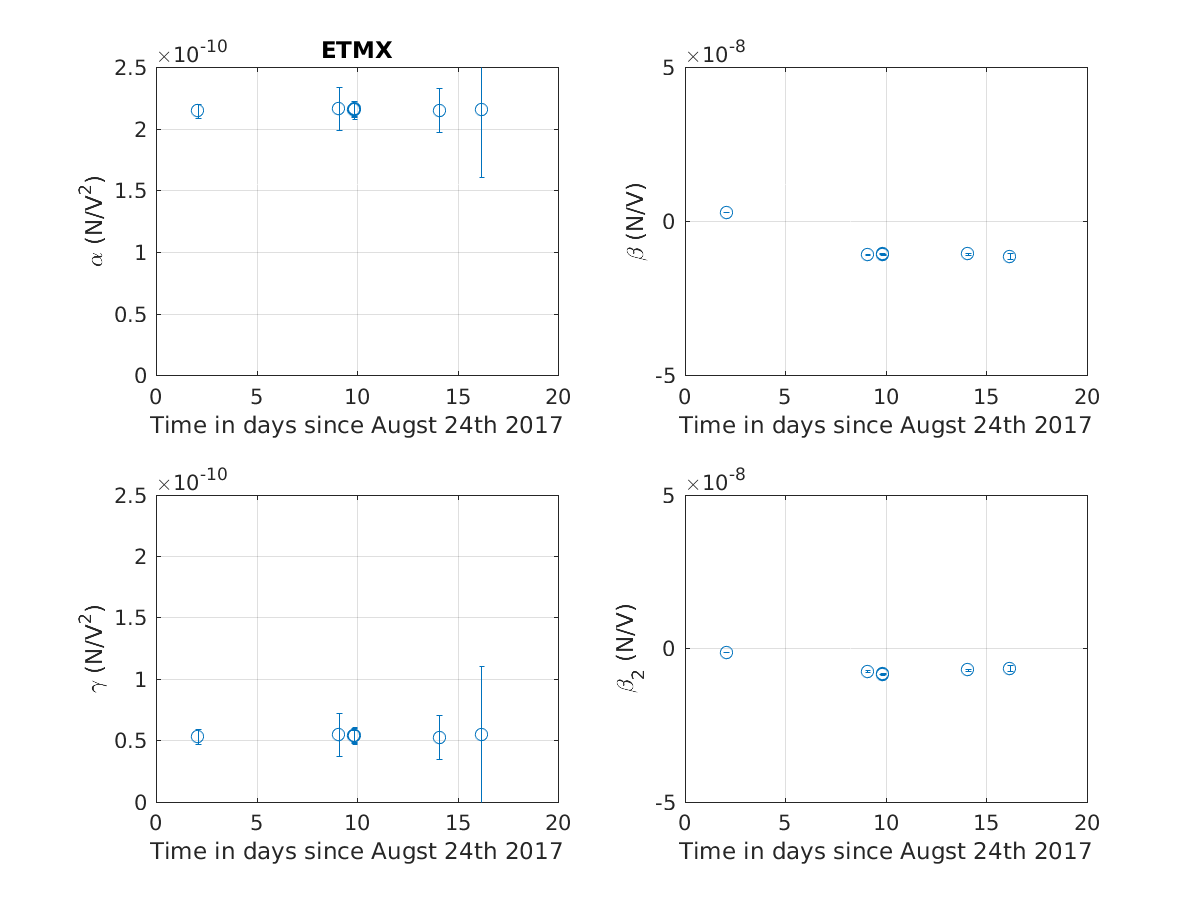
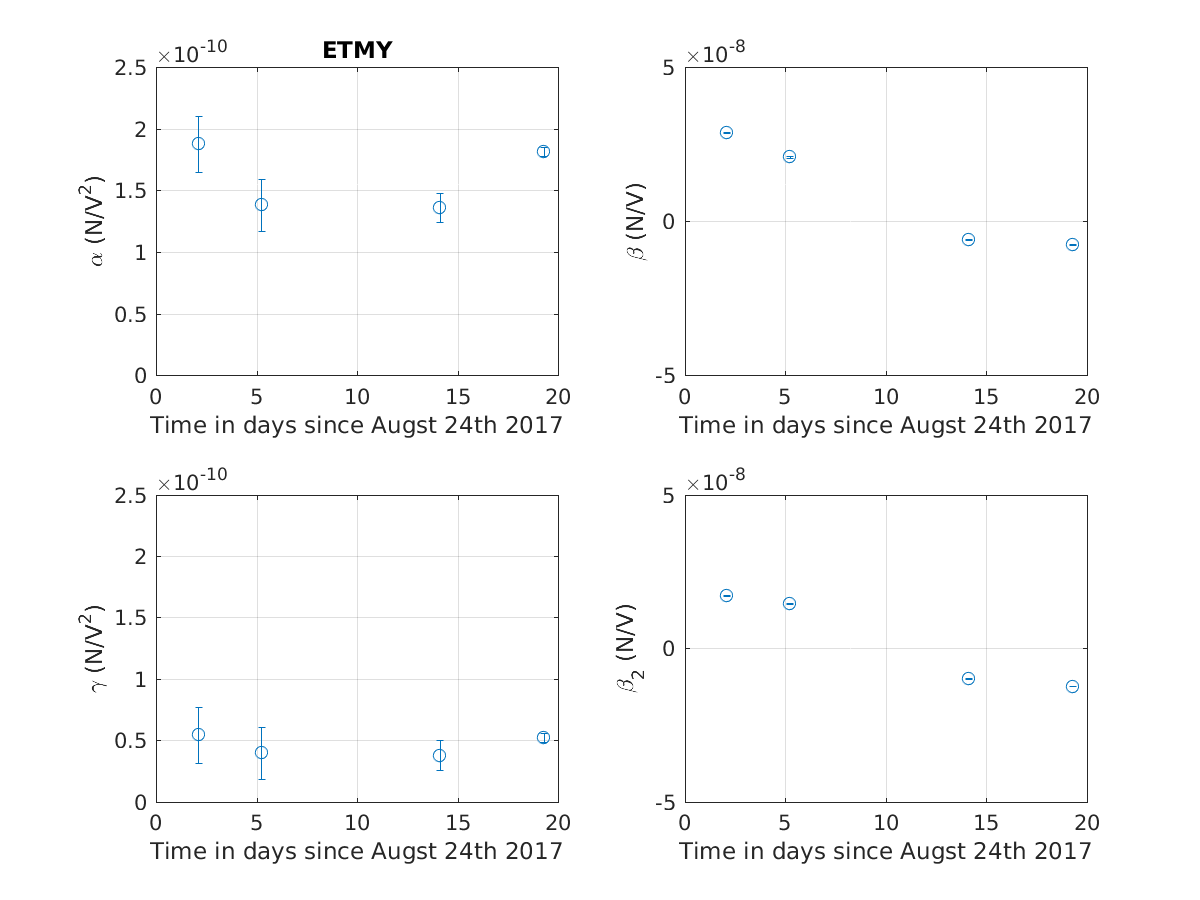
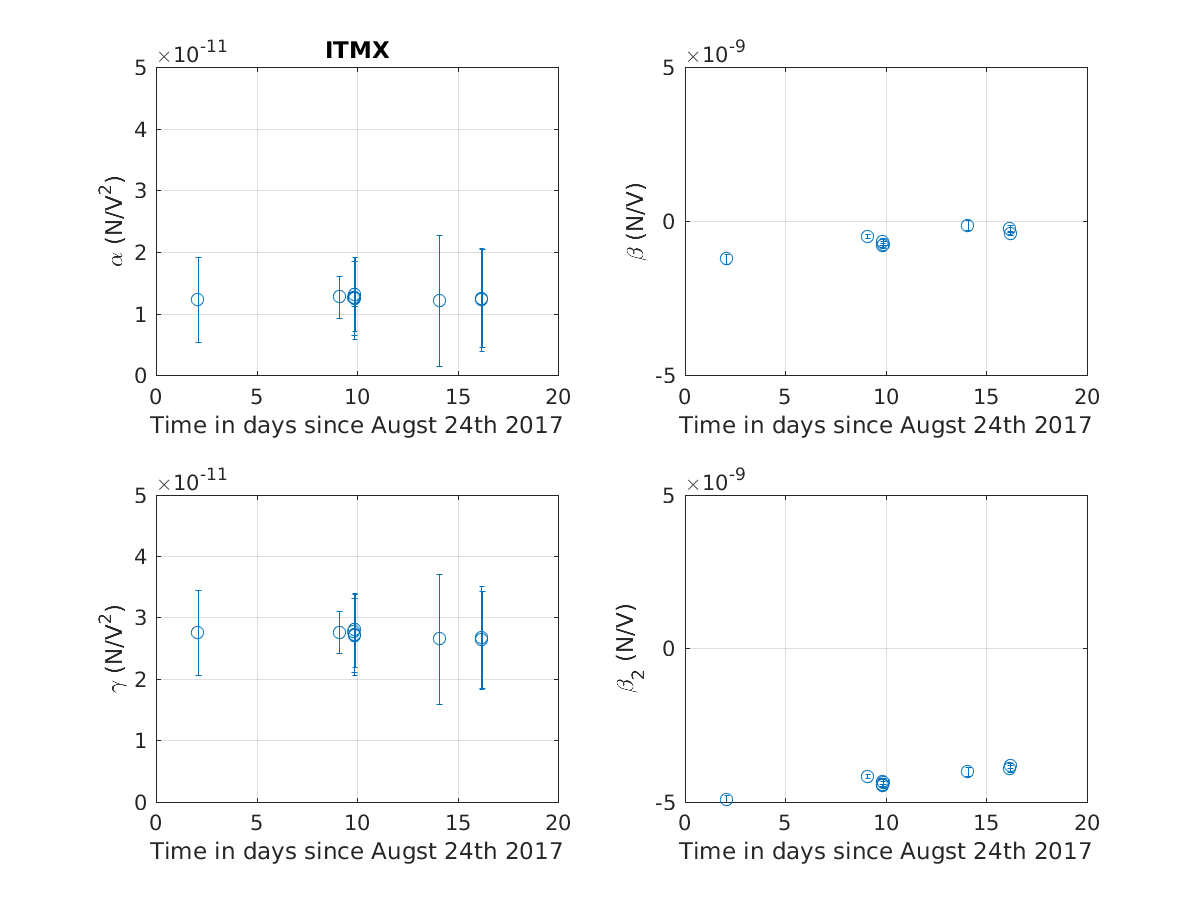
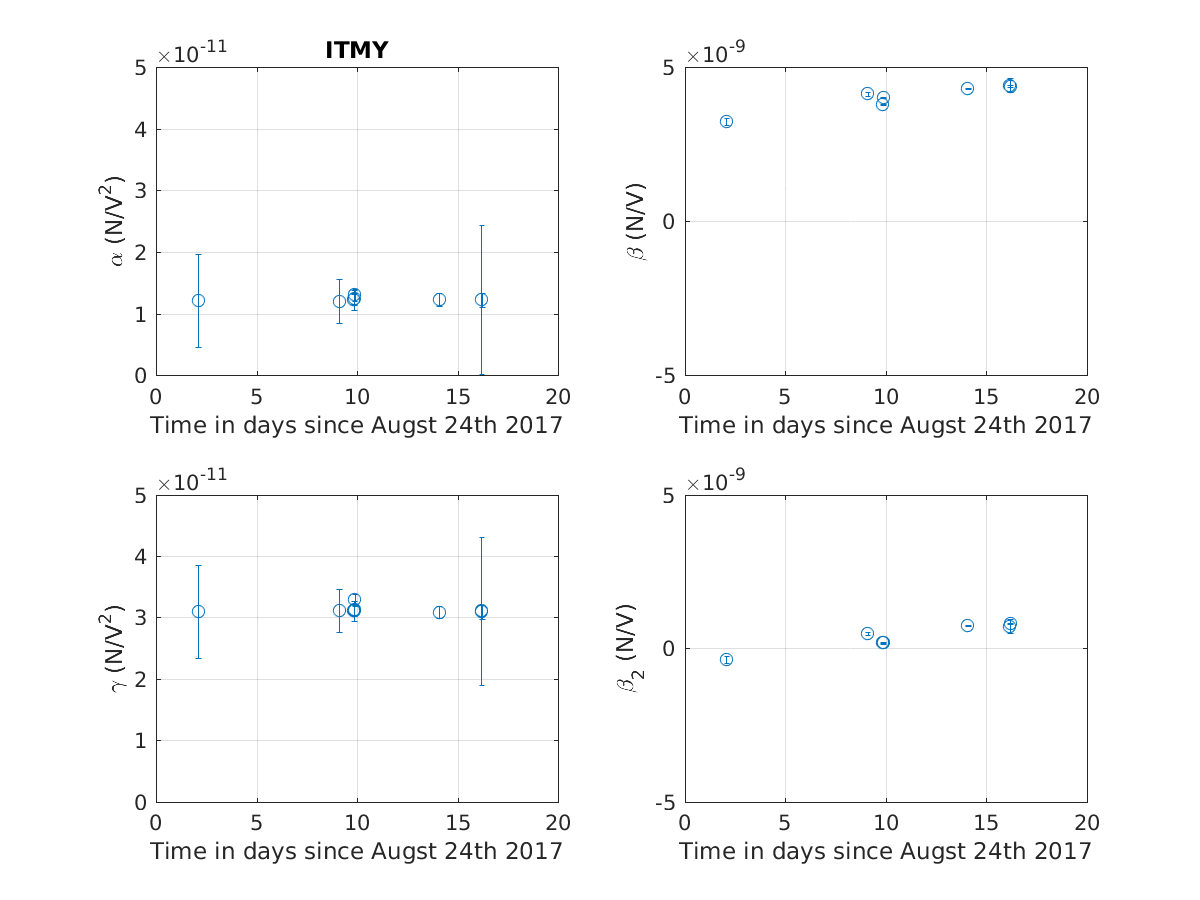
The attached screenshots show the results of these measurements of the 4 coefficients, with error bars based on statistical uncertainty (the coherence of DARM with the excitation). I used two different methods to calibrate the measurements, first calibrating the DAC outputs then using the monitor inputs (where the correct monitors are in the frames, FRS ticket 8995 is in part going to make sure that all the correct monitors are stored). The applied bias voltage I end up with is about 13% lower if I use the DAC outputs (380V) compared to the result I get using the monitor channels (430V), which results in about a 22% discrepancy in the values of alpha and gamma (coefficients that describe the quadratic ESD response). I am using the ESD monitors, since they are consistent with the high voltage that is supplied, and the calibration of the monitors is simpler (especially for the ETM HV divers where the schematics are hard to follow).
Results:
For the ETMs, alpha is around 2e-10 N/V^2, while according to G1100968 it should be 4e-10N/V^2. For ETMY the measurements are inconsistent; alpha and gamma should be unchanged by the discharging. I looked at the L2 L witness sensors to see if differences in the distance between the reaction mass and test mass could explain these discrepancies, it doesn't. For the ITMs, alpha is around 1.2e-11N/V^2; a little higher than the value of 7.5e-12 N/V^2 in G1100968.
The gamma term describes the dielectric force caused by fields which terminate on the conductors surrounding the optic (the cage). This should also be independent of charge, and I'm not aware of any FEM models that predict the size of this term. The coefficients are similar for the ITMs (3e-11N/V^2 for ITMY, 2.7e-11 N/V^2 for ITMX) and ETMs (5.4e-11N/V^2 for ETMX, varying between 4-5e-11 N/V^2 for ETMY). This means that for the ITMs, the forces caused by the field lines that terminate on the suspension cage actually dominate the overall actuation strength of the ESD, not the field lines which begin and terminate on the ESD electrodes.
The beta and beta2 terms are due to the interaction of two different distributions of charge on the optic with the fields from the ESD electrodes. The TMDS at EX was used at days 5+6 on this plot (3 cycles) while it was used for one cycle at EY on day 11. It is surprising that the betas at EX seem to have increased after the discharge, there is only one measurement from before the discharging. I looked back at the data and indeed, the response to driving the electrodes without any bias applied was smaller before the discharging than after. It should be possible to estimate charge densities based on these betas.
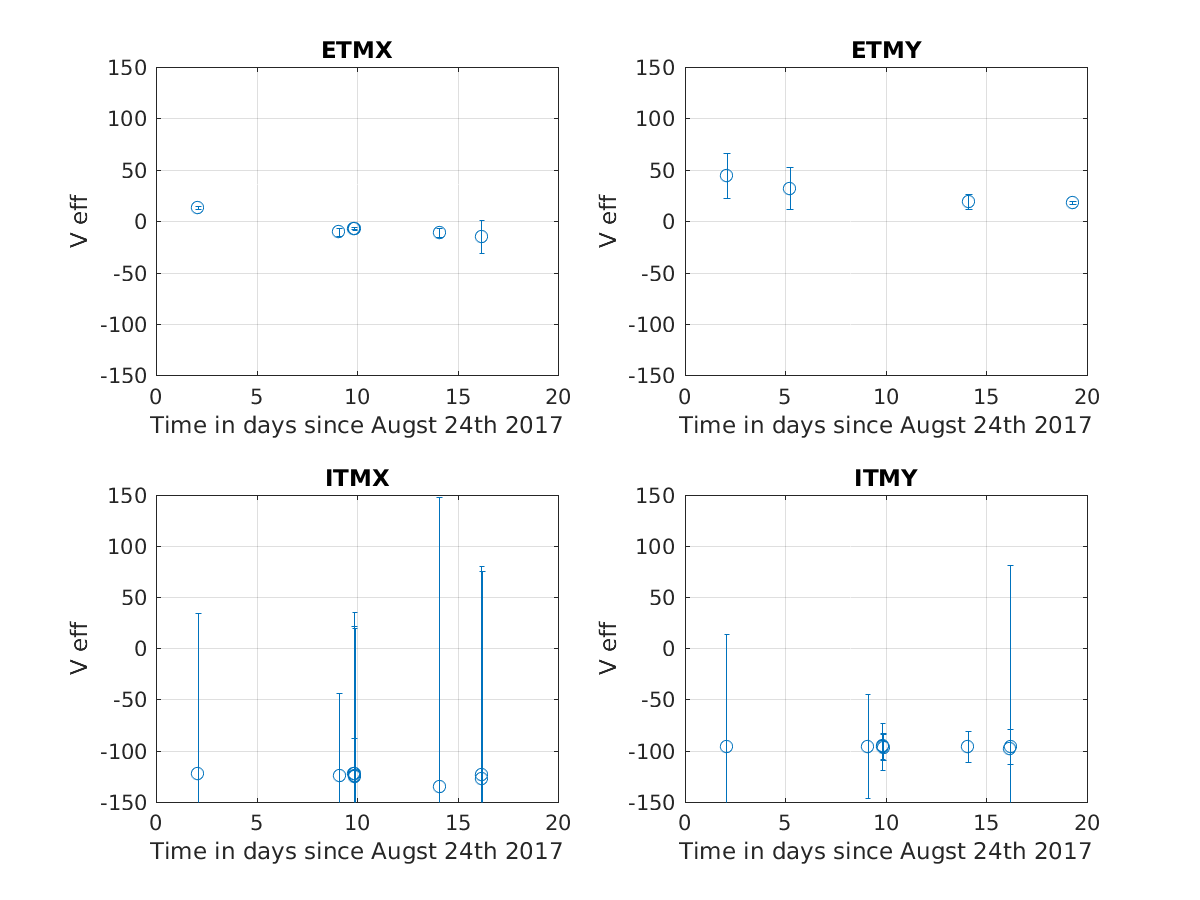
Comparing these measurements to Veff:
In terms of the coefficients measured here, the usual charge measurement measures the bias at which the signal response is minimized, V_eff = (beta-beta2)/2*(alpha-gamma). The fifth attachment here shows Veff calculated from the measured coefficients, this matches pretty well with the results I got from making a longitudinal measurement of Veff in alog 38608 (In that alog I was reporting bias voltages based on the DAC outputs, so they should be about 13% smaller than what is here, which is based on ESDAMON. These ETMY numbers are rather different from the Veff measured using the optical lever in alog 38604
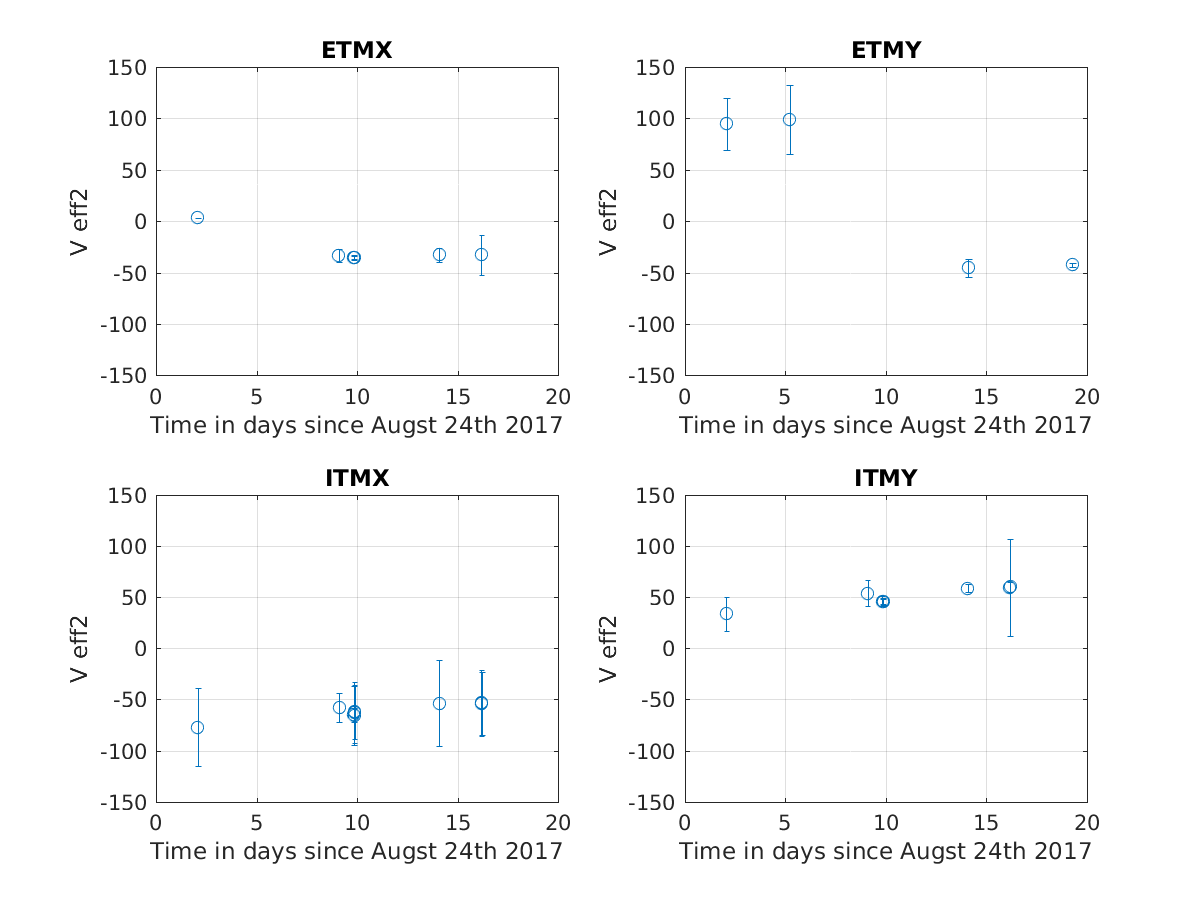
A new Veff2:
If instead of driving the signal electrode and finding the bias voltage that minimizes the response, we can do the same measurement by driving the bias electrode and finding the bias voltage that minimizes that response. This is just a different combination of the ESD coefficients, Veff2 = (beta+beta2)/2(alpha+gamma), which is shown in the 6th attachment to this alog. This is also in reasonable agreement with the measurement I made off this Veff in 38608 . This Veff could also be measured with the optical levers.
A somewhat nicer measurement of all 4 of these paramters could be made by driving the signal and bias electrodes in common and differential. We would need to account for the different low pass filters in the analog paths to these electrodes to do the measurement this way.
Shiela, Thank you and Jeff for making these coupling measurements. I have been worrying about this coupling
for a long time. It is one of the reasons we made an injected ion system for each test mass chamber so that
one could imagine a regular rate of discharge (monthly?) once we baffled/moved the ion pumps. The discharge is a
temporary fix. As we improve the detector sensitivity we are going to hit a limit from the charge on the
test mass just from charge hopping. At some point we will simply have to bite the bullet and coat the entire
mass with a mildly conducting (Gohms/sq) coating and "ground" the test mass through a coating on the silica fibers. I thought
the Stanford group is working on this coating.
RW