jeffrey.kissel@LIGO.ORG - posted 18:02, Thursday 15 February 2018 (40562)
H1 SUS ITMX Violin Mode Search At UHV Remains Fruitless
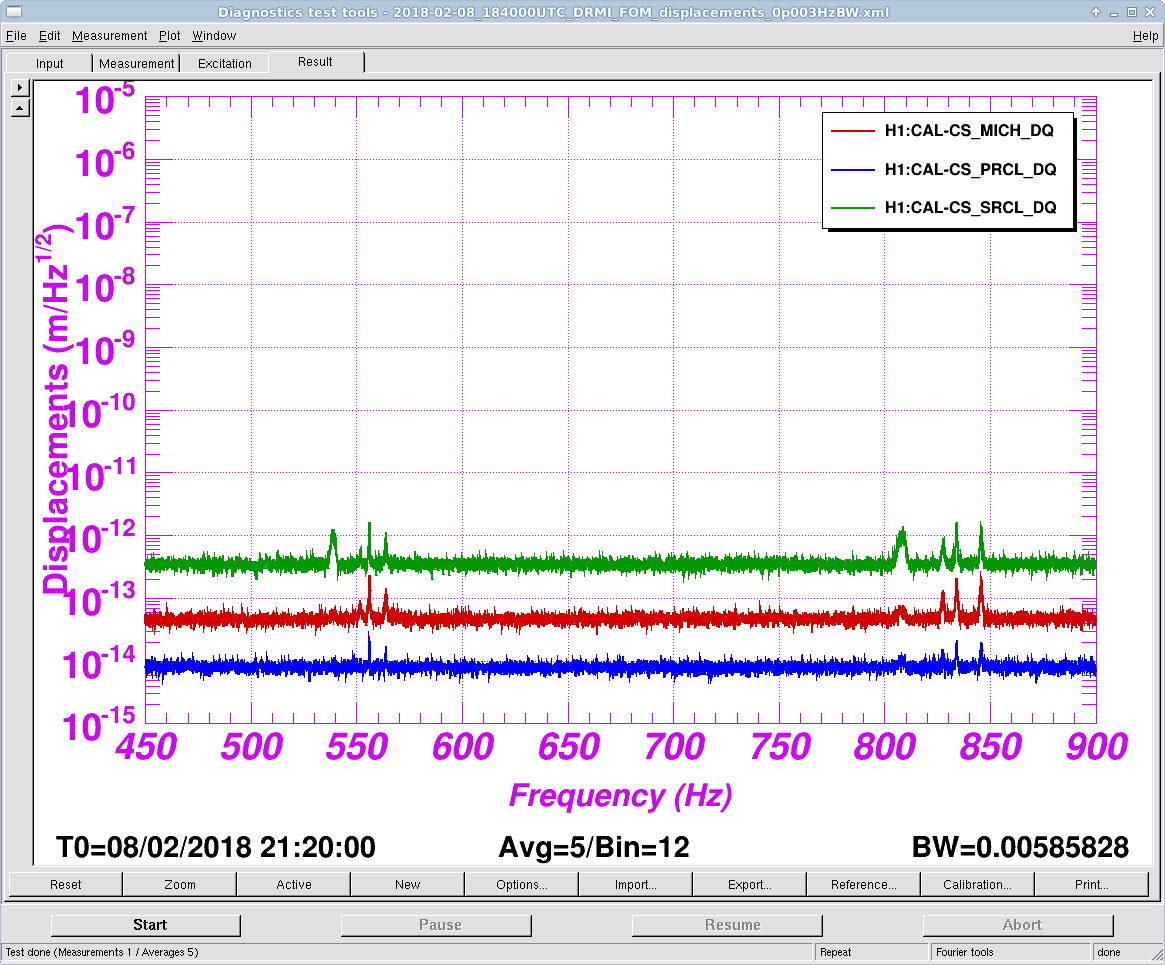
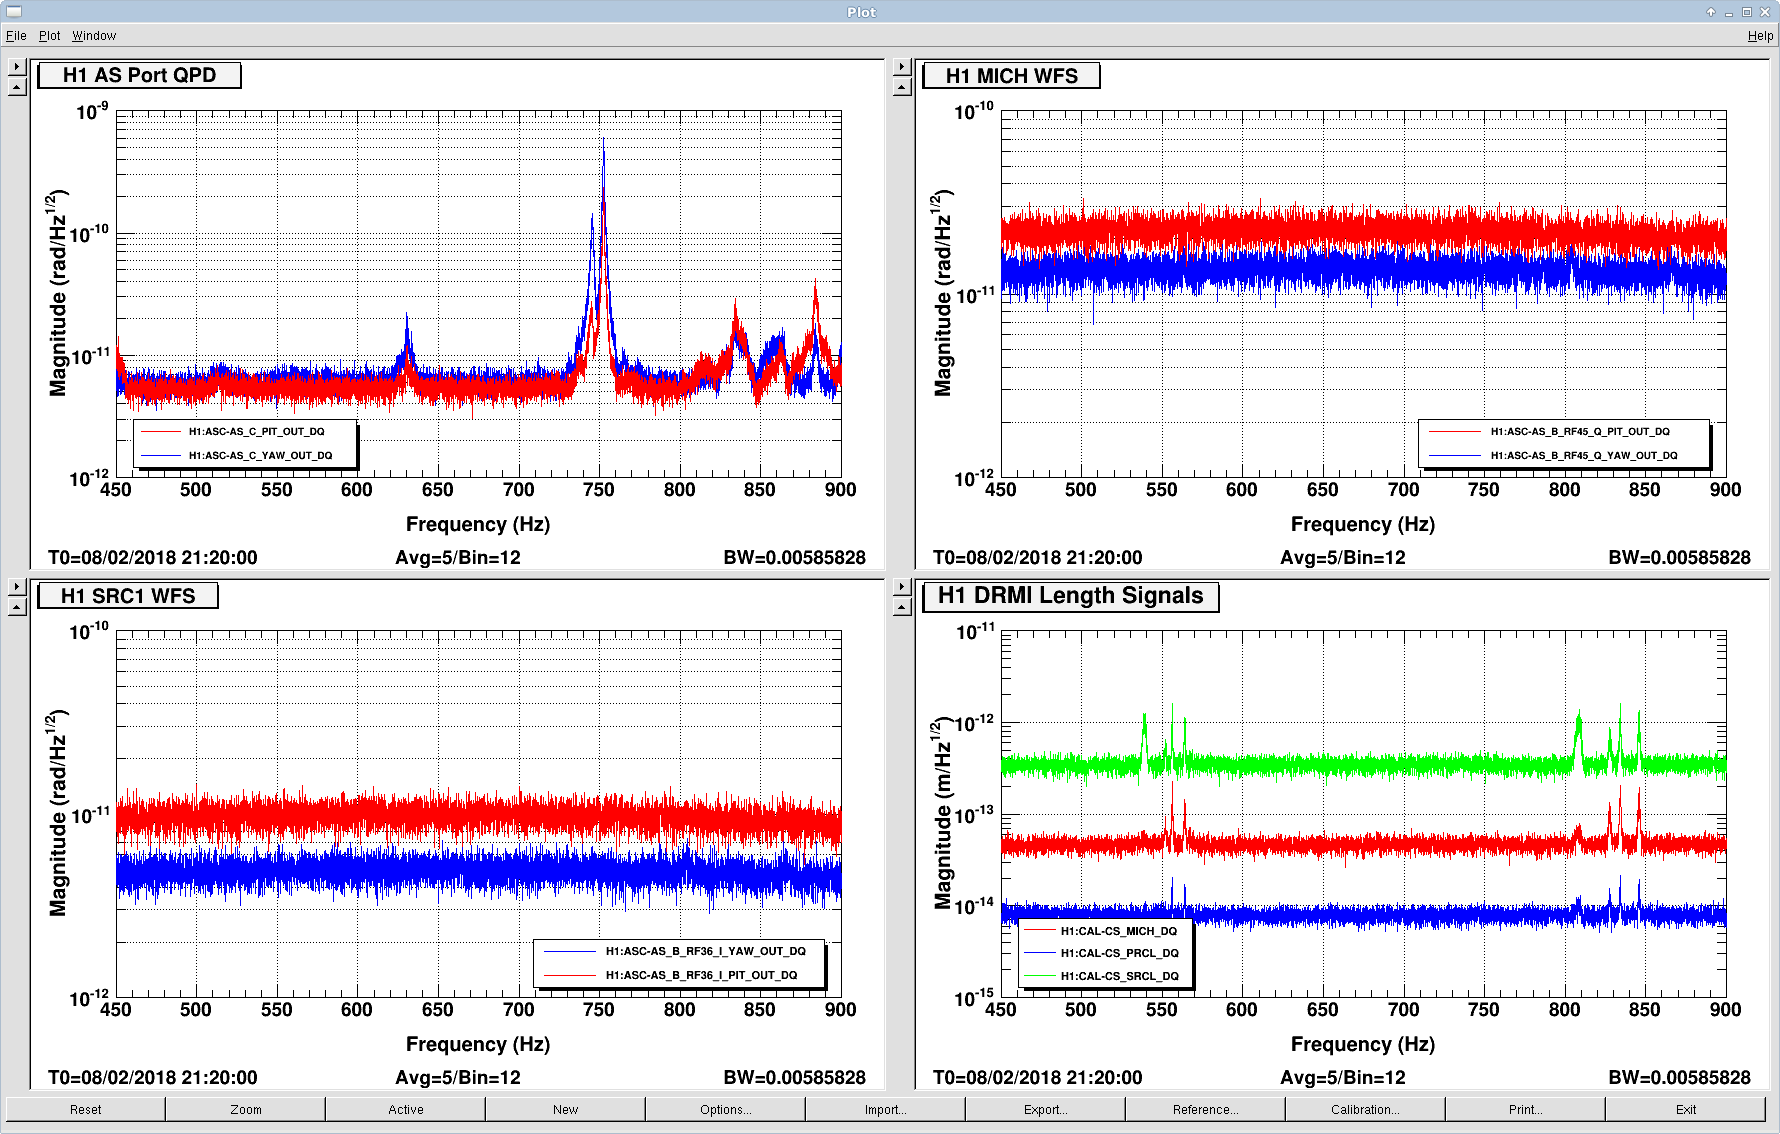
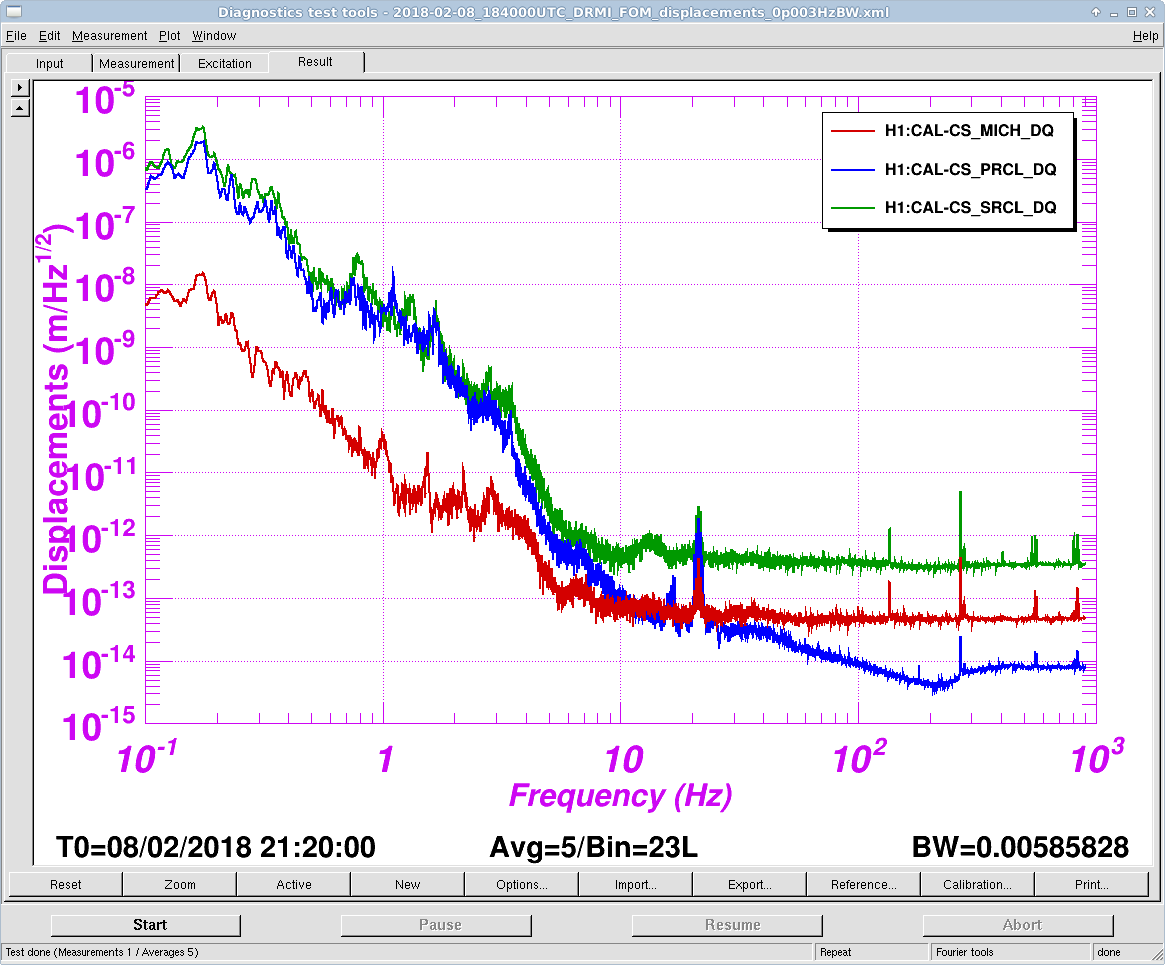
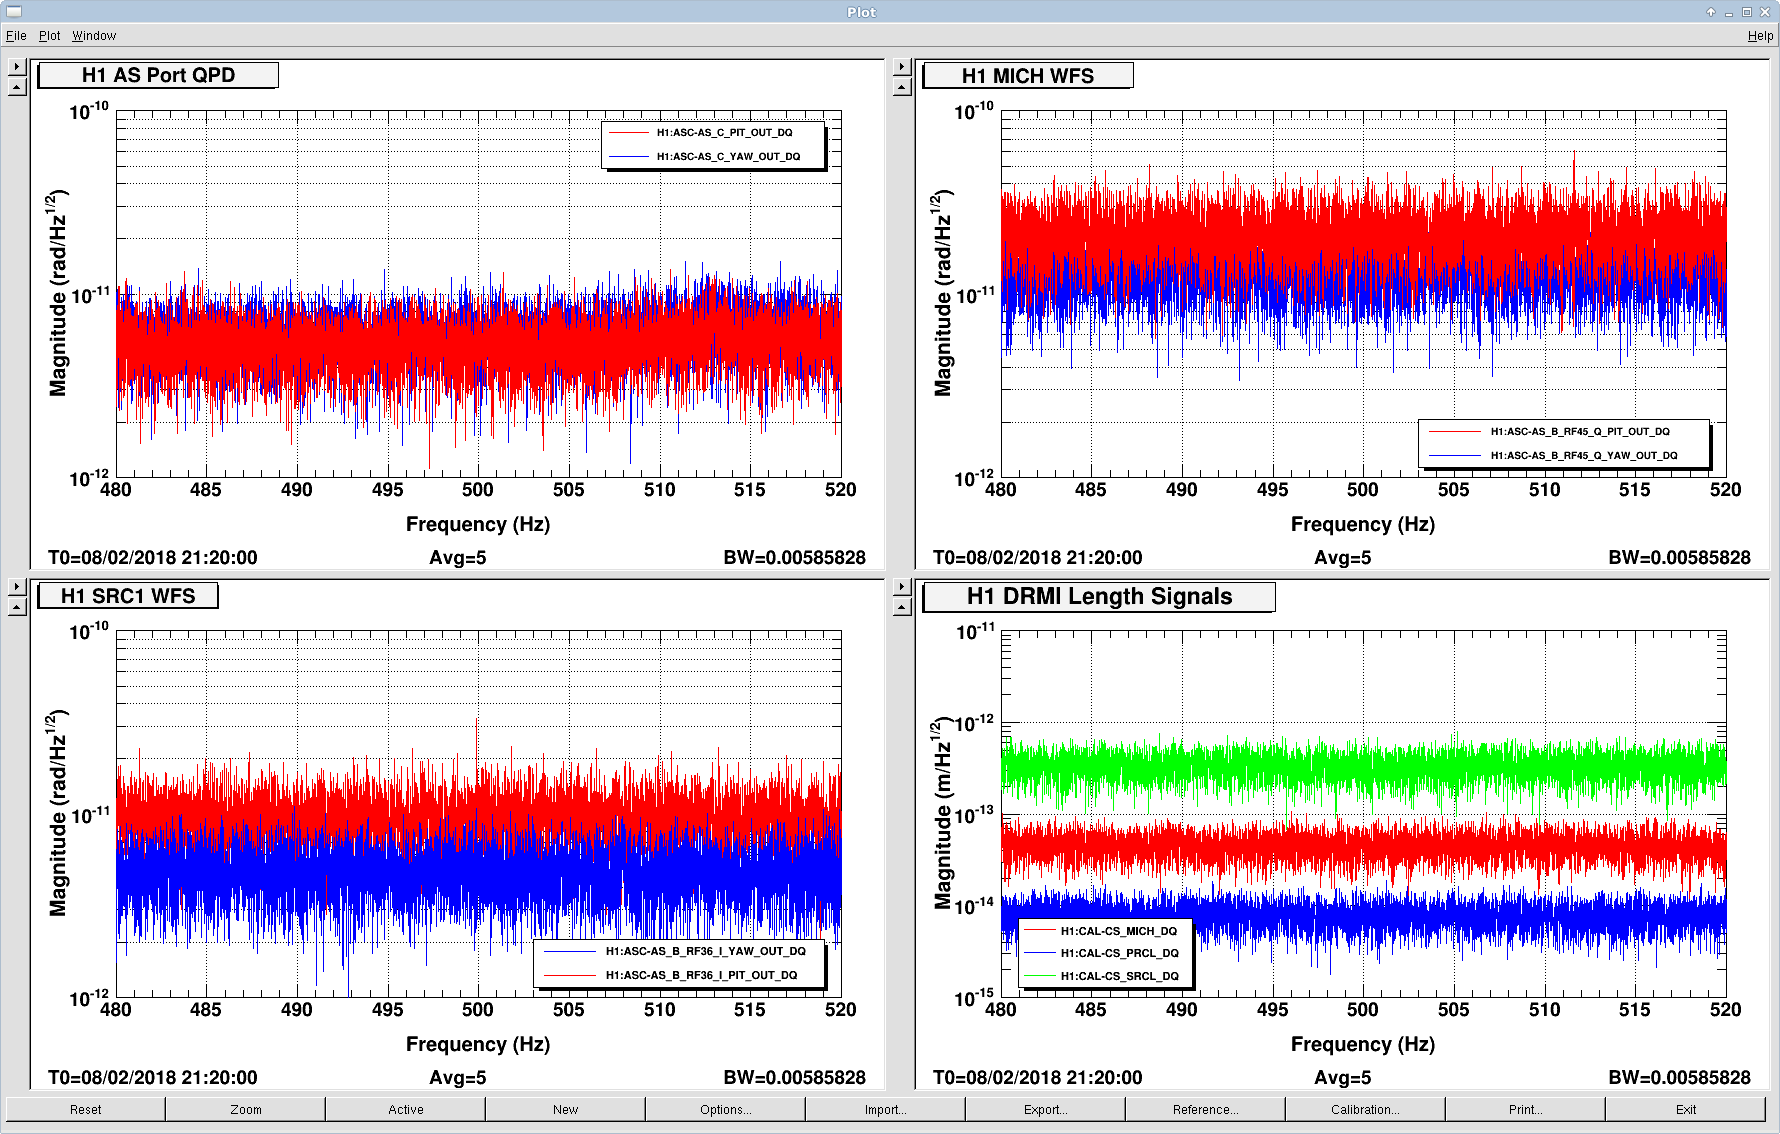
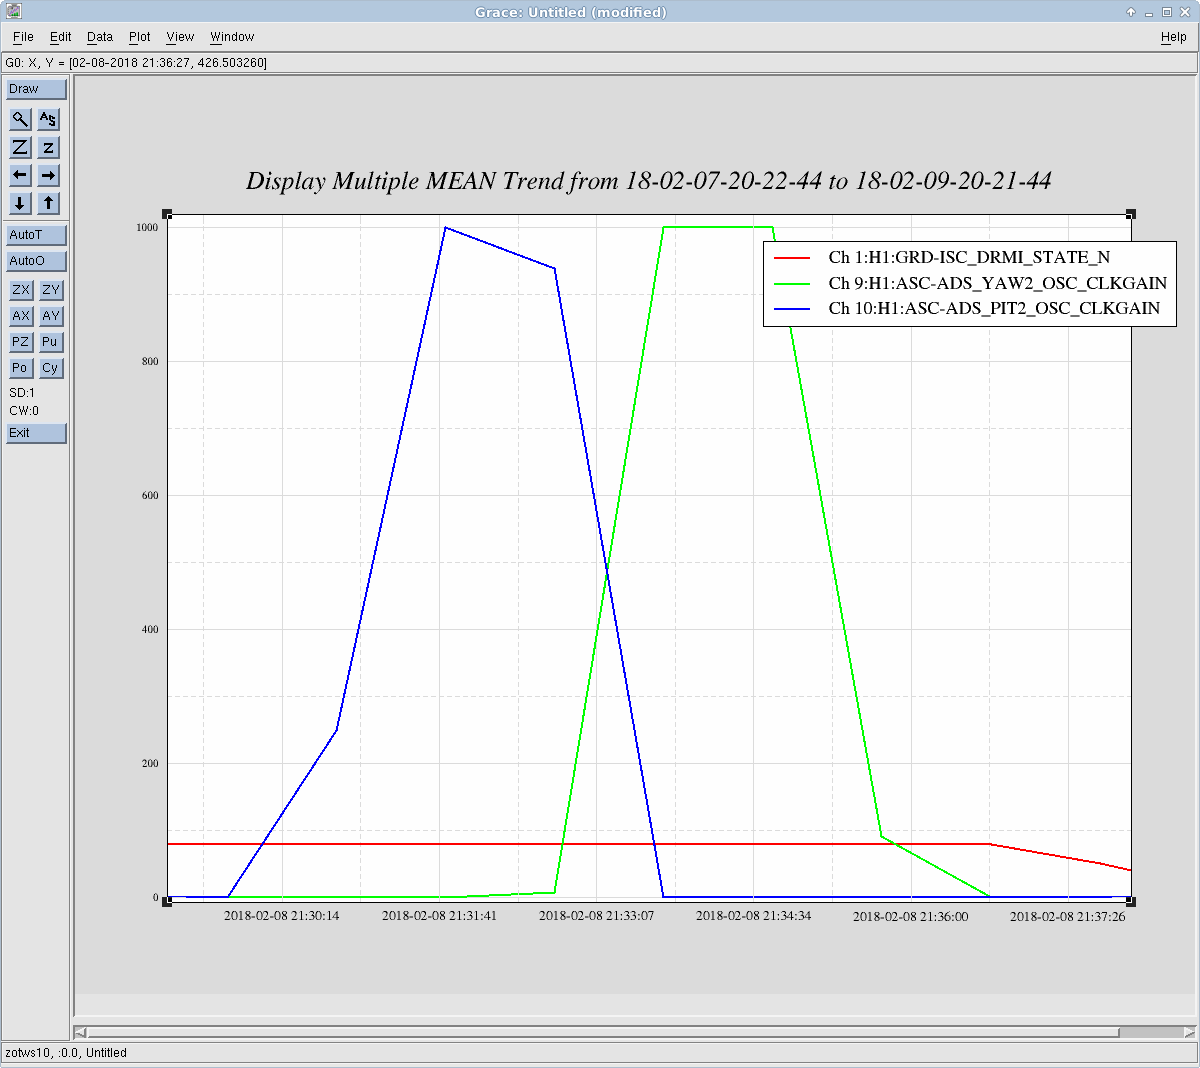
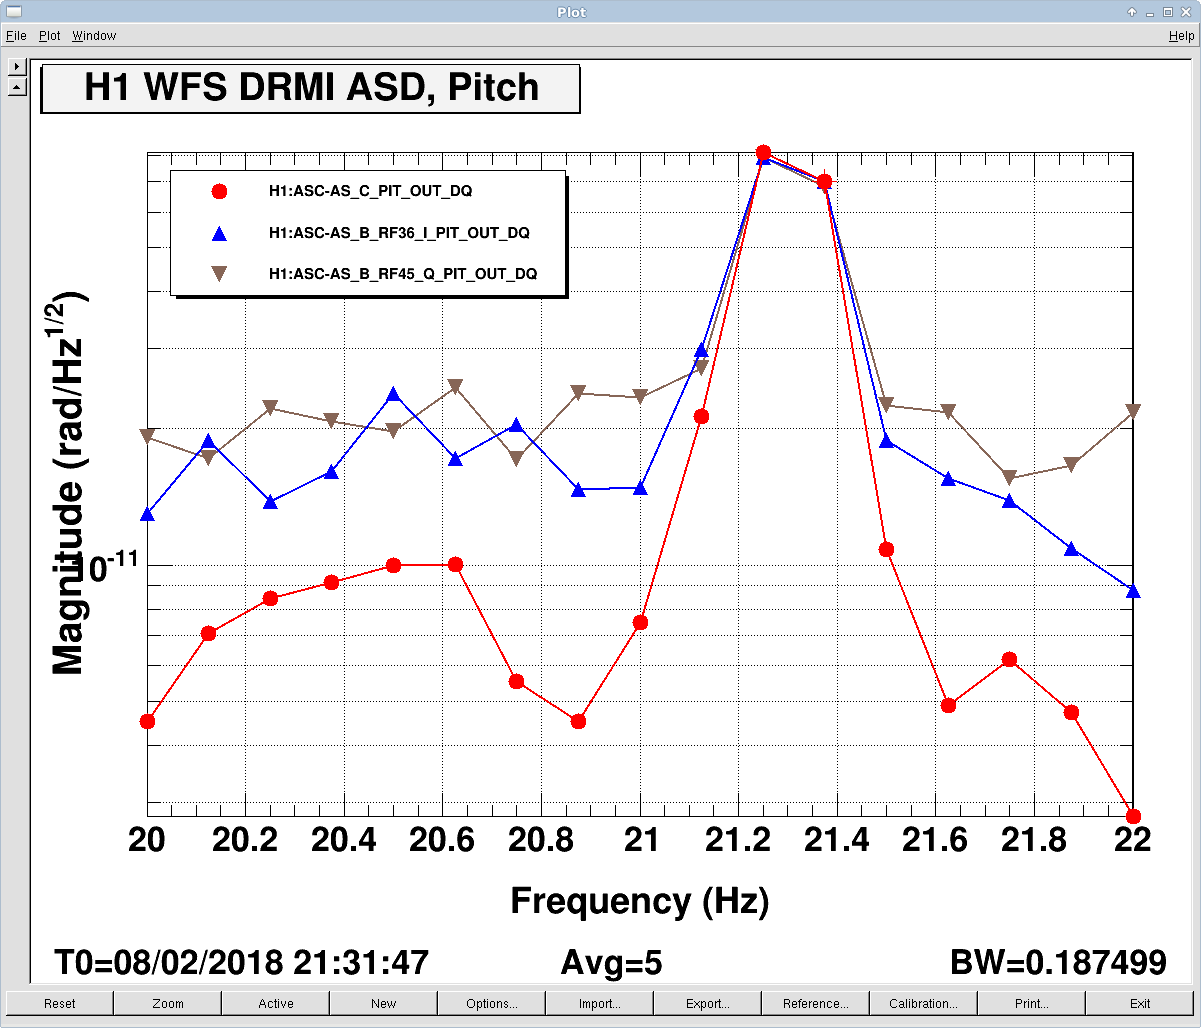
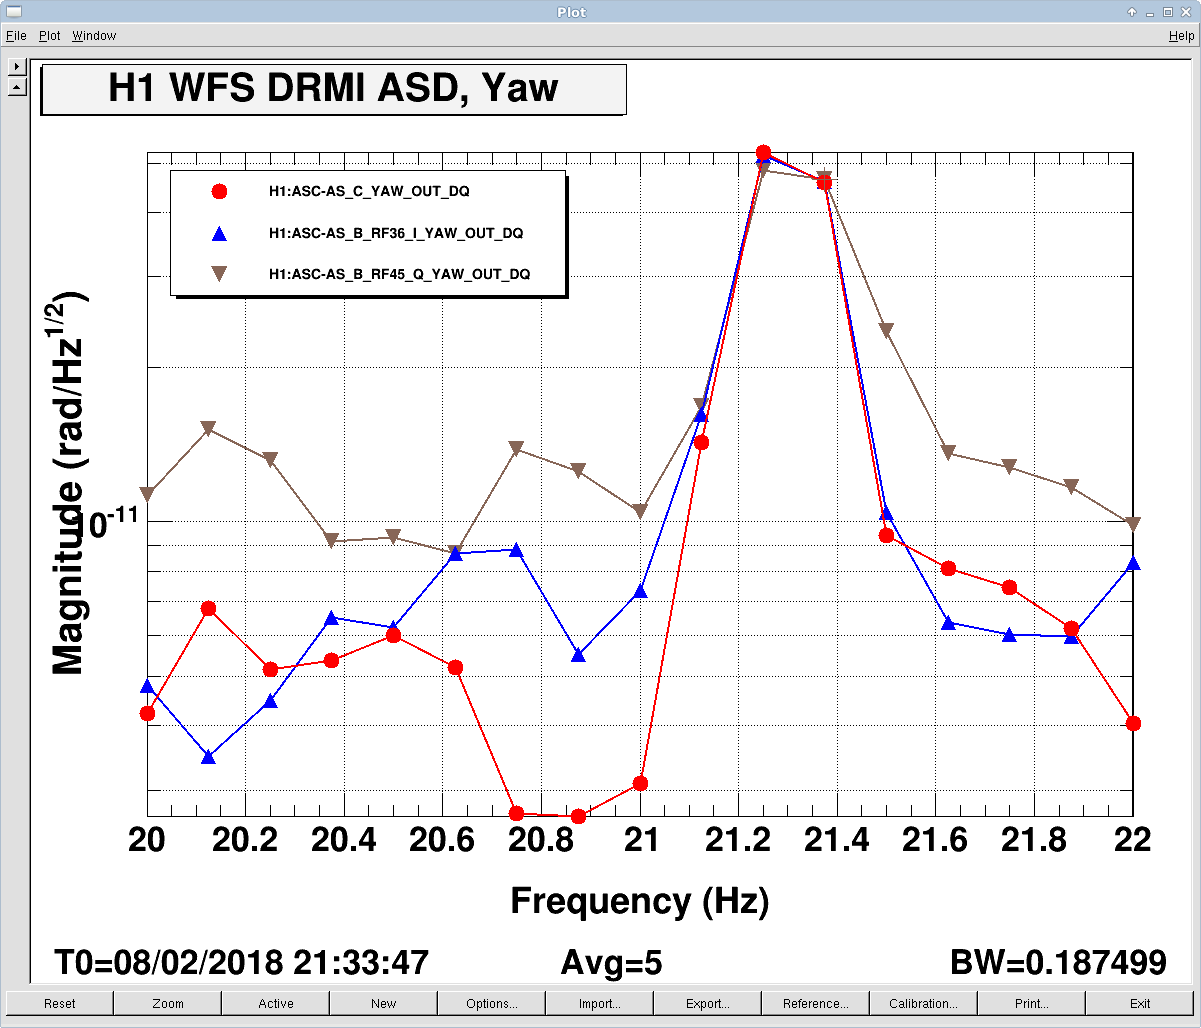
J. Kissel, J. Driggers

I continue to search for the at-vacuum violin mode resonances so we can determine the shift in frequency from the detailed in-air measurements (LHO aLOG 39163). This time, instead of looking at the PUM OSEMs and optical lever local sensors (as done in LHO aLOG 40019), I scoured data in the can from last week's arm peaking and DRMI locking, in hopes that an interferometric measurement would be more sensitive.

Namely, I found a time when DRMI was locked (starting from the crumbs left in LHO aLOG 40463, and then trending the DRMI guardian lock state, the LSC trigger bits, and AS_C's normalized sum), 2018-02-08 ~21:20 UTC, and measured the ASD of MICH, PRCL, SRCL, and a few of the WFS and QPDs that have been traditionally sensitive to violin modes.

Calibration details are below, but the message is that I've still found nothing.
The most sensitive length measurement was MICH at ~8e-15 m/rtHz, and the most sensitive angle measurement was (surprisingly) the AS_C QPD at ~6e-12 rad/rtHz.
The first four attachments are the calibrated ASDs, at various levels of zoom in frequency.

%%%%
Details
%%%%

LSC Signal Calibration
Not so tough -- I grabbed the DRMI displacement wall FOM from
    /opt/rtcds/userapps/release/isc/h1/scripts/DRMI_FOM_displacements.xml (rev. 16689, last changed rev. 14505)
and simply converted the pre-calibrated channels from [um] to [m].

ASC Signal Calibration (with guidance from Jenne)
   - Find a time when the ASC dither signals were on, gather the frequency, amplitude (e.g. H1:ASC-ADS_PIT2_OSC_FREQ, H1:ASC-ADS_PIT2_OSC_CLKGAIN), and which optic was driven. Some ugly combination of dataviewer and time-machine is needed for this search, because which oscillator used pointing to which optic is arbitrary and inconsistent with time. Note, that at this stage, the dither amplitude will be in peak counts of the sine wave at the given dither frequency, [ct_pk] @ f Hz. Here's what I found:
       DOF       f [Hz]     Amp [ct_pk]   Driven Optic     Time On
       Pitch      21.3      1000          SRM              2018-02-08 (21:31:46 - 21:32:46 UTC)
       Yaw        21.3      1000          SRM              2018-02-08 (21:33:46 - 21:34:46 UTC)
     (This was during the DRMI lock stretch from ~21:00 to 21:30 UTC)
   - Calibrate the dither amplitude into expected displacement ASD [rad_rms/rtHz] at the given optic.
       - Use the relevant subfunction of the python library of functions,
            /opt/rtcds/userapps/release/asc/h1/scripts/sensingMatrix/HY_version/DOF_lib.py
         In this case, SRM was being driven, so I used the PRM sub function, as it was most similar in suspension type. Note that means the attached ASC signal ASDs are calibrated into [rad] of SRM displacement.
            ]$ cd /opt/rtcds/userapps/release/asc/h1/scripts/sensingMatrix/HY_version/
            ]$ ipython
            In [1]: import DOF_lib
            In [2]: pitch = DOF_lib.PRM_cts2rads(21.3,'PIT','TFs/H1_PRM.txt')
            In [3]: yaw = DOF_lib.PRM_cts2rads(21.3,'YAW','TFs/H1_PRM.txt')
            In [4]: pitch
            Out[4]: (4.6564401596417816e-14, -2.6756796108295753e-08)
            In [5]: yaw
            Out[5]: (2.9158641207661465e-14, -3.8069250094614154e-07)
          The script uses the EUL2OSEM gain, the DAC gain, the coil driver gain, the magnet strength, the flag-to-CoM distance, and a canned torque to angular displacement transfer function at the specified frequency to calculate the above gain.
        - The first output of the functions are what we need, a scalar calibration of radians of optic motion per dither drive count, i.e. [rad/ct]. So multiply that by the dither amplitude to get the expected peak displacement,
           pitch_rad_pk = 1e3 [ct_pk] * 4.66e-14 [rad/ct] = 4.66e-11 [rad_pk]
           yaw_rad_pk = 1e3 [ct_pk] * 2.92e-14 [rad/ct] = 2.92e-11 [rad_pk]
        - In converting from peak sine wave amplitude to rms amplitude spectral density, the dither lines were only on for a minute, so I need a short FFT -- I chose 0.1 Hz. With the standard DTT Hanning window, that's an effective noise band width (ENBW) of 0.187499. Thus, to get from peak to rms/rtHz, that's
           pitch_rad_rms_p_rtHz = pitch_rad_pk * (1/sqrt(2)) [rms/pk] * (1/sqrt(0.187499)) [1/rtHz] = 7.61e-11 [rad_rms / rtHz]
           yaw_rad_rms_p_rtHz = yaw_rad_pk * (1/sqrt(2)) [rms/pk] * (1/sqrt(0.187499)) [1/rtHz] = 4.77e-11 [rad_rms / rtHz]
    - Grab a spectrum of all of the respective QPDs and WFS signals for the time when DRMI was locked and the dither excitations were present, and calibrate the signals such that the amplitude of the dither line is as calcualted above. (See 3rd, 4th, and 5th image attached.)
        Sensor       DOF      Channel Name                     Calibration [rad/ct]
         MICH WFS    Pitch    H1:ASC-AS_B_RF45_Q_PIT_OUT_DQ    1.8e-08
         SRC1 WFS    Pitch    H1:ASC-AS_B_RF36_I_PIT_OUT_DQ    6.0e-10
         AS QPD      Pitch    H1:ASC-AS_C_PIT_OUT_DQ           8.0e-07

         MICH WFS    Pitch    H1:ASC-AS_B_RF45_Q_YAW_OUT_DQ    1.1e-08
         SRC1 WFS    Pitch    H1:ASC-AS_B_RF36_I_YAW_OUT_DQ    3.0e-10
         AS QPD      Pitch    H1:ASC-AS_C_YAW_OUT_DQ           9.0e-07
I imagine I can't have gotten the accuracy better than a factor of 2, but I wanted the practice in calibrating the WFS & QPD ASDs, and to be able to make a ball-park statement such as "well, we wouldn't expect to see the violin modes, because we can't resolve cavity displacement better than ~5e-12 rad/rtHz at 500 Hz."
Images attached to this report