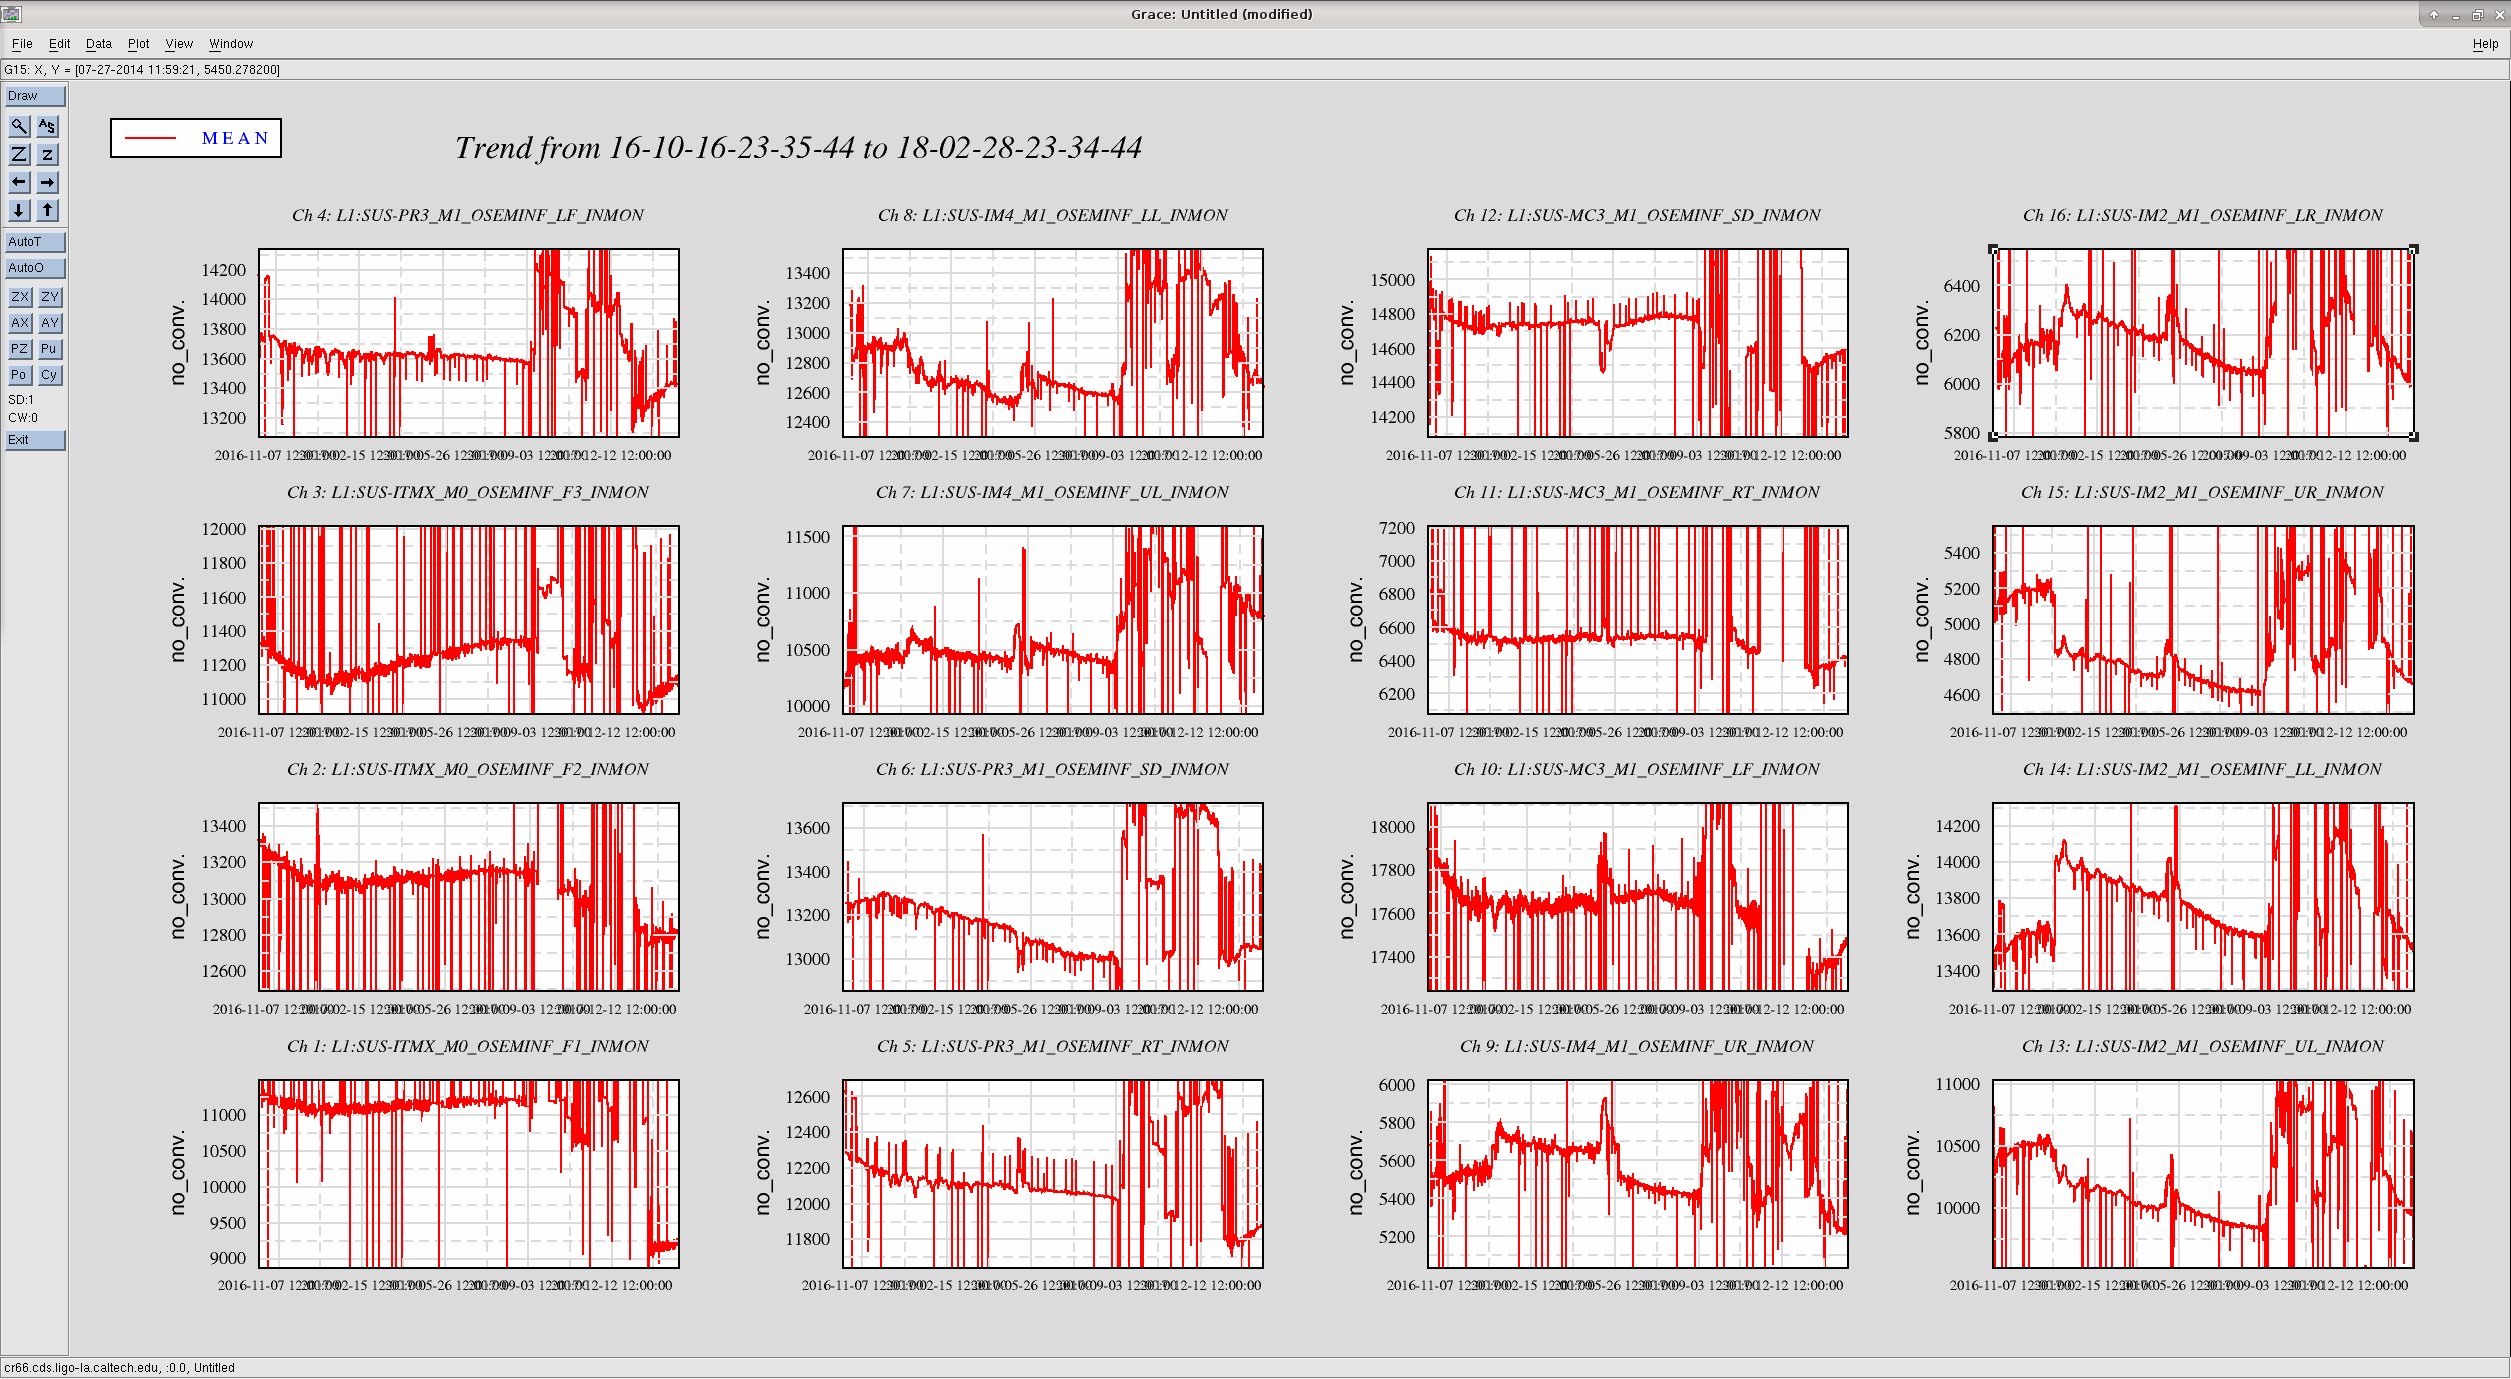
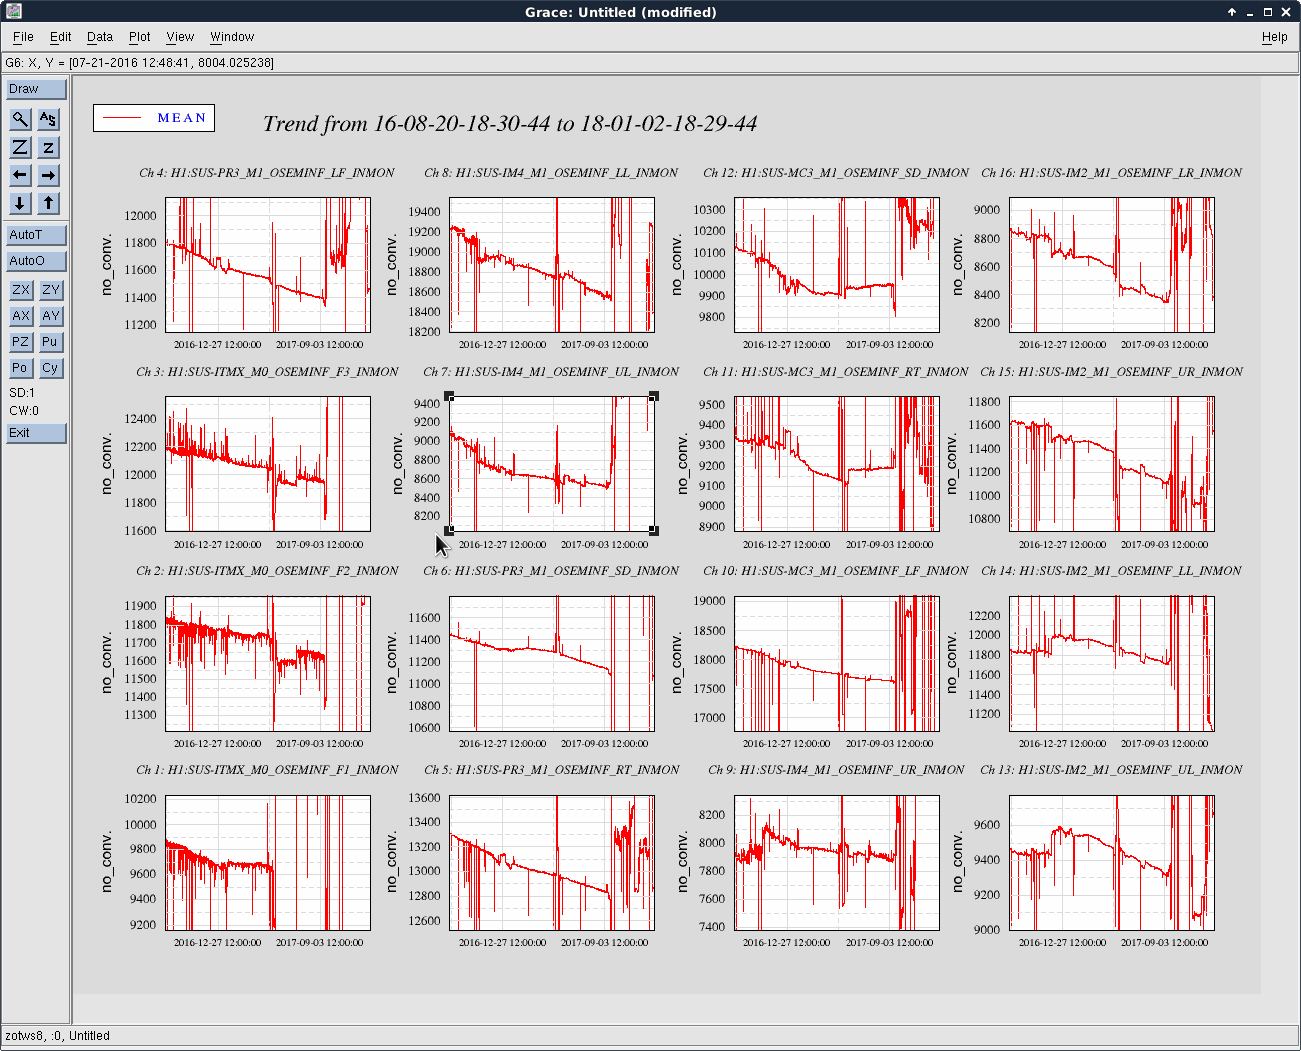
Attached is a 500 day trend of 16 face BOSEMs from a few different randomly sampled suspensions in the corner station.
All of the sampled BOSEMs see 200-600 counts of decay over ~365 days of the plotted data.
Note, "face" facing BOSEMs on different types of suspensions have different reference names (T1 vs F1 vs RT BOSEMs are mounted in different locations on the different types of suspensions). For reference, search "Controls Arrangement Poster" by J. Kissel to see all of the configurations (E1100109 is the HLTS one for example). Or see the rendering on each medm screen.
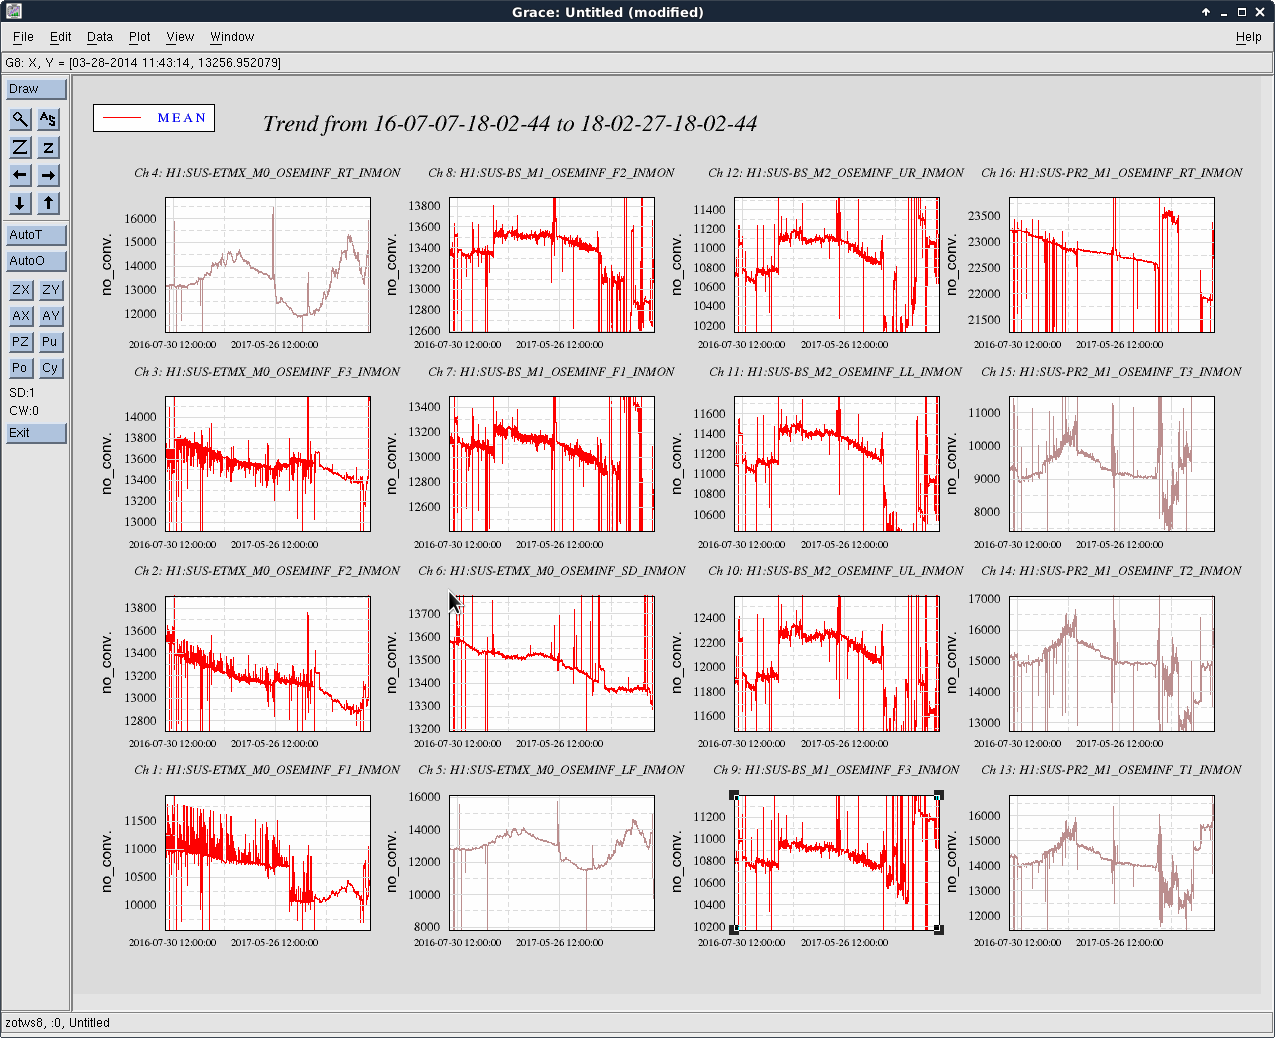
Attached is the first plot I made of a few different randomly sampled suspensions, which included some vertically mounted BOSEMs. These trends are plotted ion brown and show other factors such as temperature in their shape over the last 500 days. Of the remaining red "face" mounted BOSEMs on the plot, all 11 show a downward trend of a couple hundred counts.
Using the same random selection of face OSEM channels as Betsy in the original aLOG entry above, but for LLO, 500 day trends are attached below.

OSEM open-light decay trends appear similar between sites, with in general 100-600 counts of decay over ~500 days of the plotted data.

However, it should be noted that the IM suspensions also included in the trends employ AOSEMs, and not BOSEMs, but the decay trends for both types of OSEMs appear to be consistent.