ronaldas.macas@LIGO.ORG - posted 14:15, Friday 30 March 2018 (41230)
Measuring SRM P/Y angle change over Observing run 2
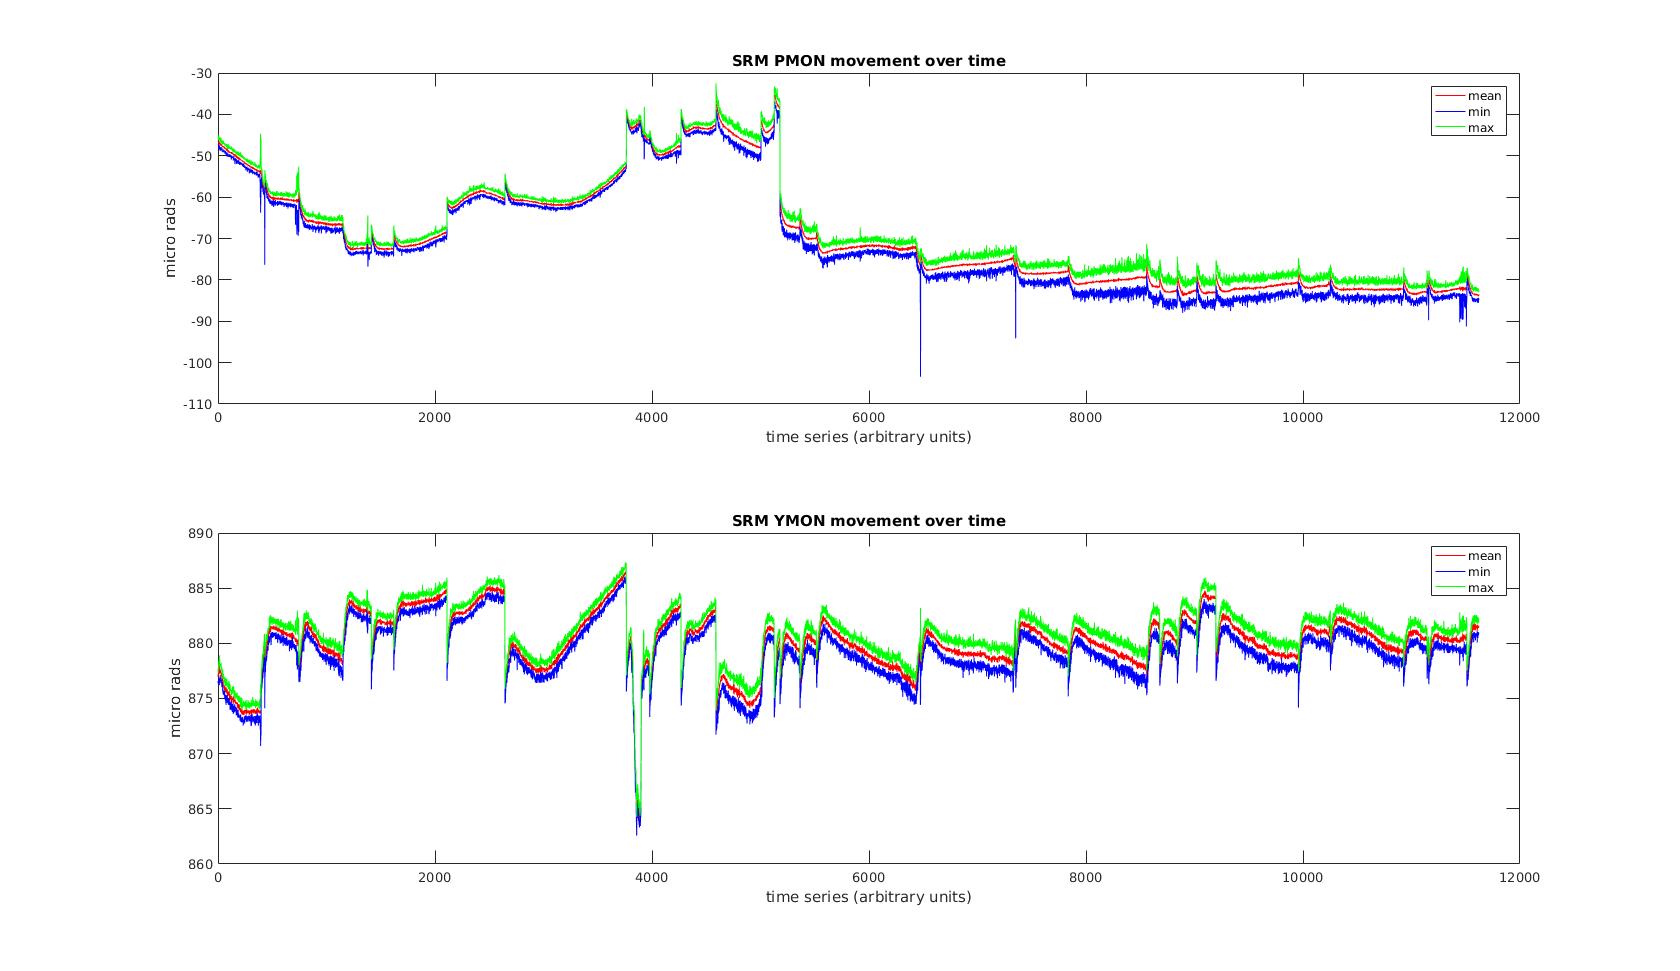
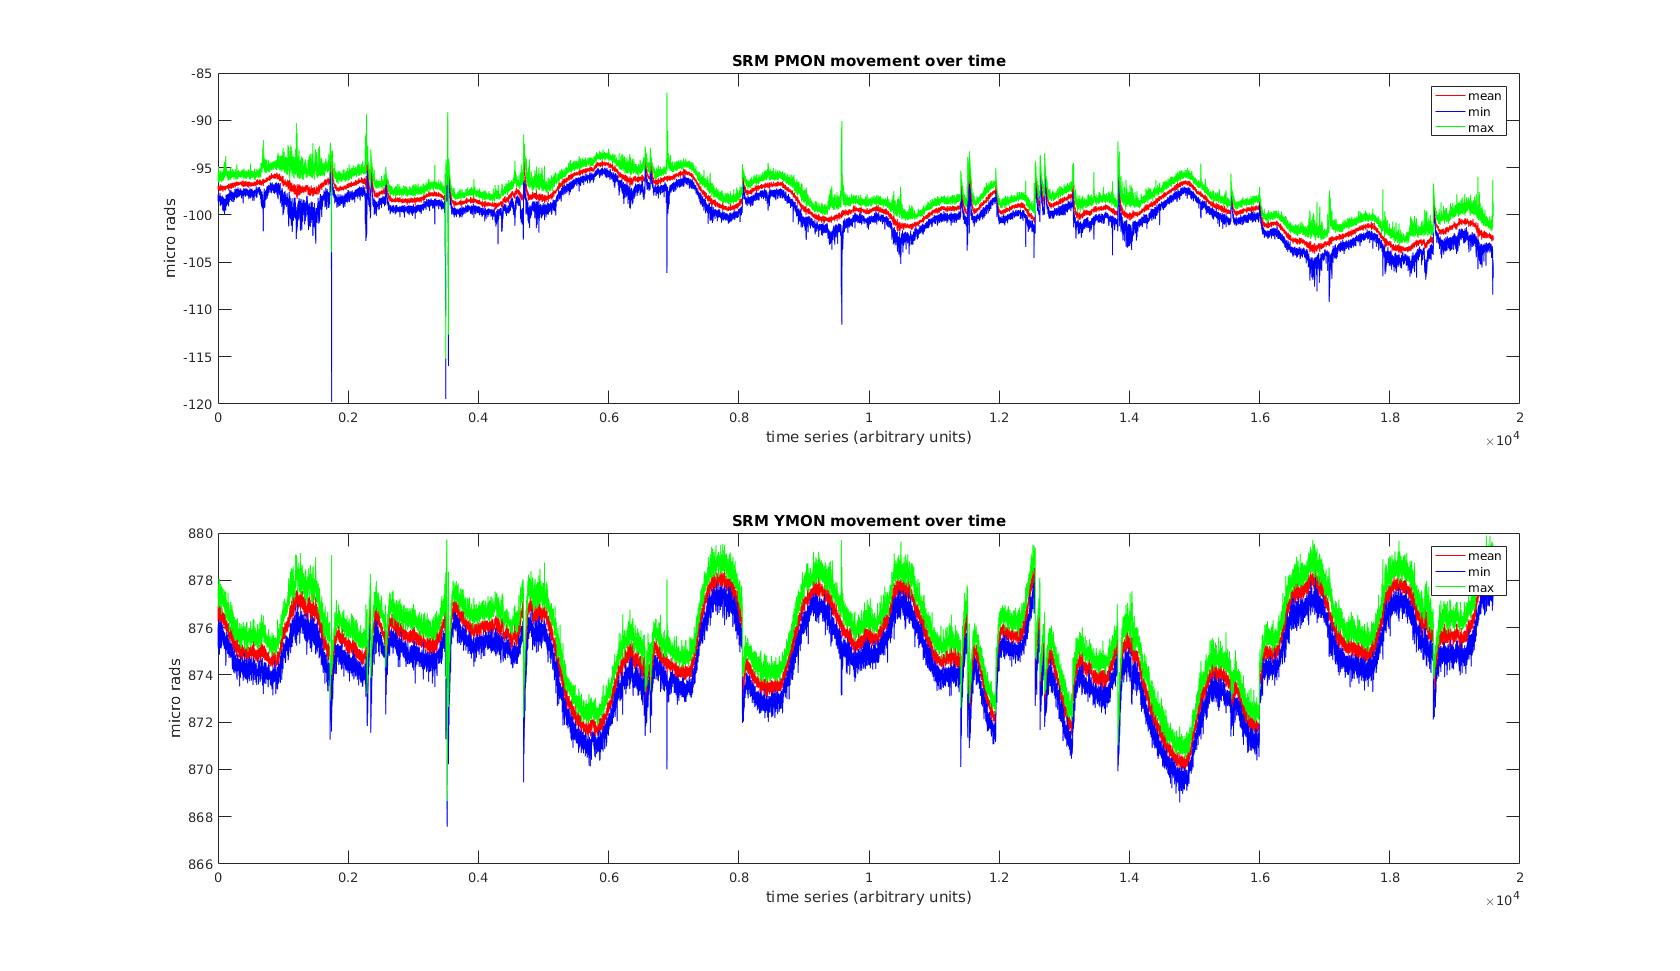
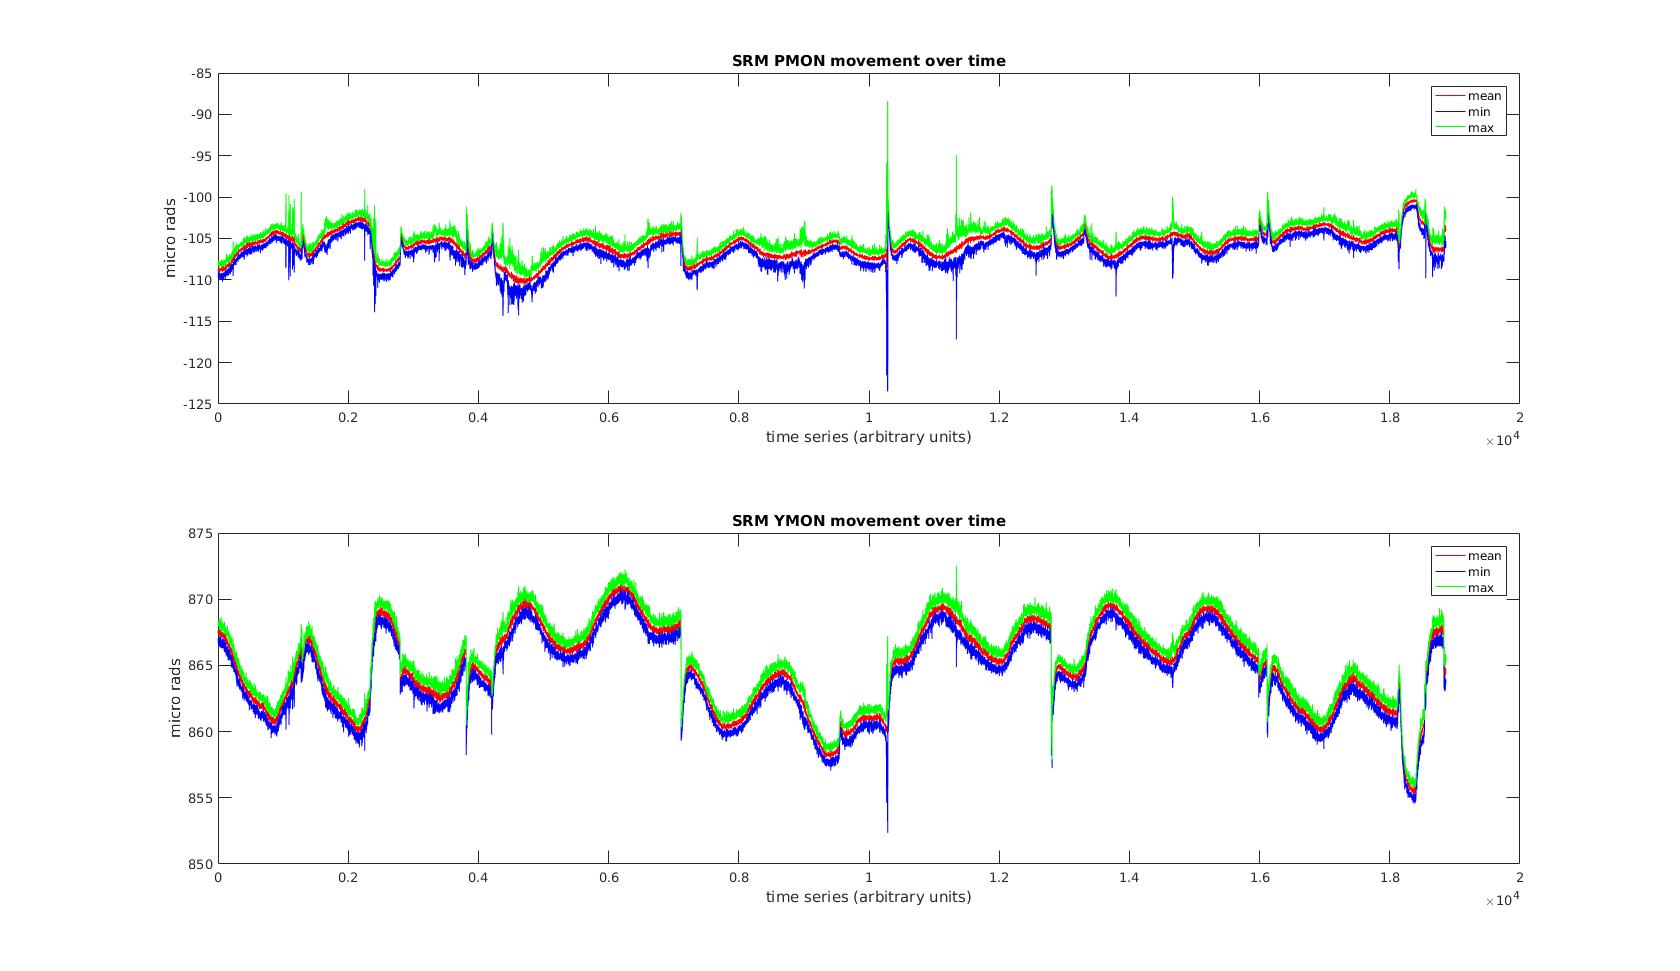
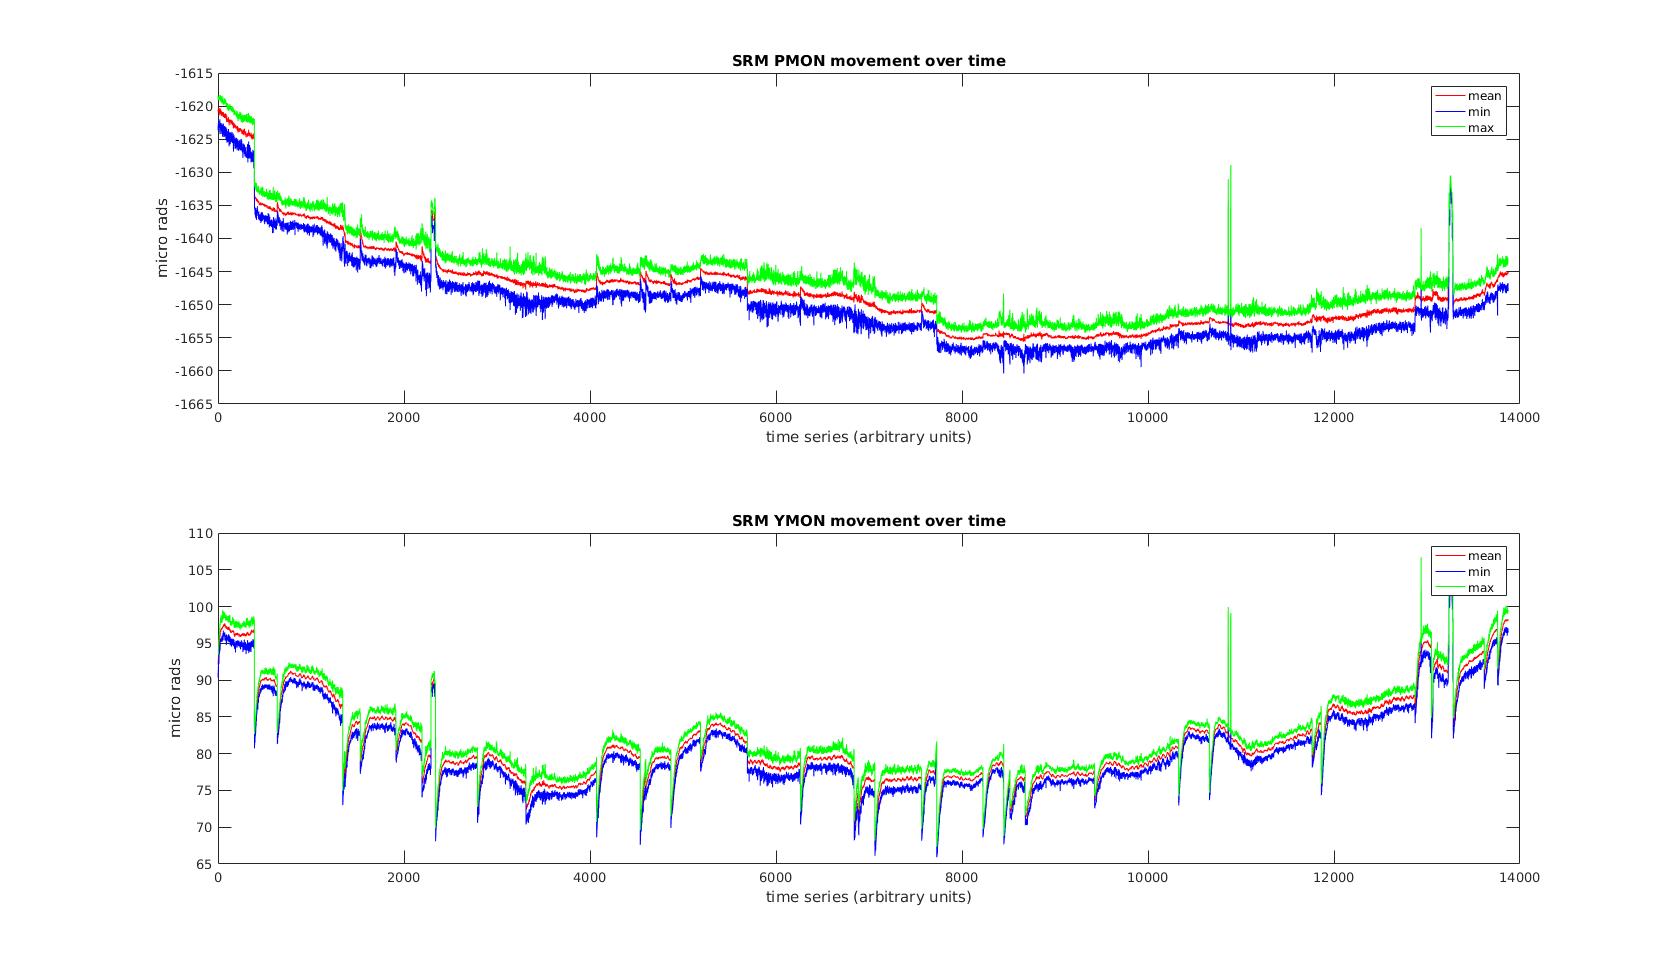
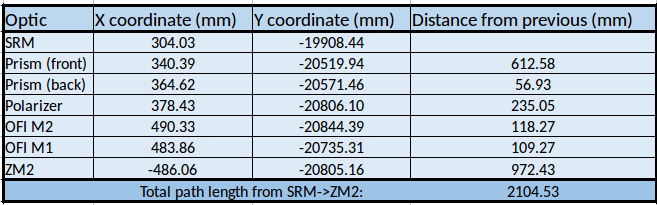
Ronaldas, Sheila, Corey

'H1_01_january/04_april/08_august.jpg' shows how SRM angle changes over O2 run. One can see that SRM P angle changes its relative position from about -40 (January) to -110 (August) in microrads. SRM Y angle changes over time not that much, just from 880 (January) to 860 (August) in microrads.

Using distance measurements by Corey (attached as 'dist_meas_Corey.png'), maximum angle change is only 70microrads * 2100mm = 0.147 over the period of 8 months. Sheila suggested that this change in angle is sufficiently small to ignore.

For a comparison, Livingston January SRM P/Y angle change over time is attached. L1 angle change is a bit bigger but still relatively small.

About plots:
1) data is plotted only when IFO is locked (this explains sudden jumps in angle values);
2) each plot has the total duration of '15 days - time when IFO was not locked';
3) data was taken from the following O2 dates: 10-25th of January, 10-25 of April, 10-25 of August.

Plots are attached to the aLOG. Code used to get data and generate plots is given as well.
Images attached to this report
Non-image files attached to this report
