Aidan, Daniel V-H., TVo, Dan B., Terra
This is the initial analysis of the HAM6 output beam scan we did last week. Attached is the overall picture, in the style of LLO's beam study.
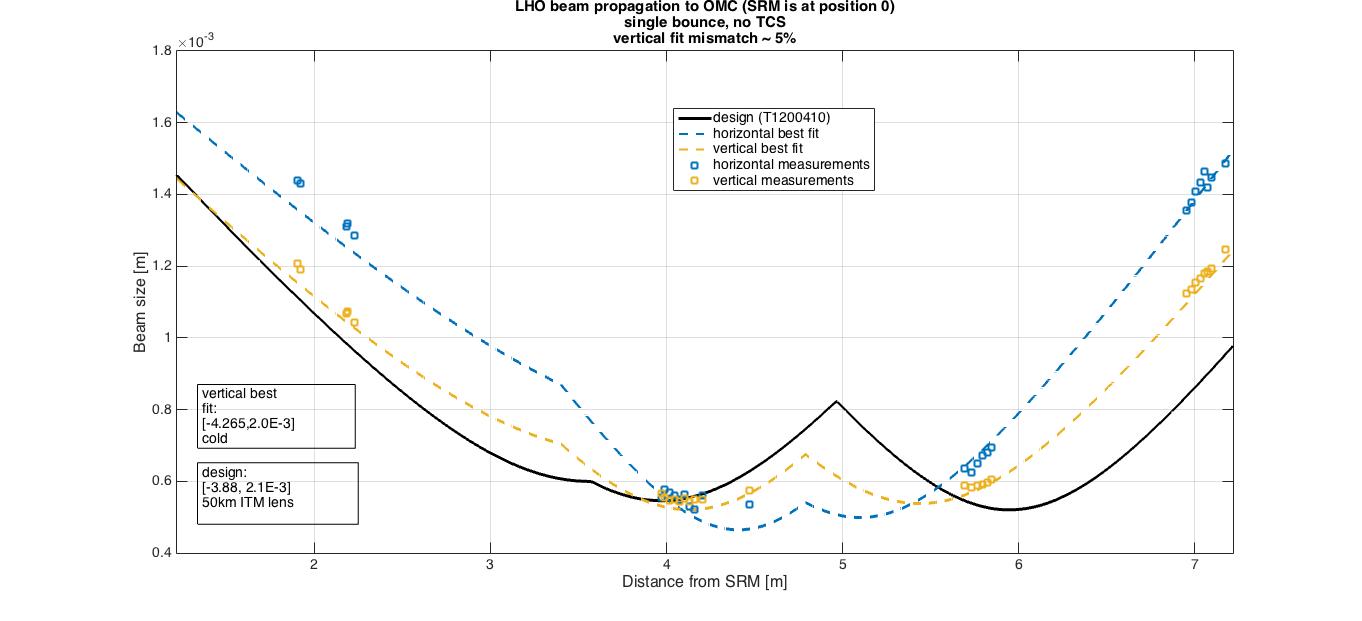
Measurements are done in HAM6 during single bounce configuration (no TCS) either directly in beam or using pickoff. Data is then fit by varying input beam parameters and, to some degree, OM optical/path length parameters. These are compared against the original output beam design. (There is a caveats to this, see below.) Since there was large astigmatism, what I show is beam fit prioritized to fit vertical measurements. [R,w] directly after SRM for design and vertical fits shown in plot. X-axis distances are in meters from SRM.
Main points:
- we find up to 20% astigmatism coming into HAM6
- Finesse modeling for the single bounce beam parameters using the up-to-date design configuration shows about 3% astigmatism coming out of the SRM
- table-top check of beam profiler gives 2-3% variation between vertical and horizontal, even when tilting scanner various ways with respect to incoming beam (NanoScan NS-SI/9/5 scanning slit profiler)
- looking at just the vertical beam, fit mismatch from OMC is ~5%
- we find similar shifts in OM placements (towards SRM) as LLO compared to original design; the distance between the edge of the ISI and OM1 & OM1 to OM2 was measured in situ. We find the latter agrees with up-to-date Zemax distance.
Caveat/to do: the design beam includes a 50km ITM lens, so I need to subtract that for more meaningful comparison; in the works.
For reference, the parameters used are:
- SRM to OM1: 3.4 m (Zemax gives 3.454 and I tweaked this slightly for fit), OM1 to OM2: 1.39 m (Zemax and in situ measurement)
- OM1 S: 1/4.6, OM2 S: 1/(1.7)
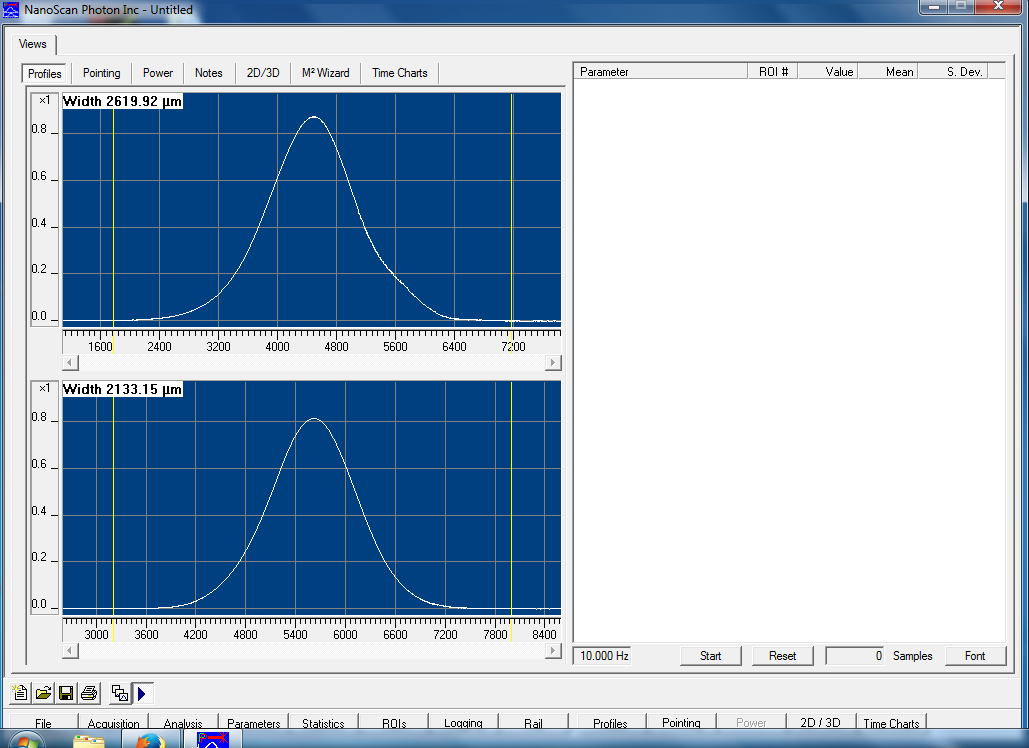
Adding screen shot of raw data from beam scanner: horizontal data on top, vertical on bottom. A one-sided pedestal on the right side of top plot can be seen. This measurement was taken ~10 inches from the edge of the ISI table closest to the septum window in the beam path as it enters HAM6 from SRM to OM1.
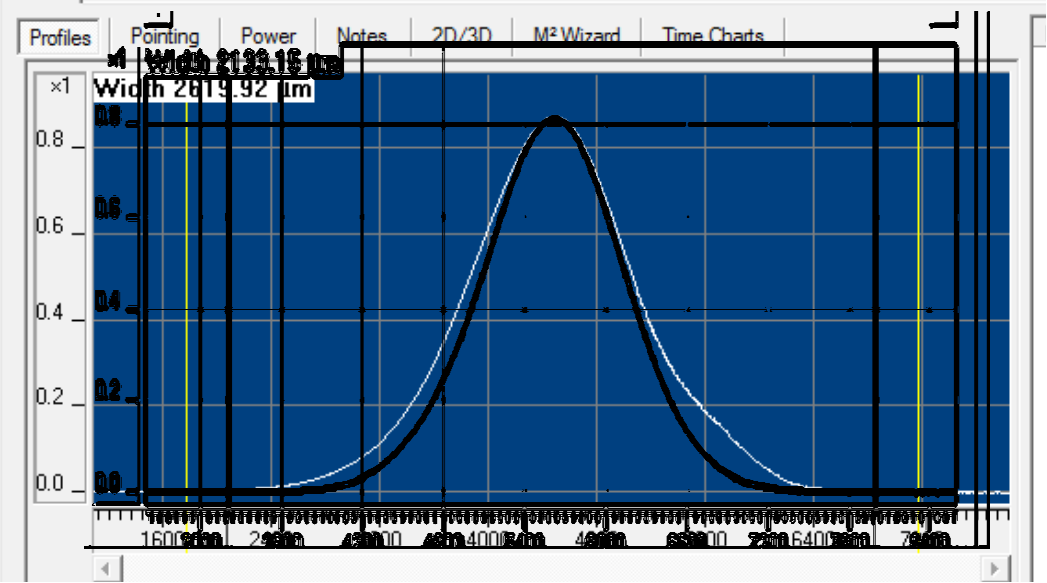
I enhanced the bottom image [vertical cross-section of beam] and rescaled it to the same horizontal and vertical scale as the top image [horizontal cross-section of beam], then I pasted this over the top image. Horizontal cross section = thin white line. Vertical cross-section = thick black line.
This highlights the excess power in the right hand side of the horizontal cross-section.