[Craig Niko Georgia]
Conclusions:
- We have taken electric field spectra with the foil door off, foil door on, and a foil house built around the EFM. Spectra coming soon.
- We also applied a DC voltage to the calibration plates and looked at the decay time at the output of the EFM, which should give us a confirmation of the EFM resistor (should be 1 TOhm)
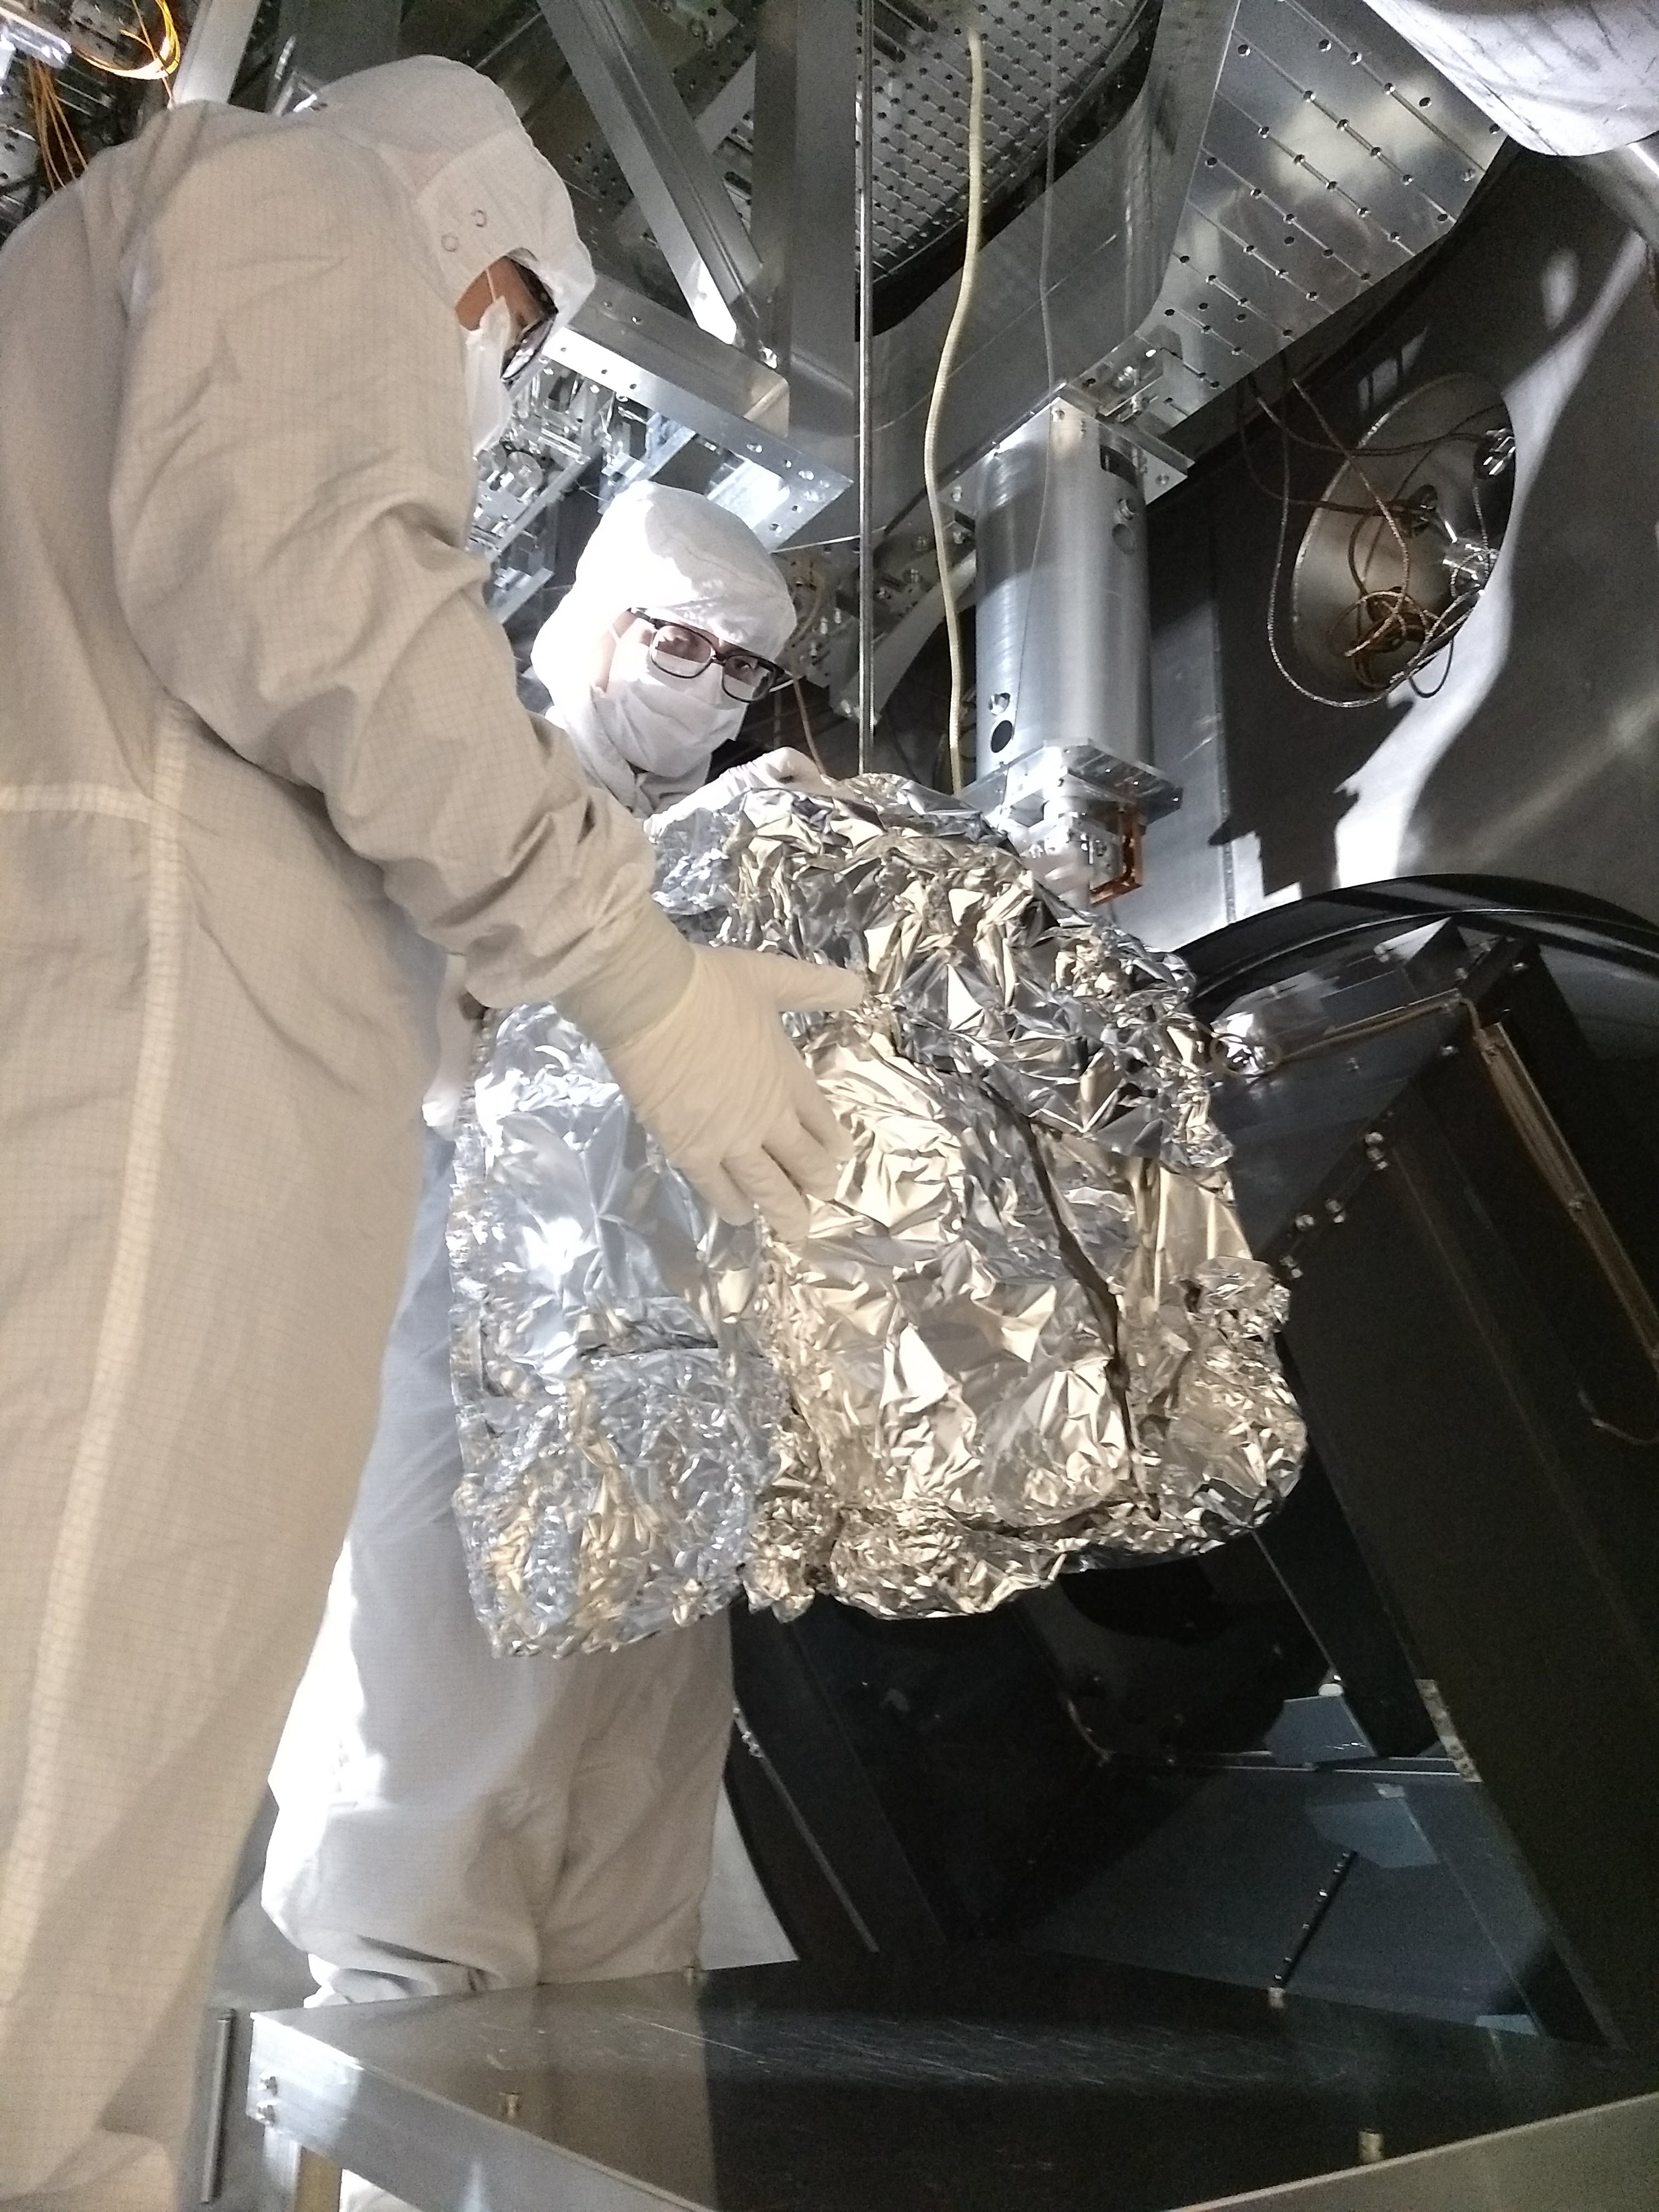
We went back to end-X to take more electric field meter (EFM) data. We wanted to find out whether the low frequency slope shown in our previous log post is due to sensor noise or fields within the chamber. We were also interested in confirming the dependence of the 60 Hz and 30 Hz peaks on the presence of the foil door. We made a foil house for the EFM which attached to the rod, and were careful not to ground the sensor plates (picture 1). The soft door cover was on for all these measurements. These three spectra will be posted shortly.
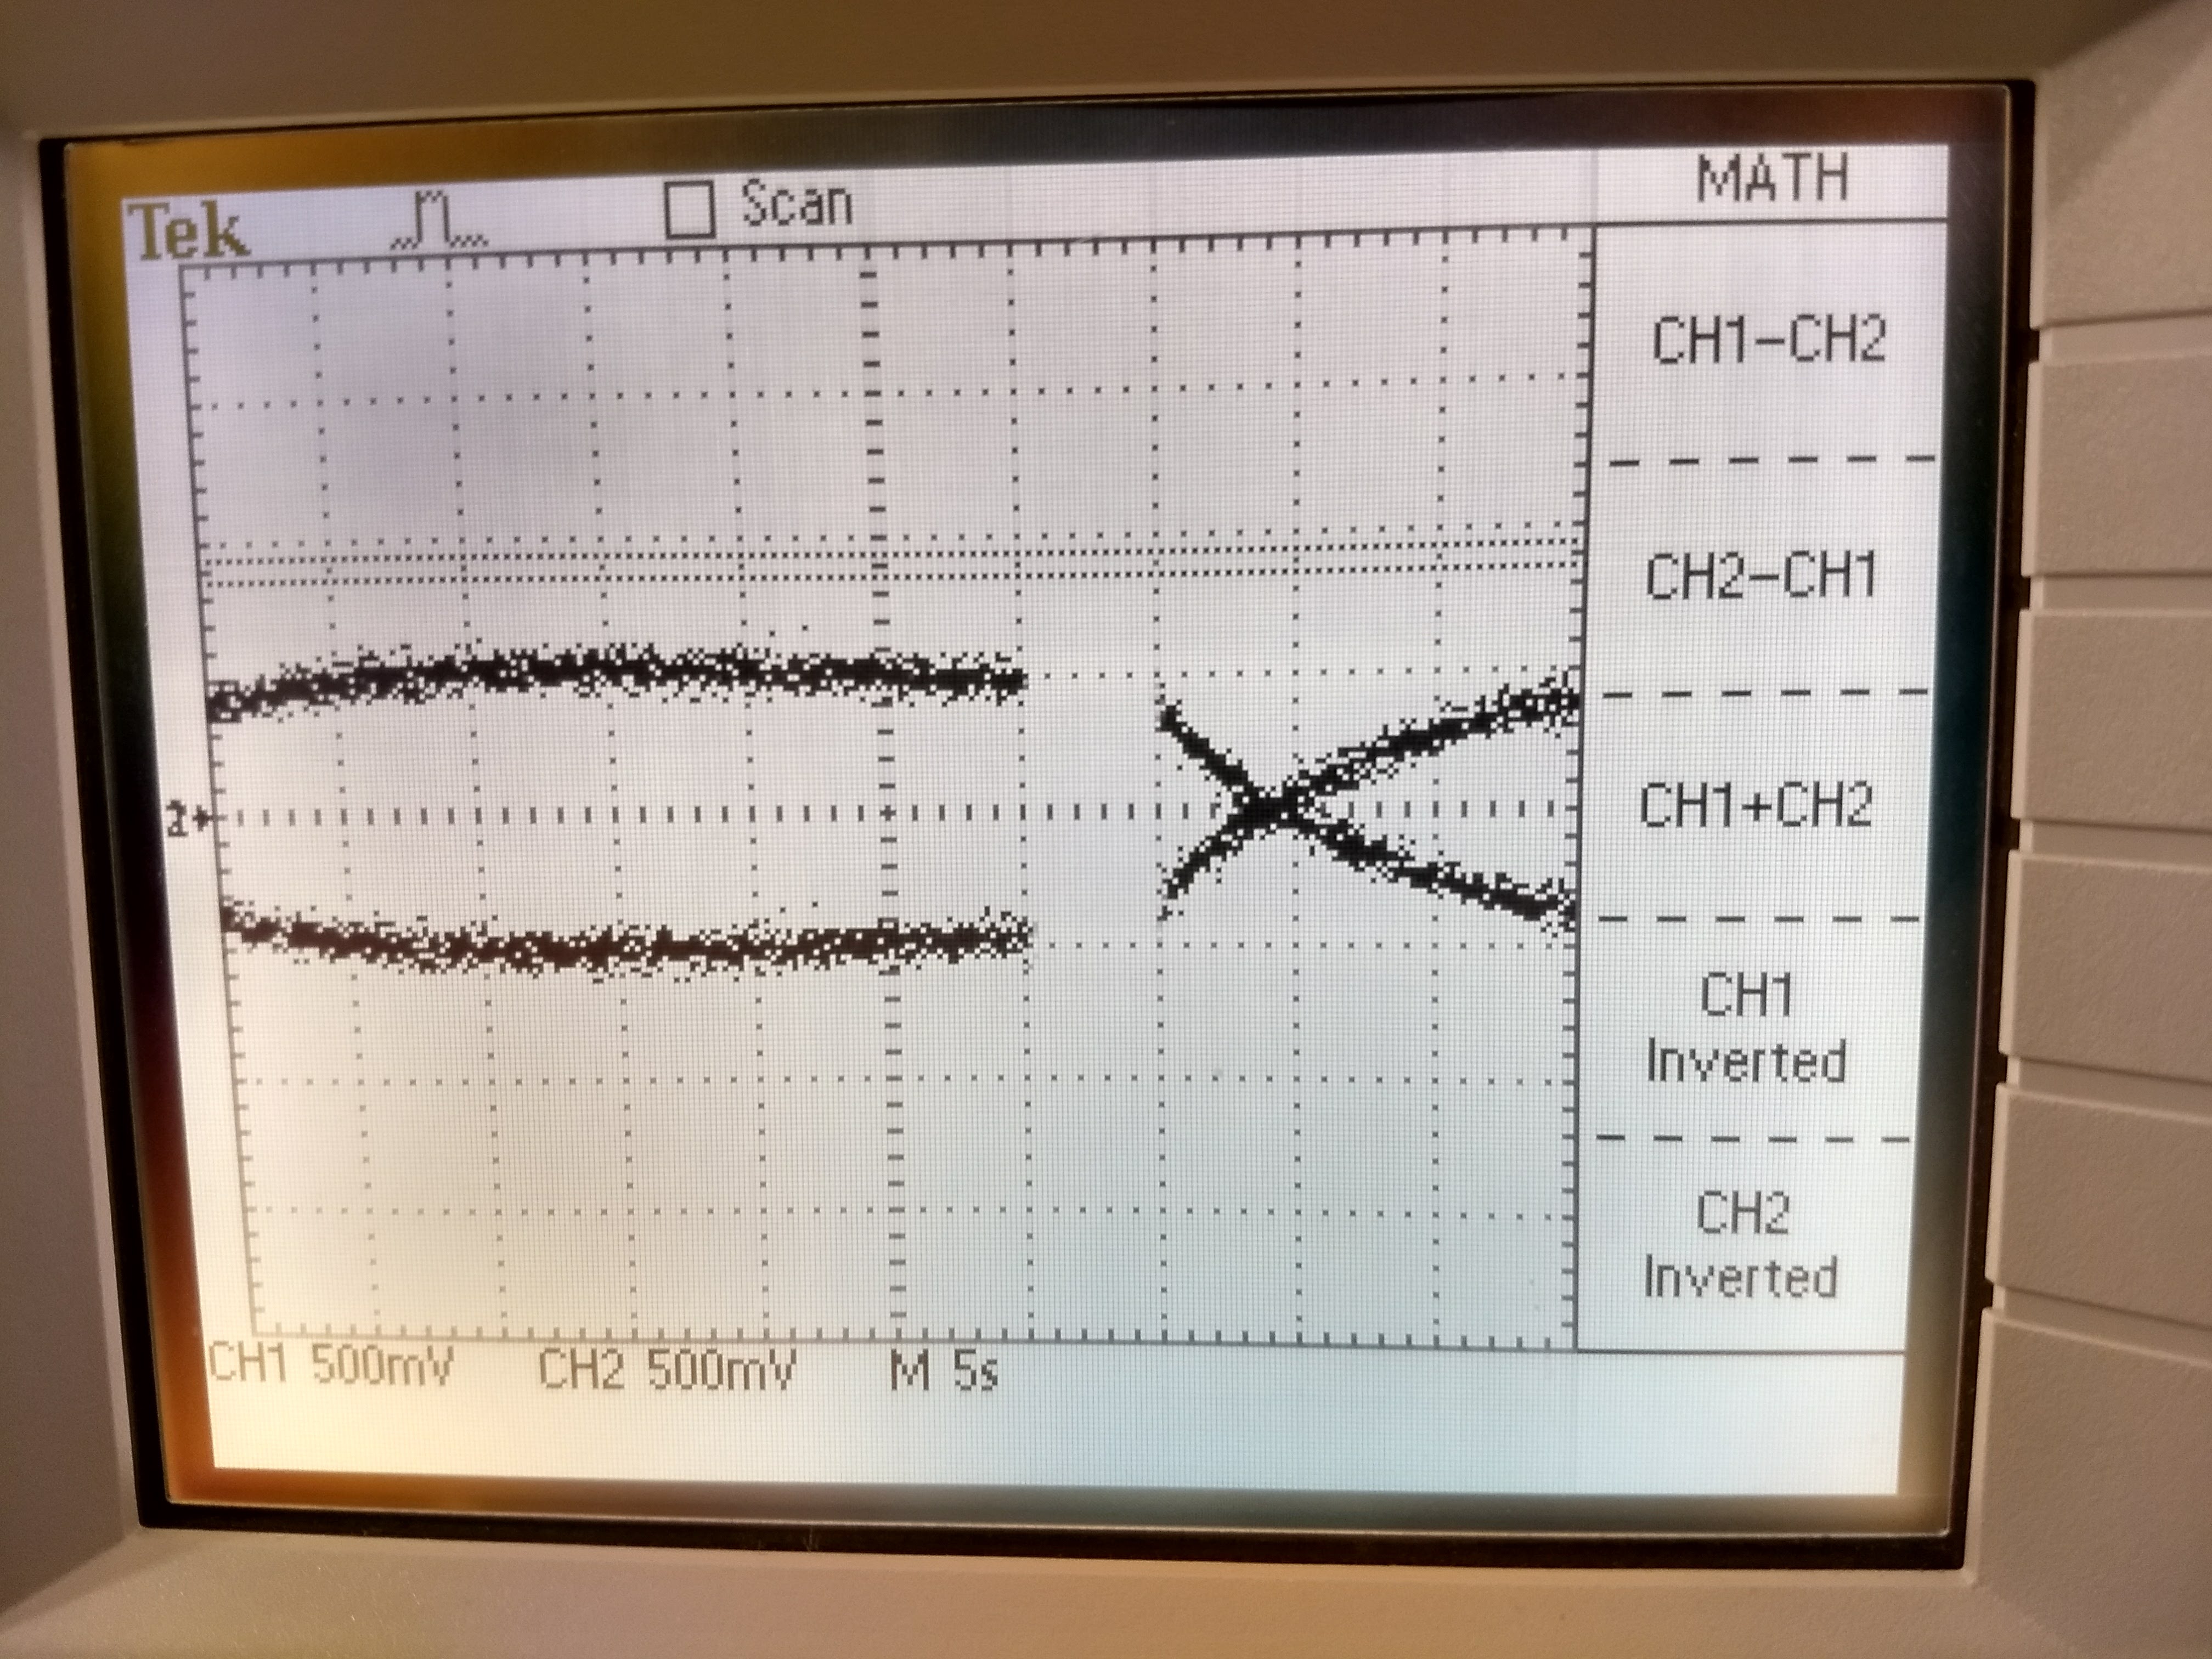
We also used a voltage calibrator to apply a DC voltage to the calibration plates, and measure the decay time of the voltage out of the EFM. The reason we checked this was to confirm the 1e12 Ohm resistor. The time constant of the RC circuit formed by the capacitance of the calibration-sensor plate (~7.6 pF), and the 1e12 Ohm resistor should be 7.6 seconds.
- Note that we were using larger spacers between the sensor plates and calibration plates as we (embarrassingly) lost track of the old ones, and so cleaned up and used the spacers from the first EFM, the capacitances were measured to be 7.8 pF from calibration plate to +X sensor plate, and 7.5 pF from calibration plate to -X sensor plate.
- We applied 3V DC continously to the calibration plates.
- The decay is shown in the 2nd photo, the two traces are the positive and negative x outputs (generally we do a differential measurement, this is not a very fancy scope). The decay time looks to me to be about 12 seconds (though it’s hard to tell since I can’t tell when exactly the voltage was applied, Crag can correct me here...), so perhaps our resistance is larger than expected.
Here are the results from the measurements Georgia described.
A couple of notes:
1) Our overall EFM noise is lower today than yesterday.
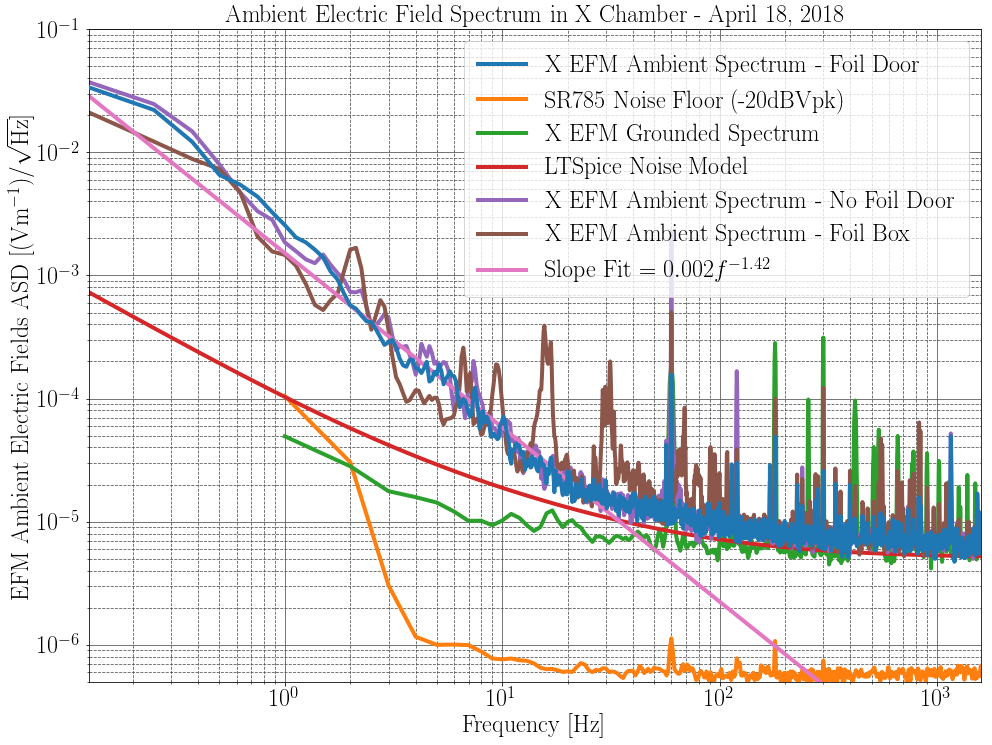
2) The EFM ambient electric field noise below 100 Hz still follows f^{-1.5}. It seems like it is sensor noise, but the LT Spice model disagrees.
3) Our different foil configurations did not affect the overall noise floor, only the height of the 60 Hz line and some (probably acoustic) resonances.
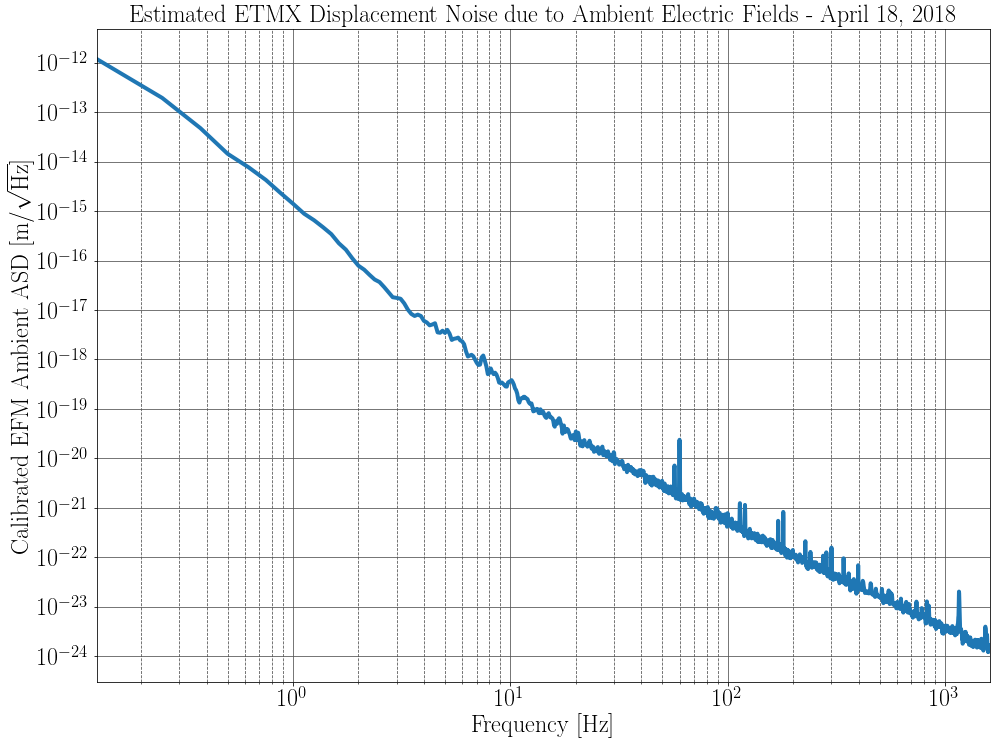
4) The estimated displacement noise in plot 2 relies on many assumptions (zero charge on test mass, true measurement of ambient electric fields near the test mass, correct calibration from volts to electric field) and is posted for discussion purposes.
Some differences from my last ambient electric field post alog 41483:
1) Included Rich's LT Spice model of the EFM circuit noise.
2) Updated the calibration from calibration volts to electric field. Estimated |E/V_Cal| ~ 38.9 (V/m)/V, based on the series capacitance between the calibration plate and the sensor plate (~11 pF), and the sensor plate to the grounded EFM body cube (~19 pF). This explains the increased EFM noise from alog 41483. Before I used |E/V_Cal| ~ 5 (V/m)/V, which I now believe is incorrect.
EDIT: After some notes from Sheila and Aaron Buikema, Plot 2 as it is is definitely untrustworthy. It relies on the force coupling F = q E, where E is the ambient electric field and q is the charge on the test mass. If the total charge on the test mass is 0, then F = 0, even with the ESD bias inducing a polarization on the test mass.
Reading the results of the RC decay experiment and the observation of a ~12 second time constant instead of the anticipated 7.6 seconds, I think the more likely conclusion is that the capacitance is larger than anticipated.  In an ideal world, the 10^12 ohm resistor has a 10% tolerance from the manufacturer.  Poor cleaning could certainly decrease the value of the resistor, but it seems unlikely that the resistor would be almost 60% higher in resistance.

I wonder if the assumed capacitances are accurate?  Was the 3V stimulus removed such that the calibration plate was no longer attached to the voltage source, or was the voltage stepped from 3V to 0V leaving the source still attached?  I have a picoammeter here at Caltech and I will try to establish the accuracy of the resistors.
In answer to your questions Rich - I'm not sure how reliable the capacitance measurement is. We measured this a couple of times with the tweezers in chamber, and the capacitance didn't fluctuate between measurements, but I don't have a sense of the reliability of these things. We left the source attached and stepped between 3 V and 0 V charging and discharging the capacitor. It would be interesting to confirm the resistance in the lab there.