Alexei, TVo
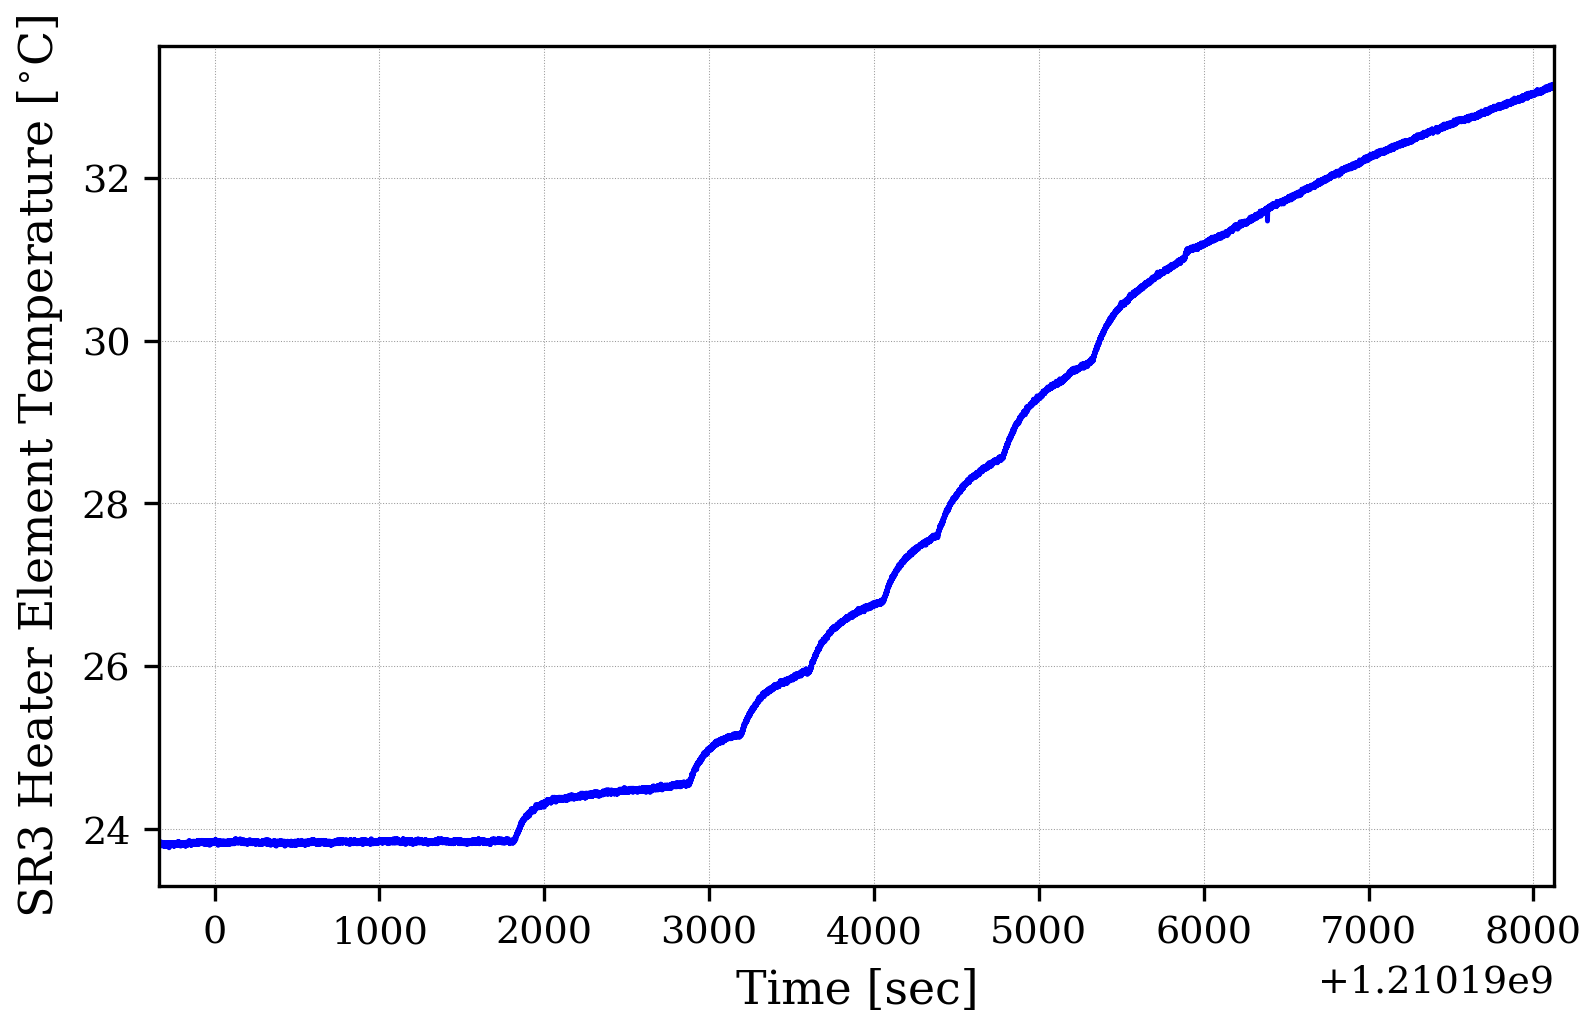
Ran a measurement OMC mismatch from of single-bounce beam (off of ITMX) as a function of SR3 heater temperature.
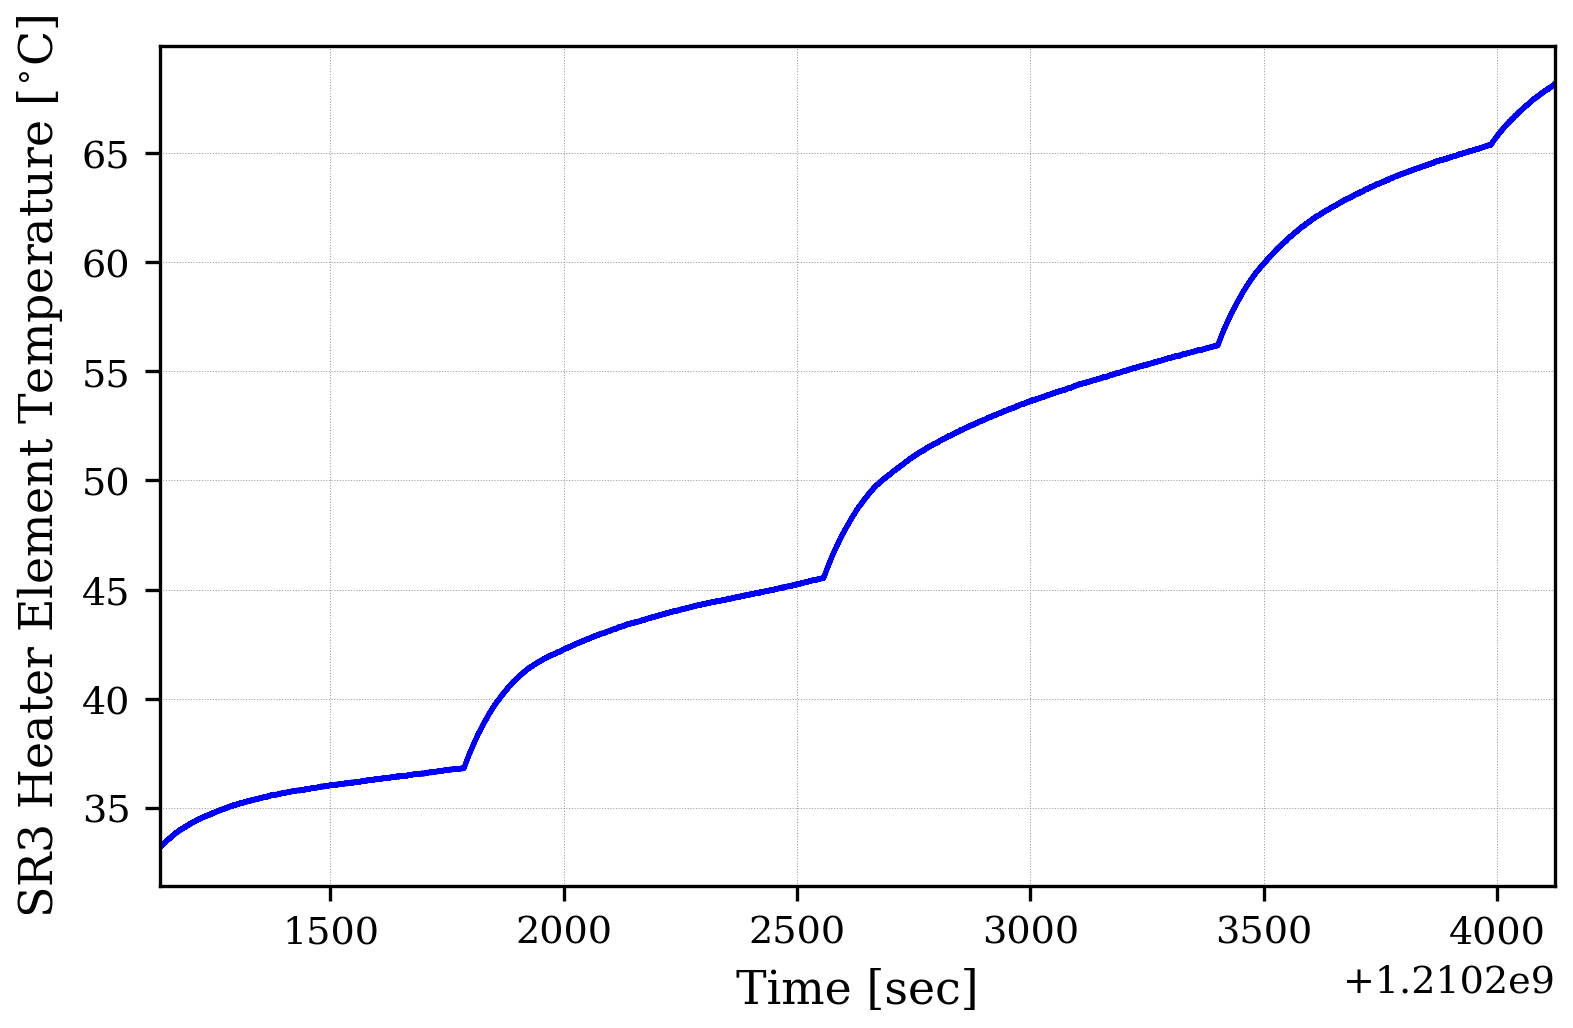
The power to the SR3 heater was gradually ramped from 0 W to 5 W (corresponding to a temperature range of 25 C to 70 C) over the course of several hours to account for the SR3 time constant (about 15 minutes according to G1501373)
The OMC was scanned by applying a sawtooth ramp voltage to PZT2_EXC with a period of 20 seconds and amplitude of [0,120] counts.
There were also some OMC alignment loops that were closed during the scan (AS_A, and AS_B?) (I'm sure TVo will correct me if I'm wrong).
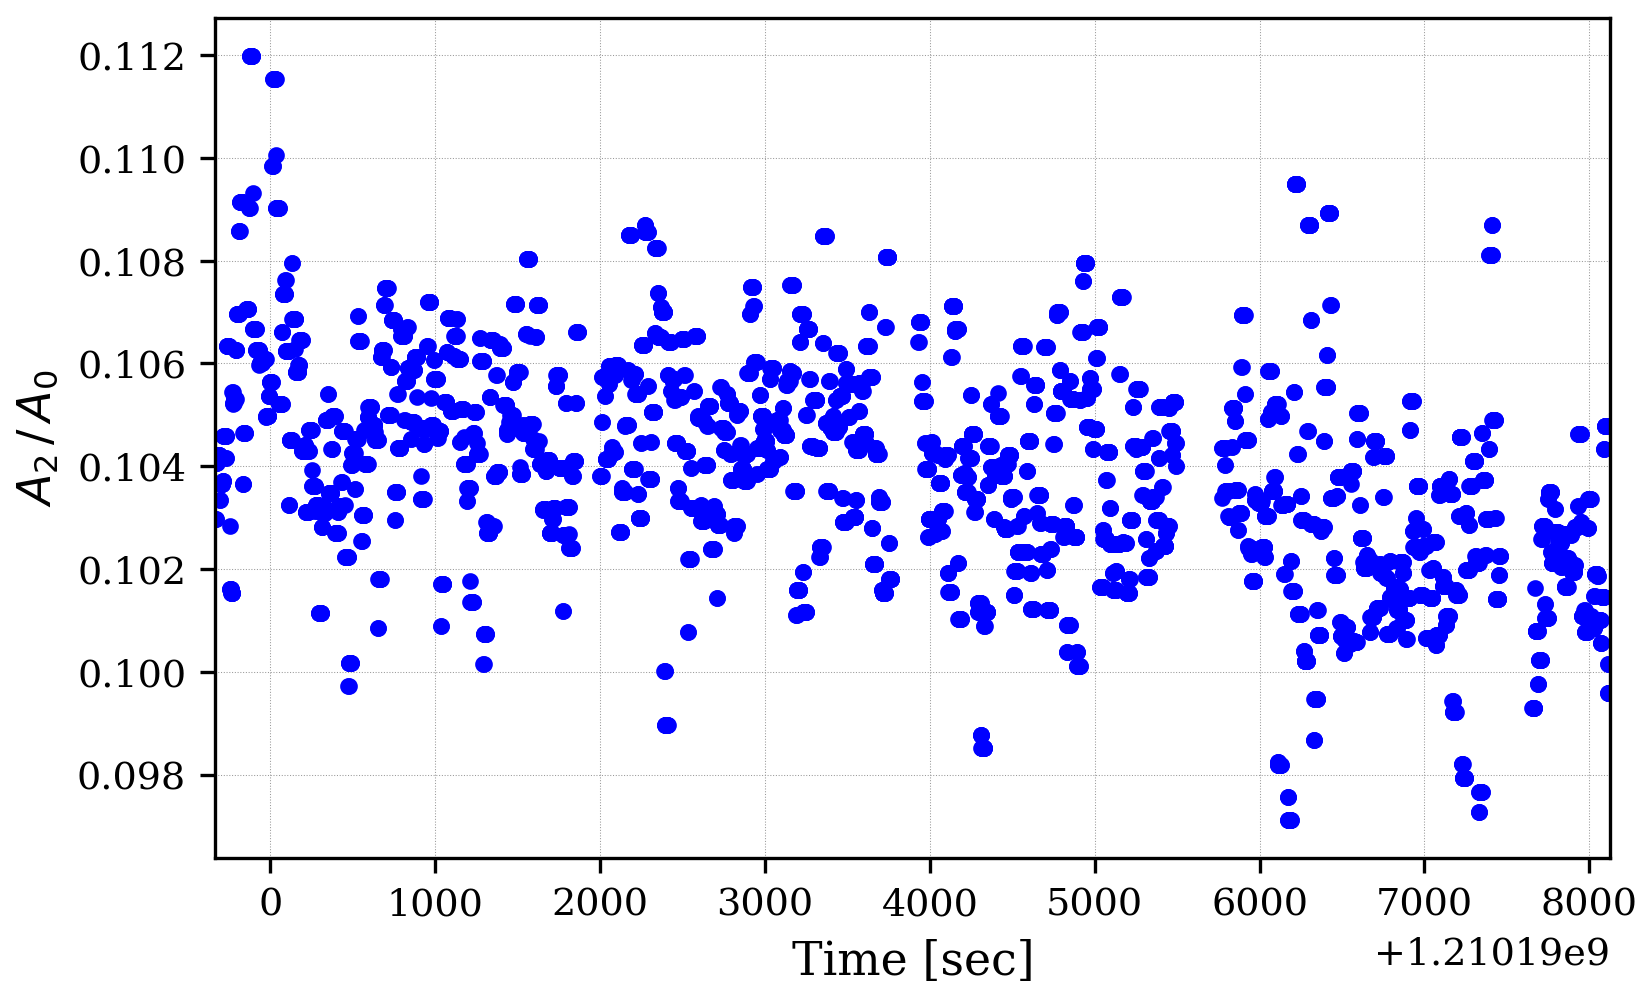
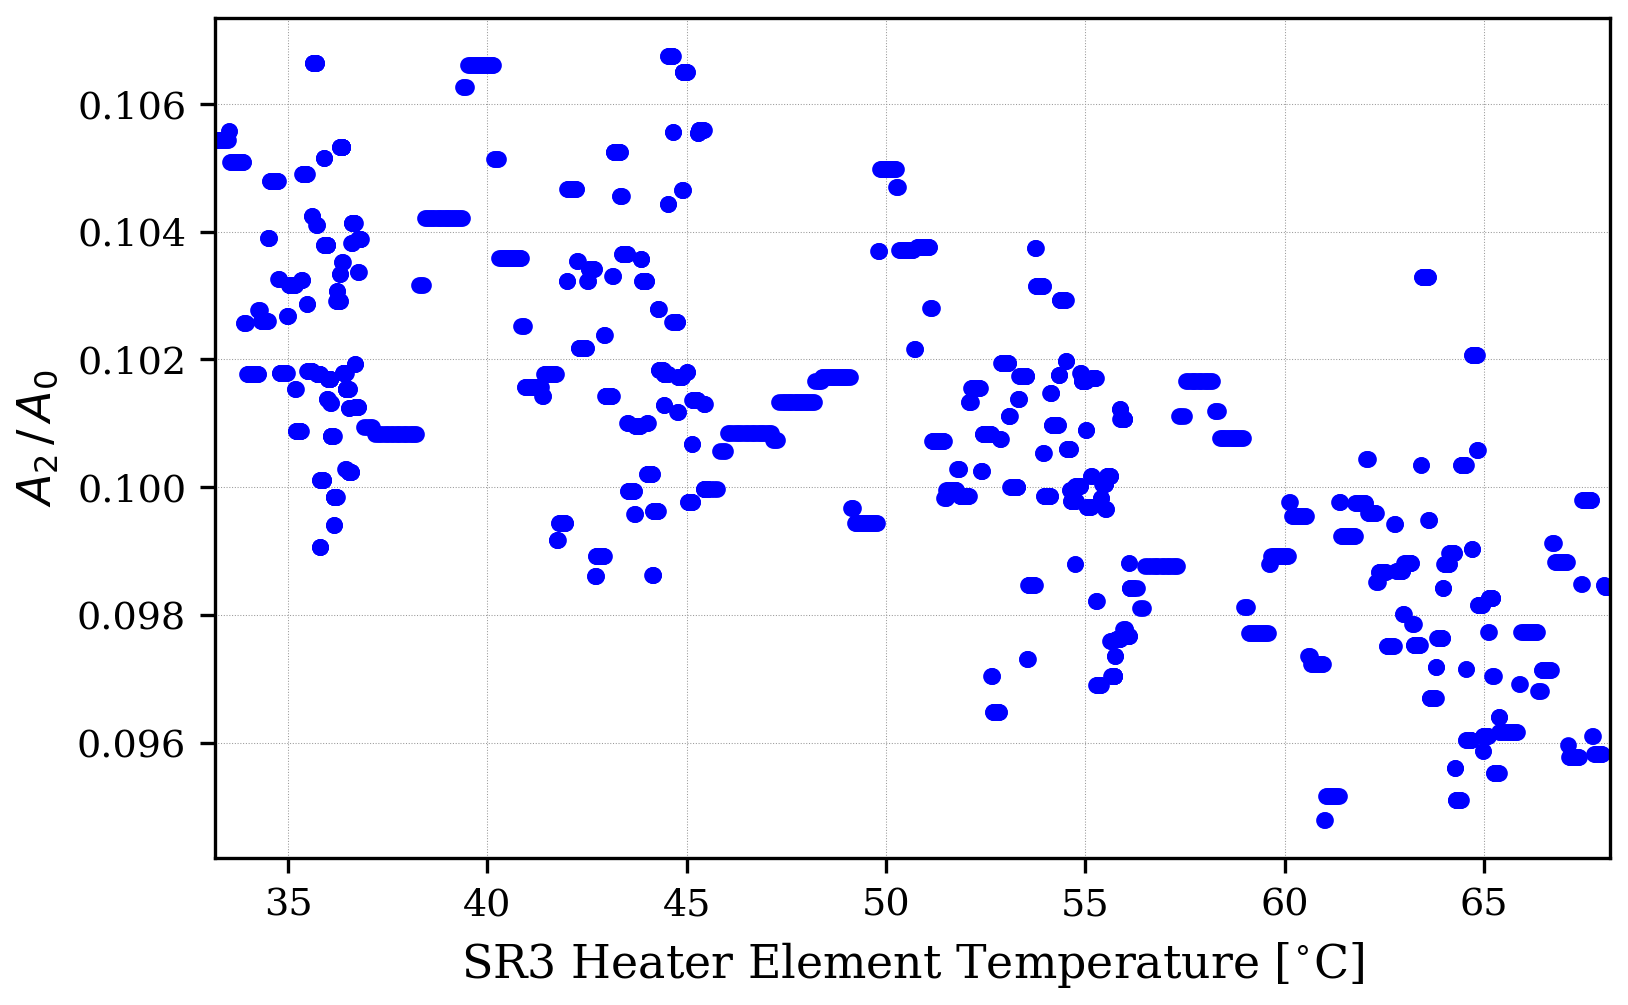
The mismatch was computed by measuring the ratio of the second order peak to the zeroth order peak. The mismatch data was taken by an OMC scan analyzer tool that I've been developing, which tries to track the zerorth and second order peaks
in time by essentially plotting the PZT2_EXC channel against the AS_DCPD channel. I will upload the tool on gitlab and pypi hopefully sometime soon when it can be used without needing me to watch over it.
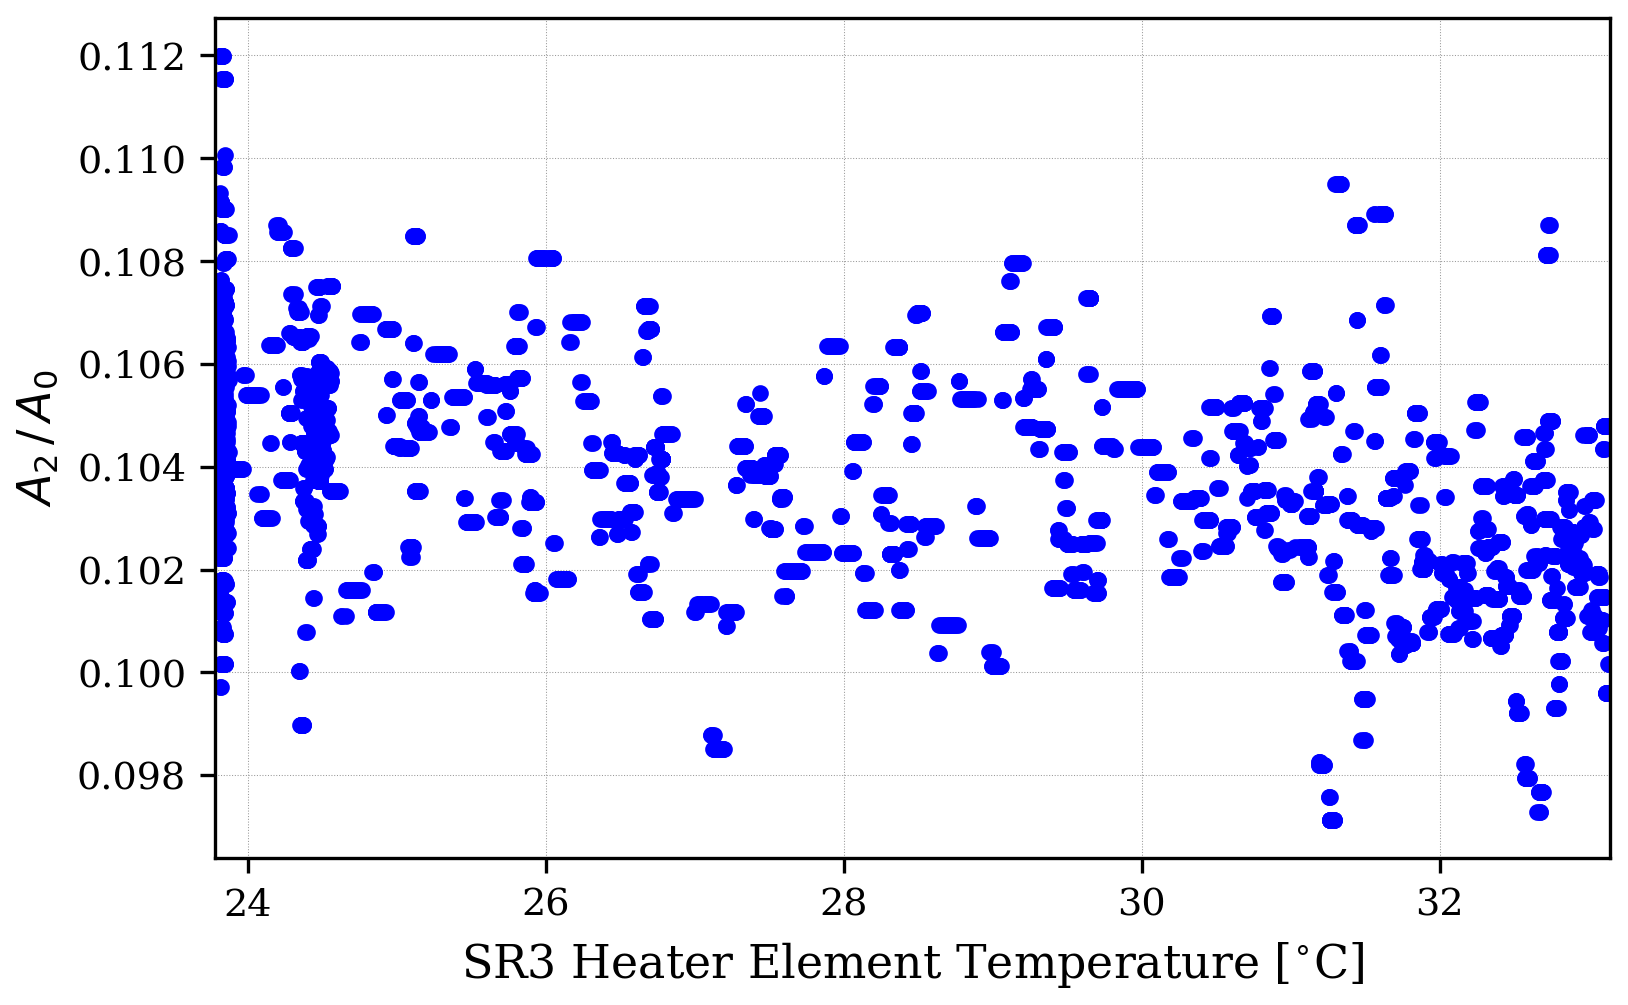
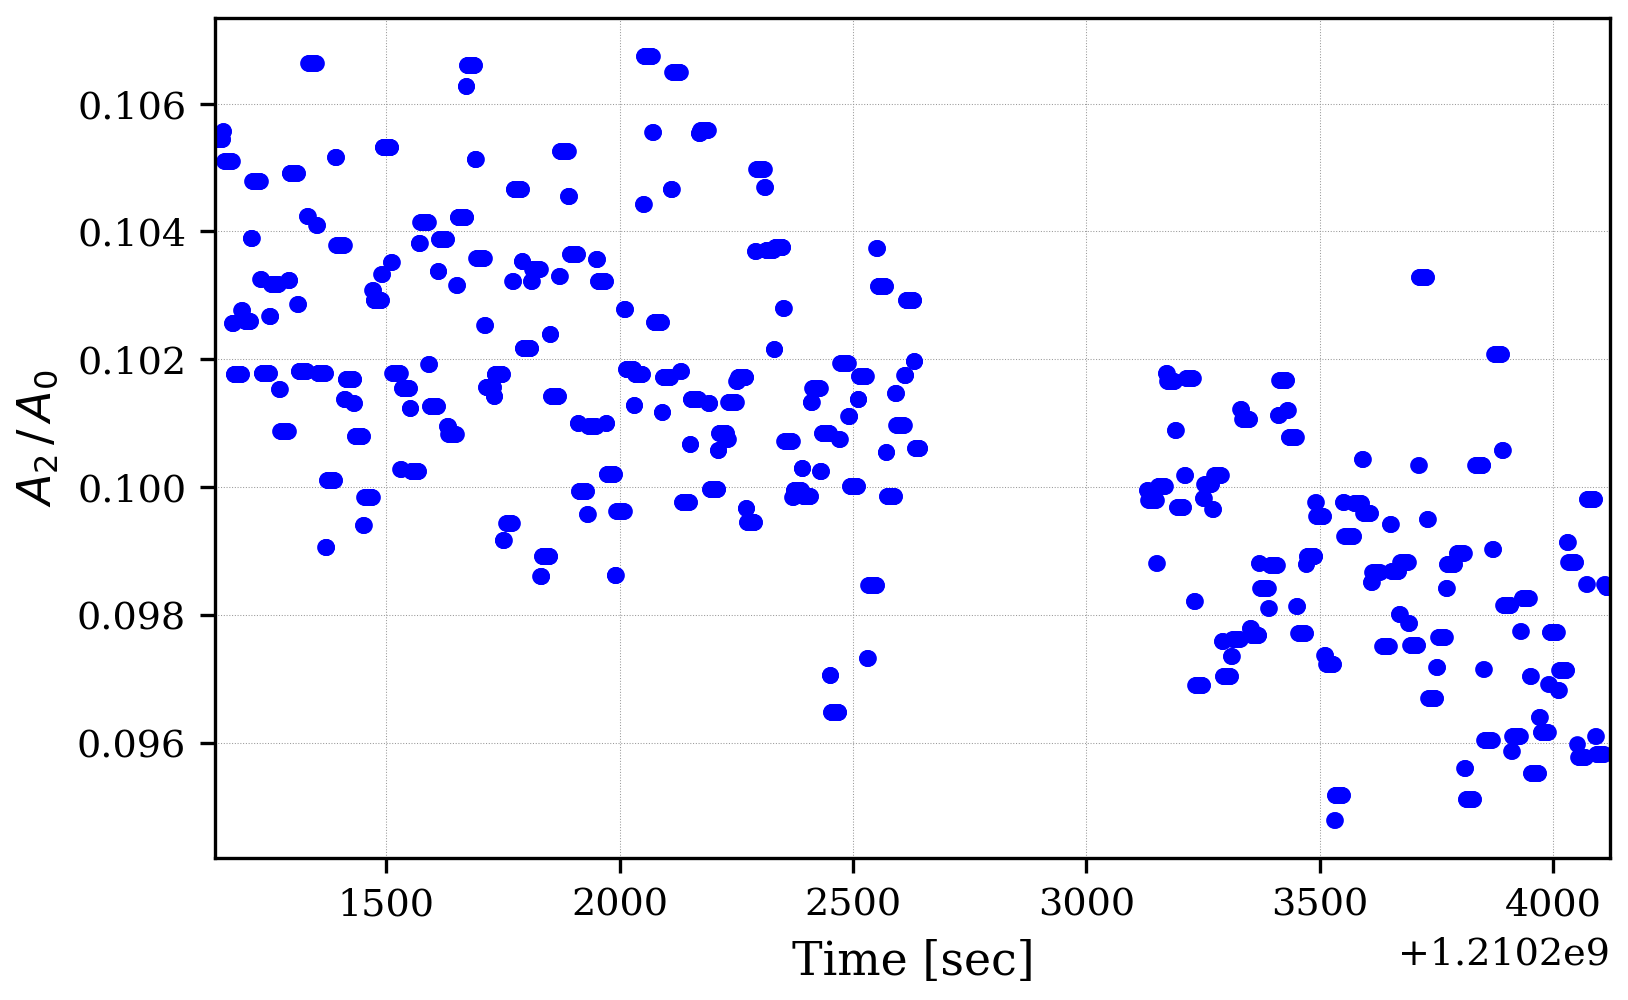
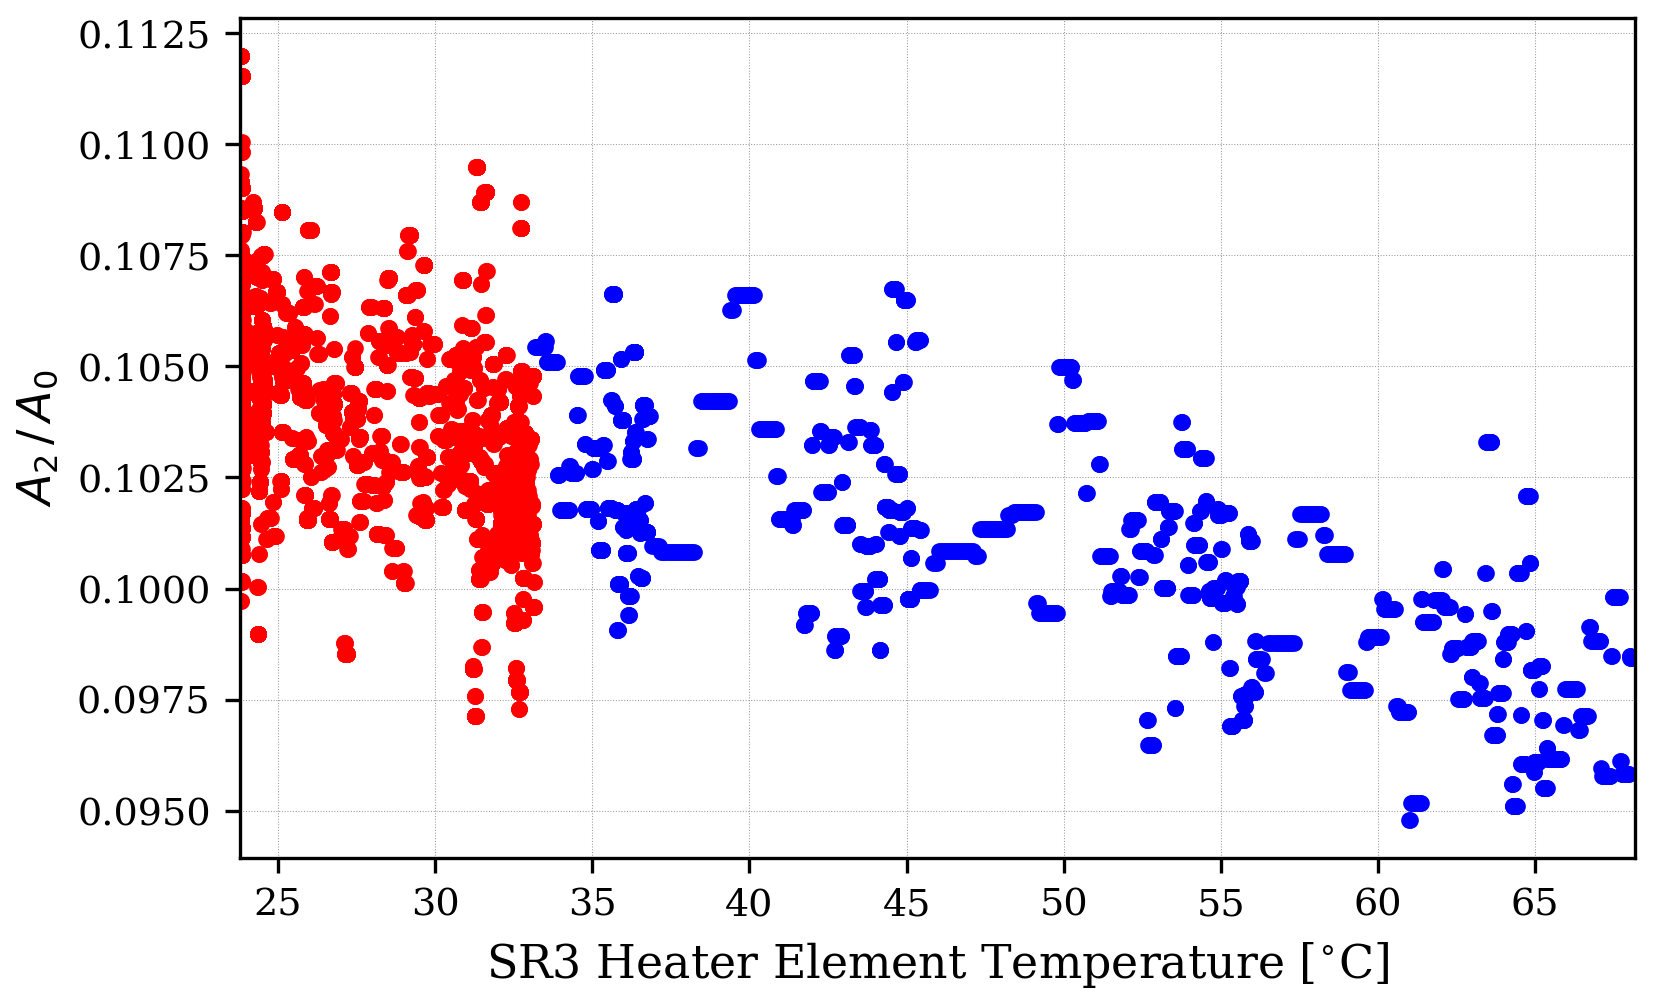
The final plot ( m_vs_temp_1_2.png ) is the summary of the measurement, which is a combination of two sets taken about an hour apart. The mean mismatch managed to drop by about a 1% over a 40 C change, with a fluctuation of about 1% for any given temperature. I'm not really sure why the mismatch data is so noisy (I confirmed that the tool was correctly tracking the heights of the peaks). I was also unsure what temperature load the SR3 heater could sustain ( G1501373 says that either 10 W (emitted?) or 87 C is the max).
I will investigate the single-bounce models of the IFO to see if the mismatch change is what we expect.

Just finished crunching the single bounce model of the SR3 actuator. Plot attached.
Plot was generated from the LHO FINESSE model with the most up to date measured parameters (found here).
The OMC eigenmode of this model was computed then back-propagated to the SRM AR surface.
A sample of beam parameters that are mismatched to the OMC eigenmode by 10% (i.e points that lie on the 10% contour in the plot) were generated following the method in T1800193.
Each beam parameter was then back-propagated to the BS.
The SR3 RoC change was varied between 0 mm and 32 mm and the beams were forward-propagated through the changed SR3 all the way back to the SRM AR surface.
All of the resulting beam parameters from this procedure are shown on the plot.
I've also plotted the most recent measurement I could find on alog of the single bounce beam parameter.
From the plots on the post that I originally posted we can see that the mismatch imporves by about 1% over roughly a full SR3 actuation range. This combined with the information that our initial mismatch is about 10% puts us somewhere in the lower right corner on this plot.
My guess is that the observed astigmatism in the single bounce beam probably makes SR3 heater actuate on the mode differently to what I've modeled. I might look into performing the same analysis but factoring in astigmatism, but right now I don't know how to carry that out. Adding another degree of freedom (the other transverse axis) makes this difficult to conceptualize as a plot.

I've been asked to provide the code for the actuation maps. The notebook for generating the SR3 actuation map is on ligo gitlab linked here.
The only real dependency for this code should be the latest commit of pykat (15/05/18 or later). Let me know if this doesn't work, doesn't make sense, or is somehow wrong.