[ Alexei, Dan Brown ]
The jupyter notebook for all the relevant calculations is on the LIGO git.
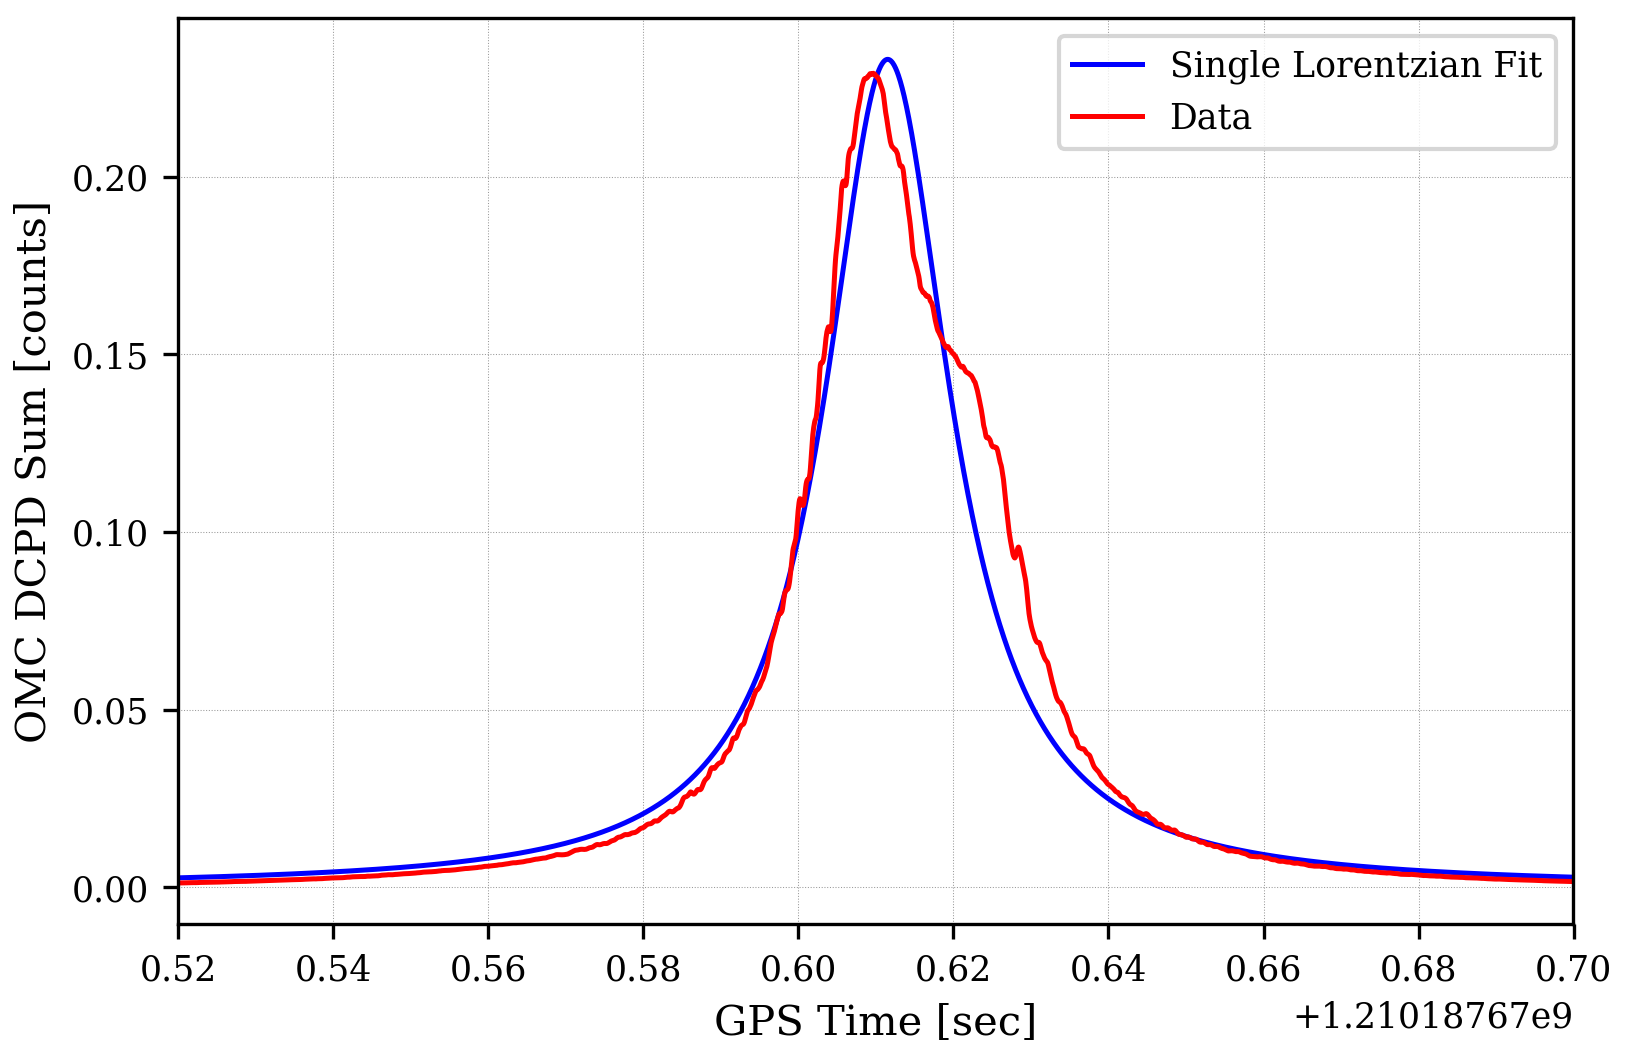
I noticed an odd shape of the second order resonance (can be seen in single_fit.png) in the OMC scans related to the SR3 heater testing. This shape was very consistent between scans and only seemed to show up on the second order mode. Recent beam scan measurements [ alog 41683 ] have shown that the beam could be significantly astigmatic, thus influencing the shape of the second order resonance.
Fitting 2 lorentzians to the peak
To test out the hypothesis I tried to fit two lorentzians to the second order peak (corresponding to the TEM02 and TEM20 modes).
The following model was considered
model = a1 * L(t,fwhm,t0-df) + a2 * L(t,fwhm,t0+df)
Where
L(x,fwhm,x0) = 1 / (2 * pi) * fwhm / ( (x-x0)^2 + (0.5 * fwhm)^2)
is the lorentzian function
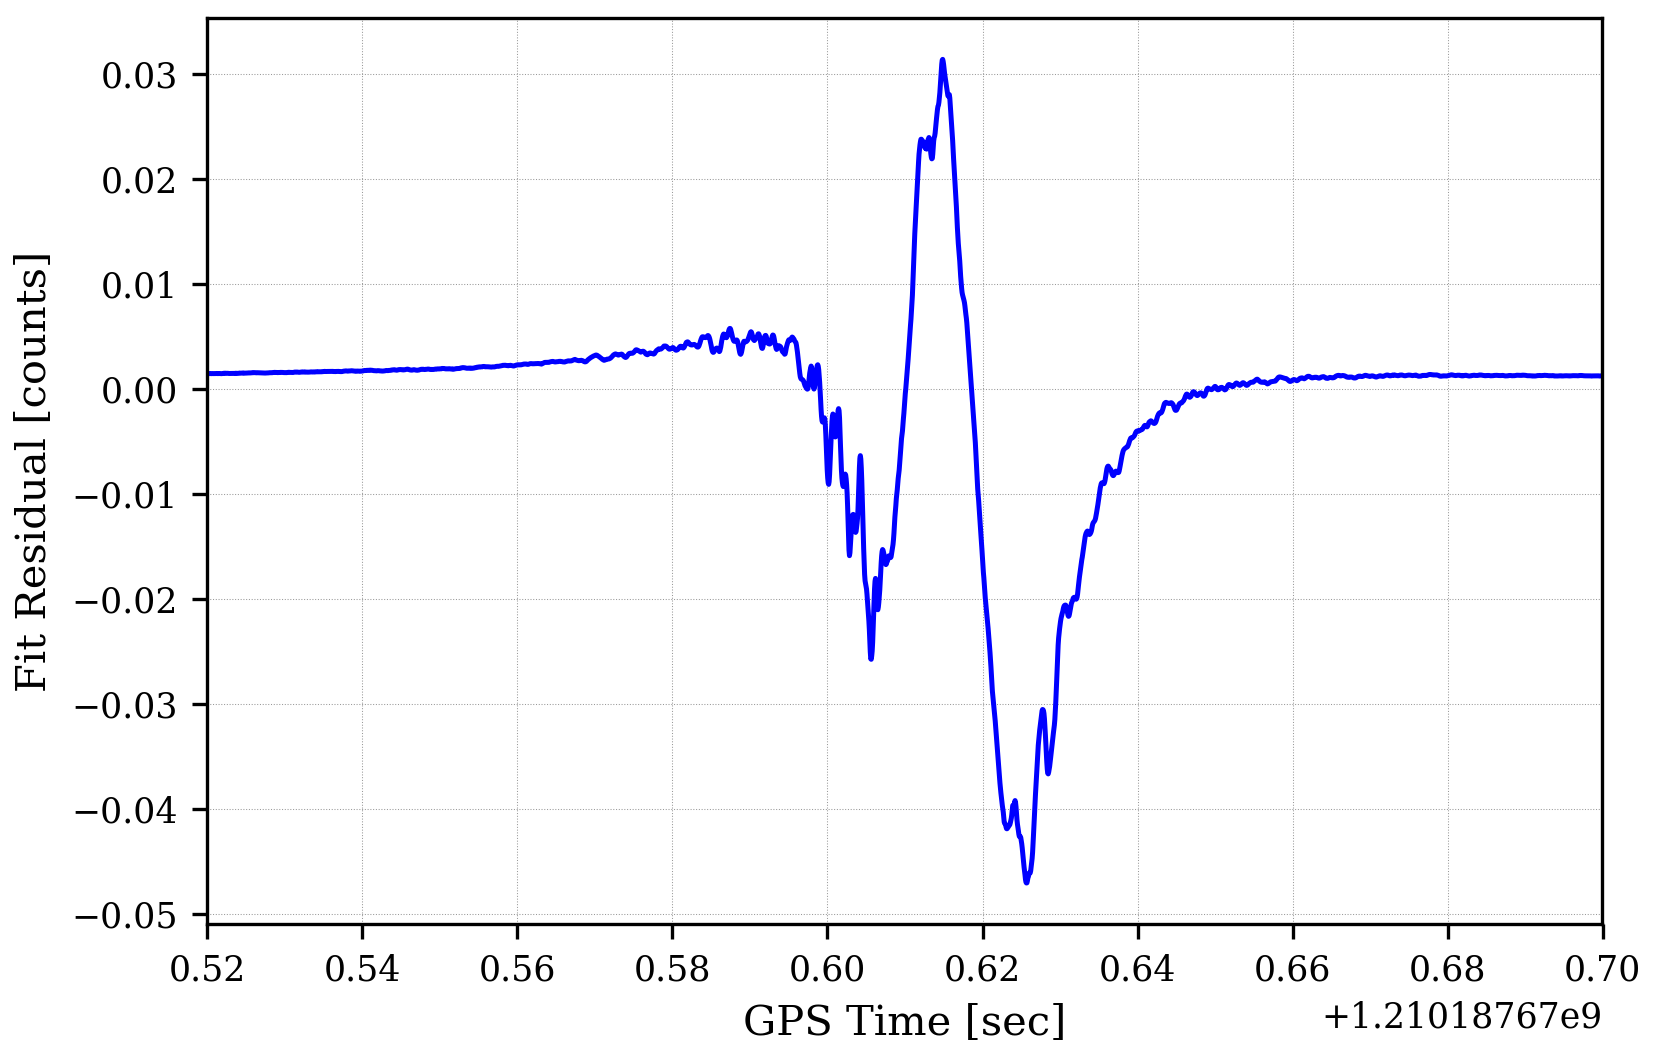
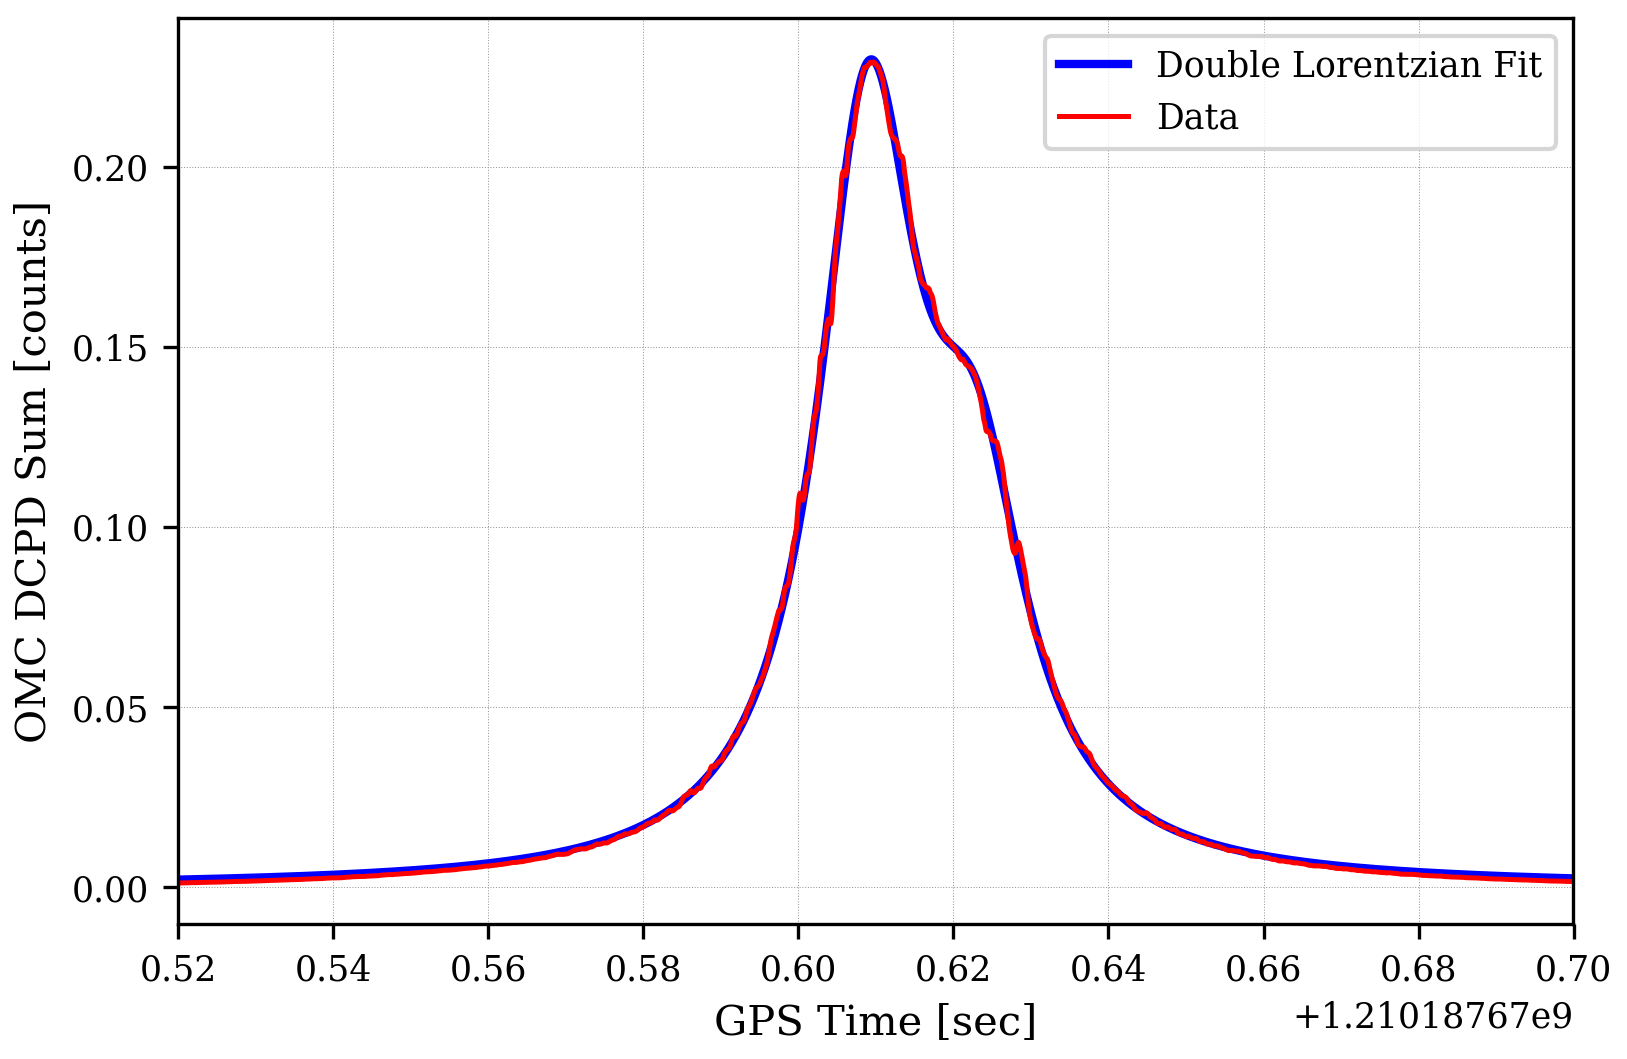
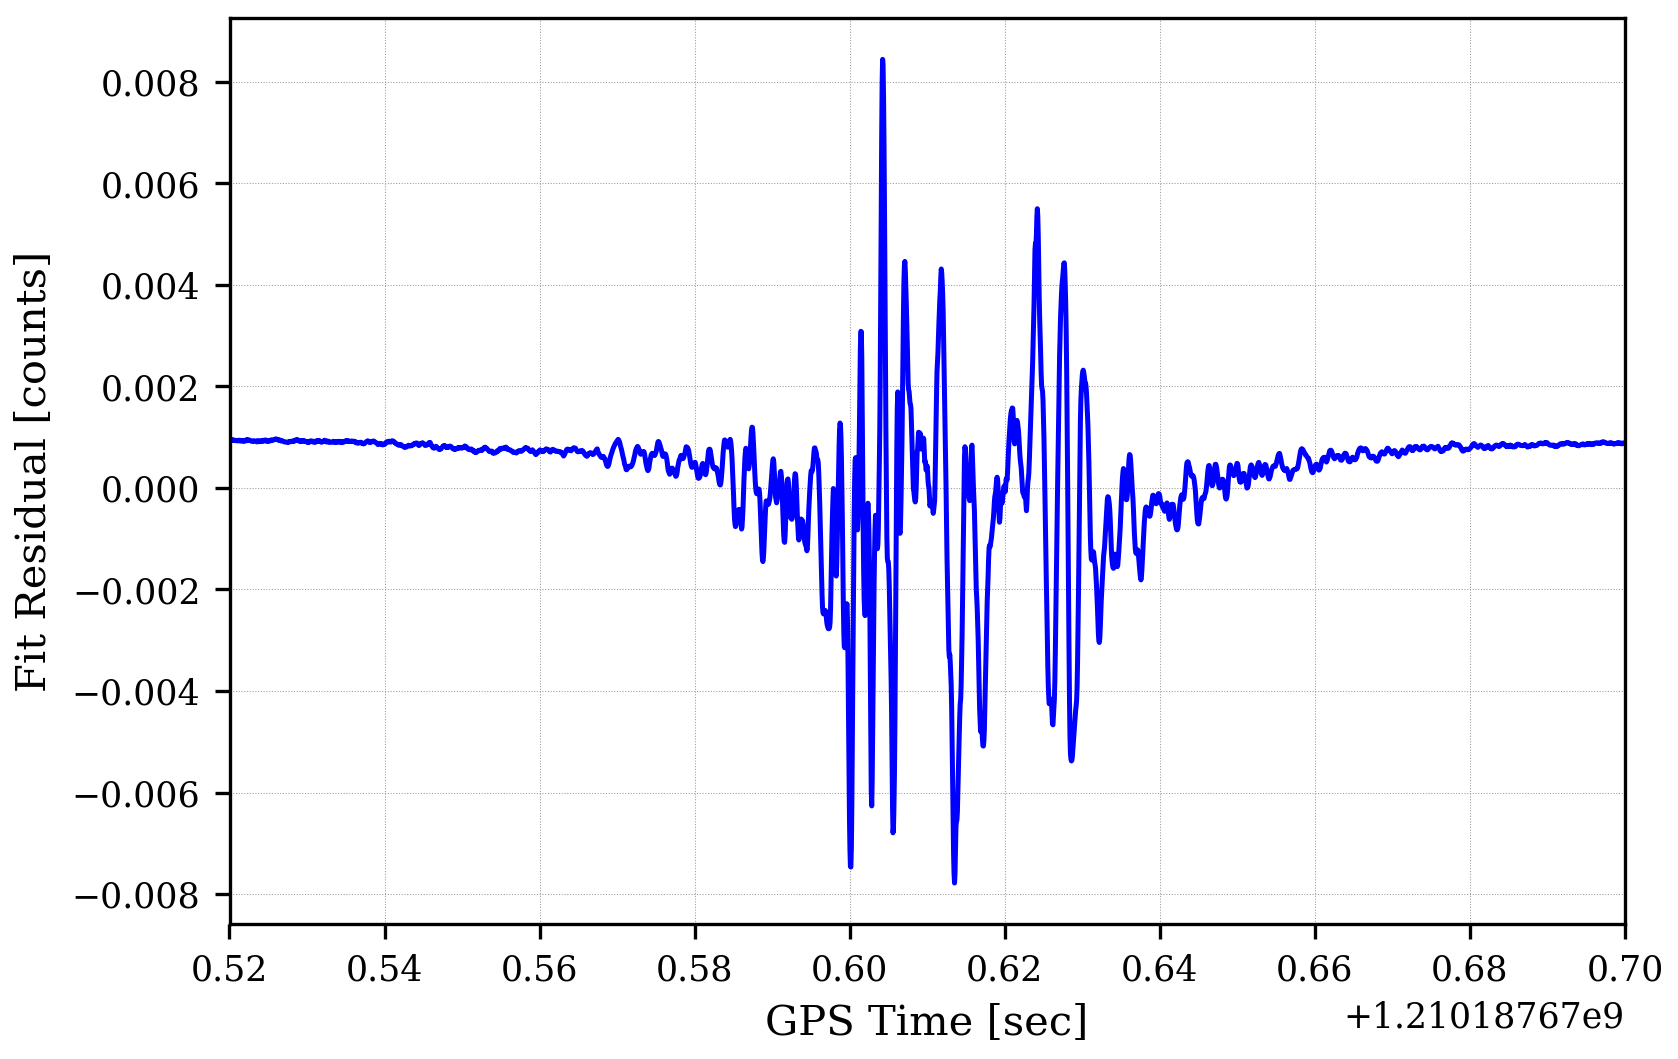
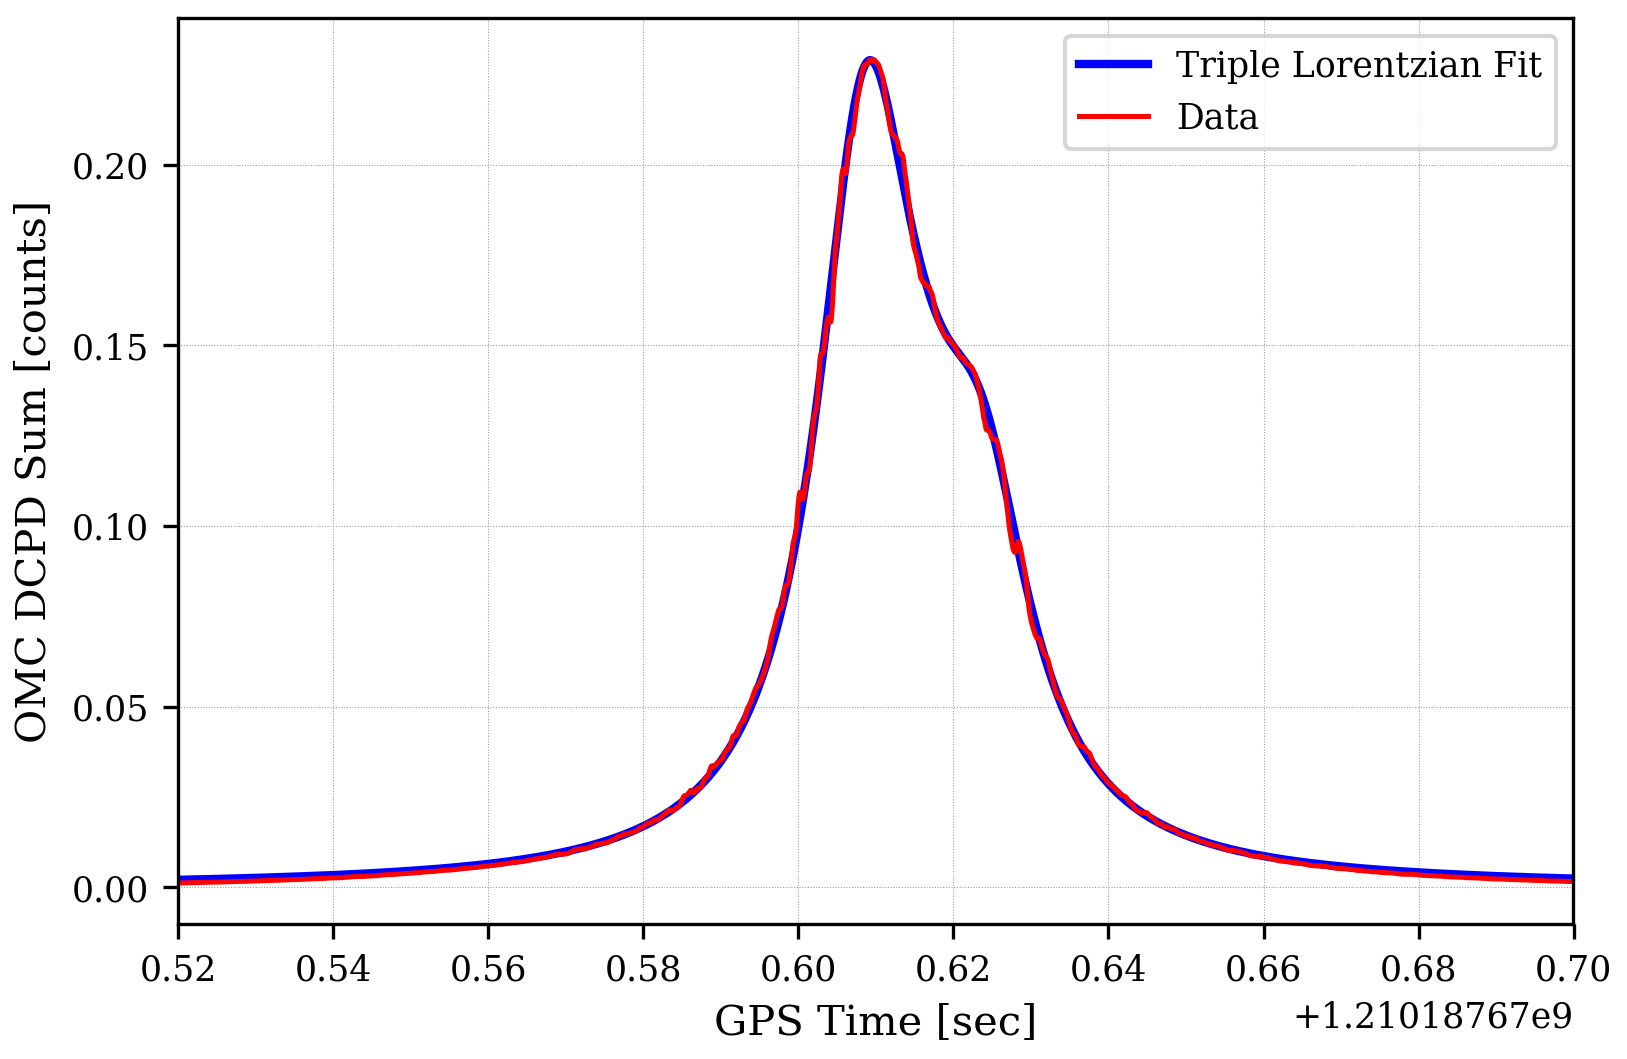
The fit was performed by using Nelder-Mead to vary [ fwhm, a1, a2, t0, df ] to minimise [ sum(abs(data-model) ]. The resulting fit seems good as can be seen on double_fit.png and double_fit_residual.png.
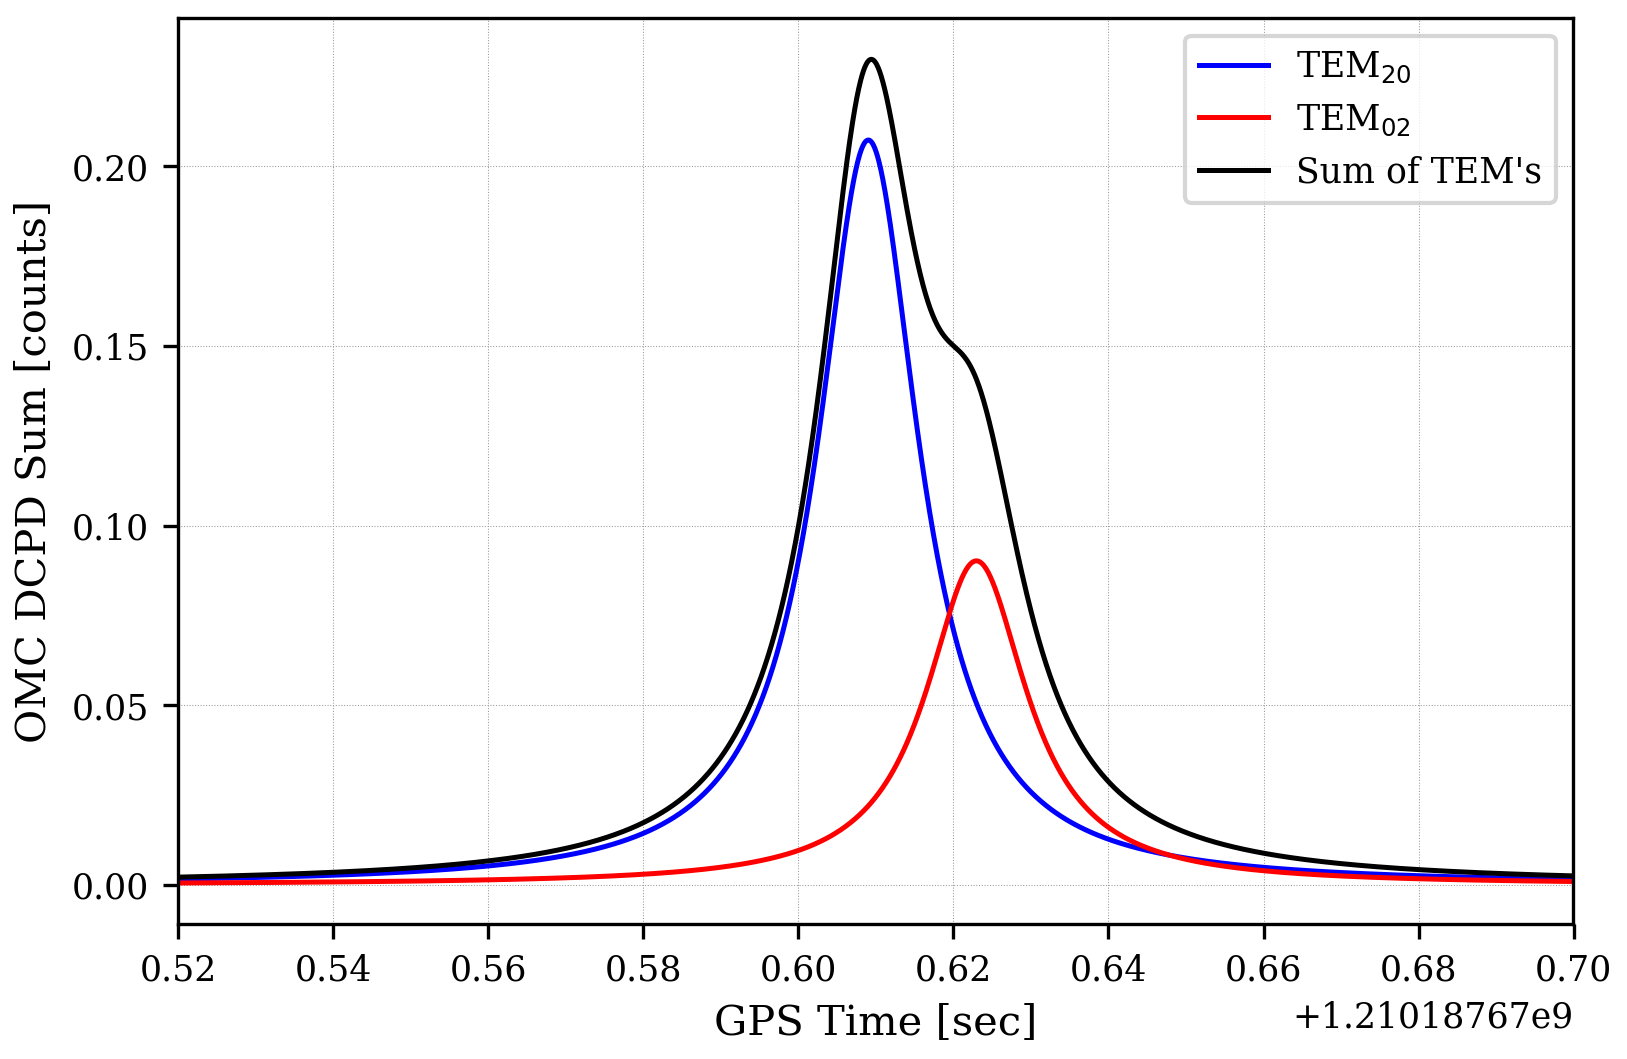
The model returns the power of the second order modes as
P_20 = a1 * 2 / (pi * fwhm)
P_02 = a2 * 2 / (pi * fwhm)
Numerically the values are P_20 = 0.21 and P_02 = 0.09, which correspond to a mismatch of 13.7% [ using (P_20 + P_02) / P_00 ], where P_00 was measured separately as 2.17 from the same scan.
Note that the naive way of measuring mismatch [ P_2/P_00 ] gives 10.7% or 13.2% if the correction factor of 1.23 from [ alog 41679 ] is applied, where P_2 = 0.233 is the maximum value of the second order peak.
Using the expression for the power loss of due to mismatch from an astigmatic beam [Eq 21 in T1800165-v2 ] we get 13.9% of power loss.
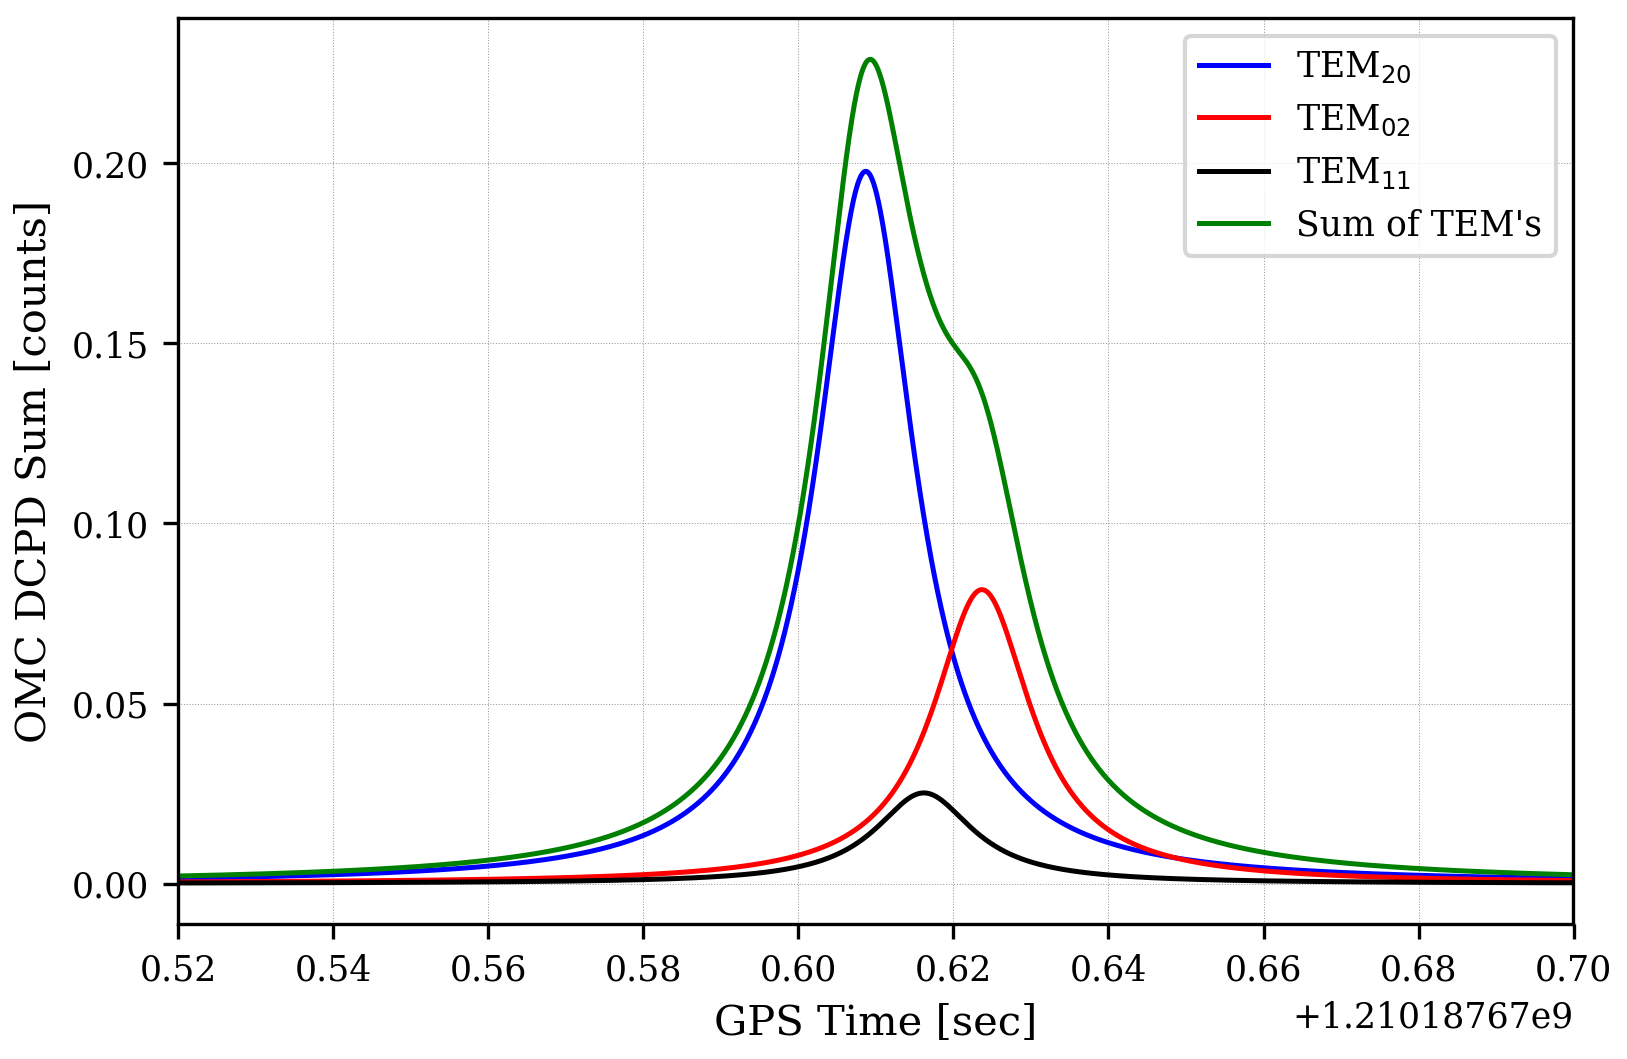
Fitting 3 lorentzians to the peak
The full description of the shape of the second order peak also has to include the contribution from the TEM_11 mode, which resonantes between the TEM_20 and TEM_02 modes. This can be modelled by adding
another lorentzian. The model is now
model = a1 * L(t,fwhm,t0-df) + a2 * L(t,fwhm,t0+df) + a3 * L(t,fwhm,t0)
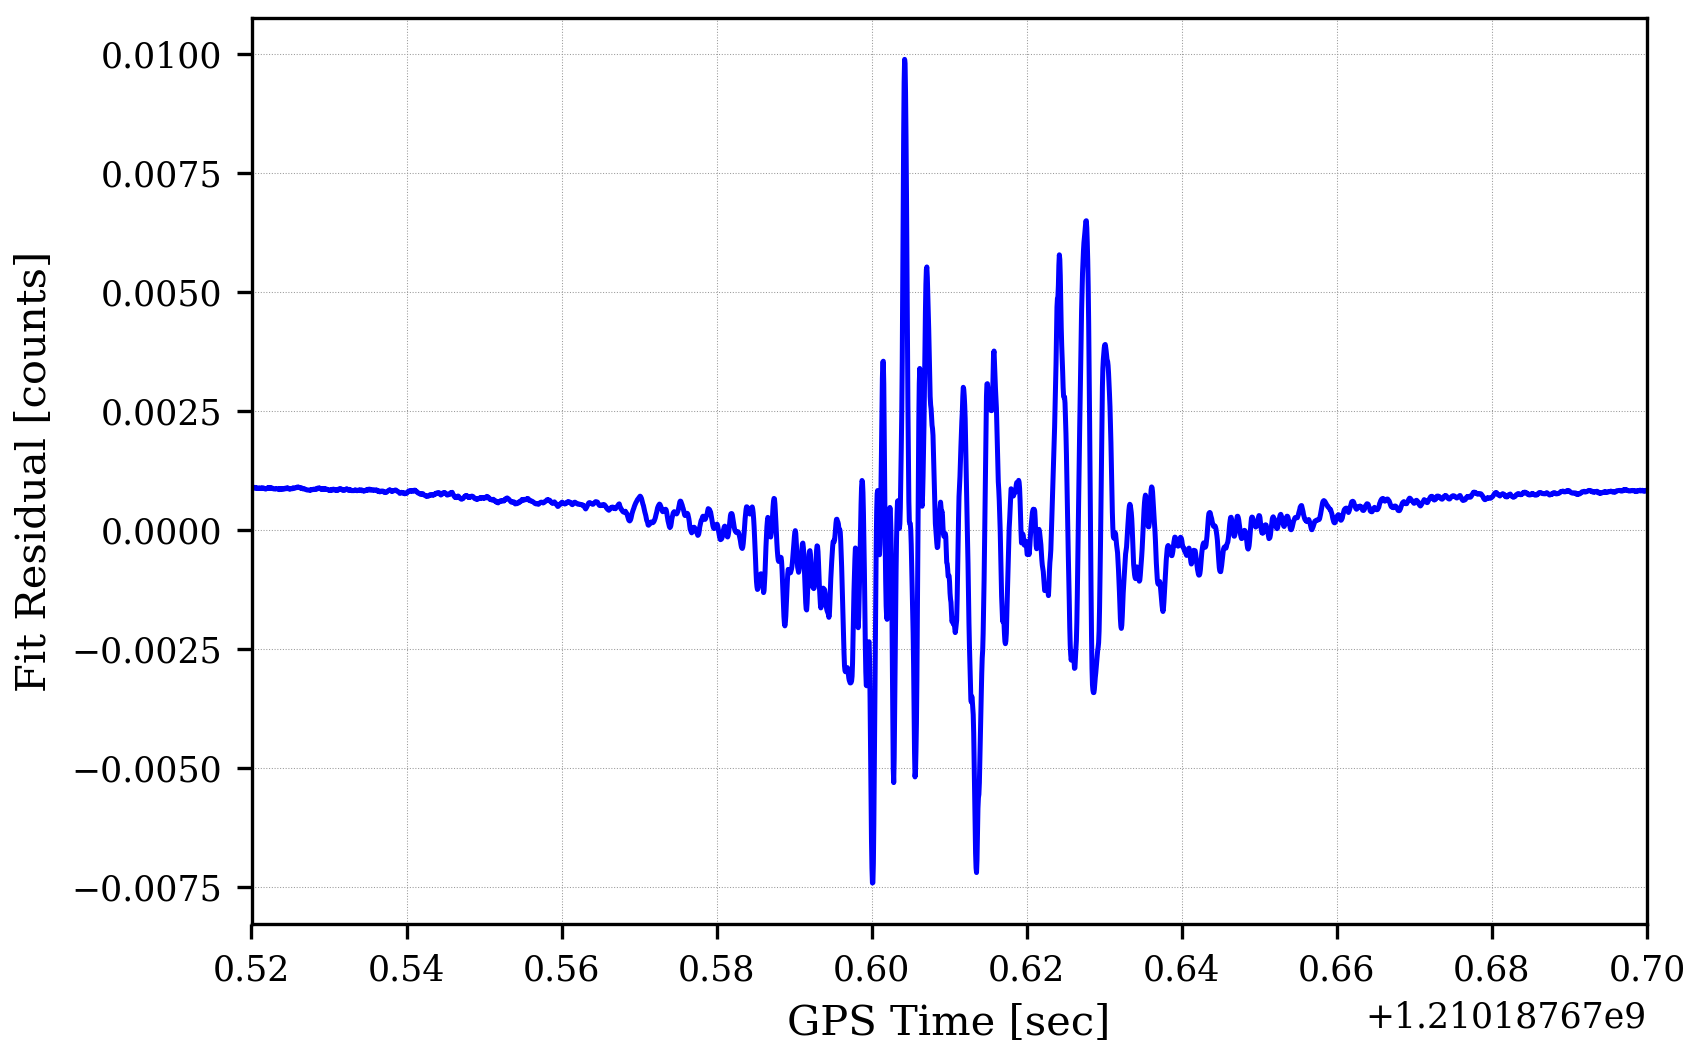
Where Nelder-Mead tries to minimise the sum of the residual between the model and the data by varying [ fwhm, a1, a2, a3, t0, df ].
The resulting fit is only marginally better, which can be explained by the fact that the allignment loops for the OMC were closed (TEM_11 amplitude mostly couples through misalignments).
The resulting mode intensities are given by
P_20 = 0.199
P_02 = 0.0824
P_11 = 0.0252
The mismatches are
(P_20+P_02) / P_00 = 12.9%
1-sqrt( (1 - 2 * P_20 / P00) * (1 - 2 * P_02 / P00) ) = 13.0%
So accounting for the TEM_11 peak drops the mismatch by about 1%.
Concluding remarks
Special care has to be taken with the fitting as I've found the results can vary wildly depending on the minimizing routine used and the initial conditions of the fit. I don't have enough faith in these fitting algorithms for them to be able to
work robustly without oversight.
It looks like one can extract information about the astigmatism of the beam going into the OMC from OMC scans (contrary to what I may have claimed before) by carefully fitting lorentzians to the measured second order peak.
This may be useful in hunting down and remedying the unkown source of the astigmatism that has been plaguing us.