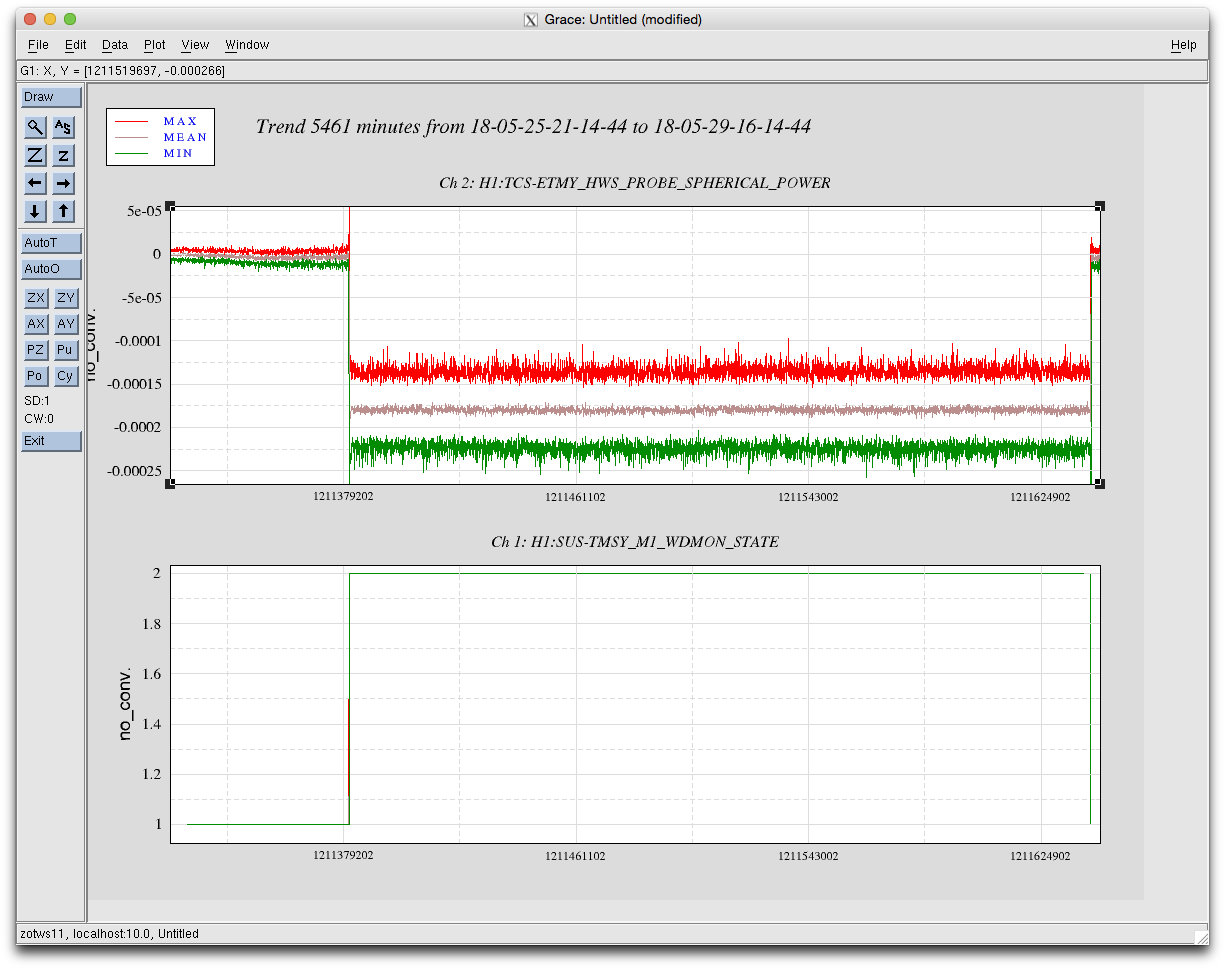
We set up the ETMY HWS to run over the weekend to gather background noise data. The SPHERICAL_POWER looks normal for the first 17 hours until it suddenly drops down to a large negative value. It turned out that the WATCHDOGS tripped on TMSY at this time. The HWS continued to run without any other issues over the long weekend.
TJ reset the watchdogs this morning and the HWS spherical power returned to the nominal zero value (without any interaction with the physical HWS hardware). We will continue to run it like this for the time being (until work needs to be done at ETMY).
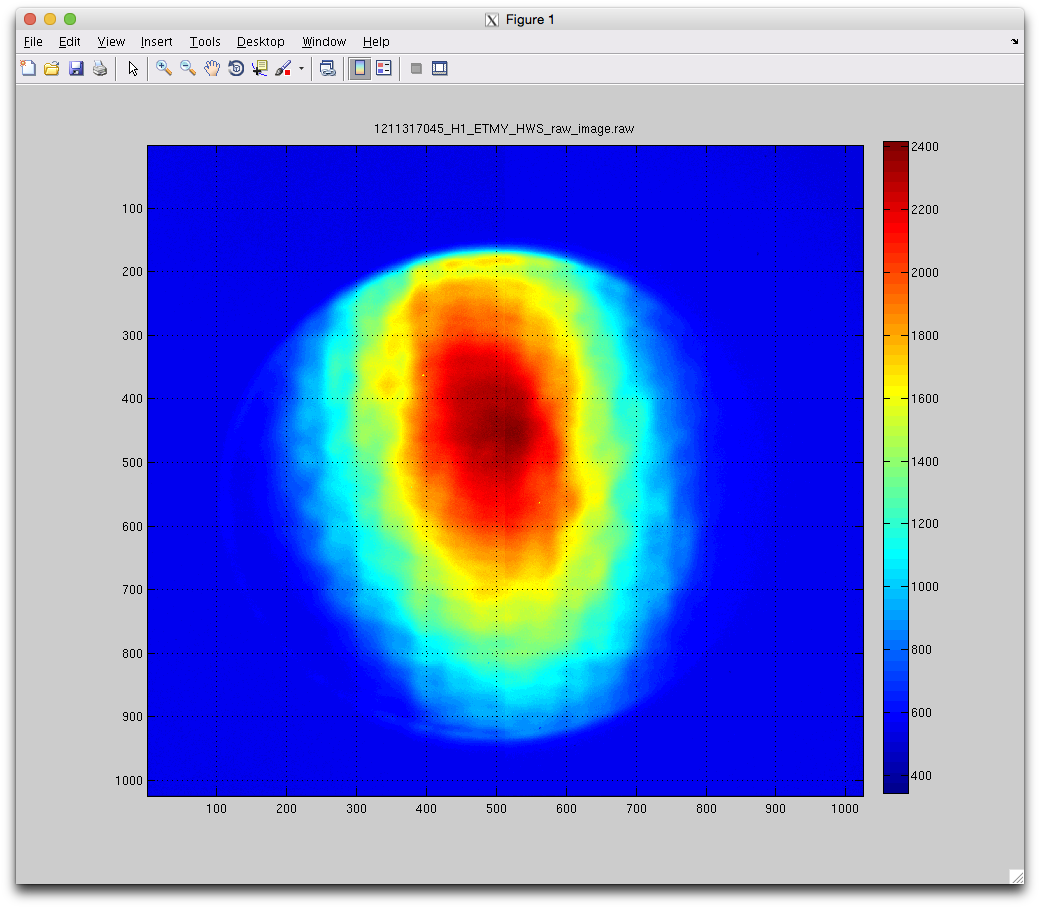
Intensity distributions
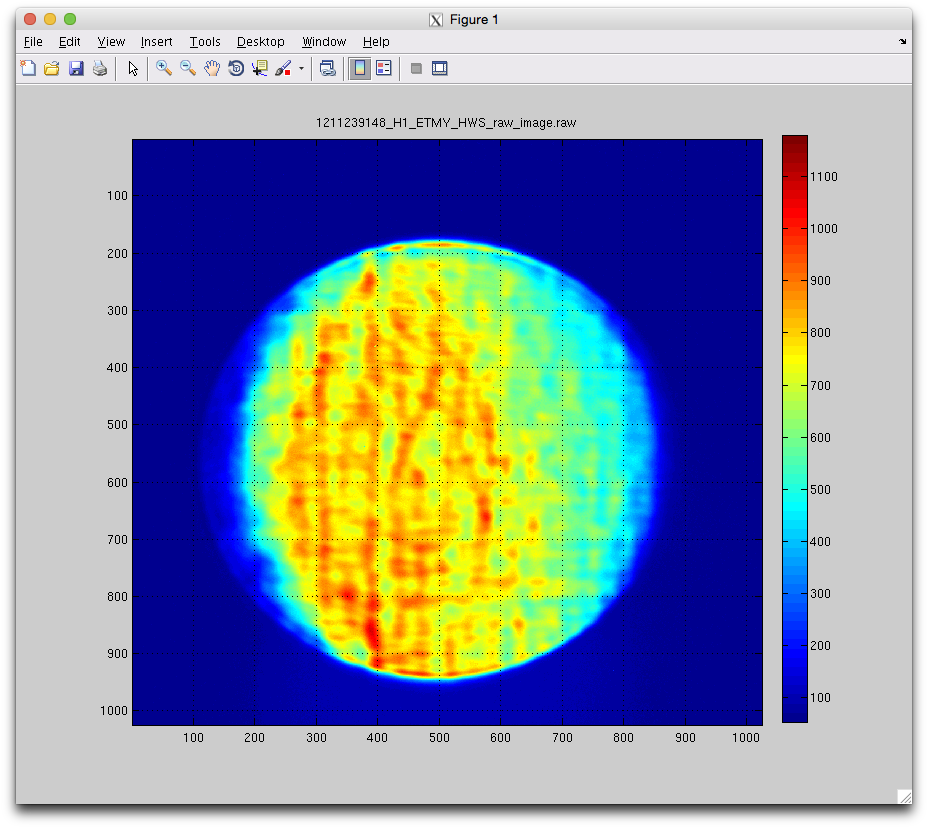
The intensity distribution illuminating the HWS with the beam from the 50 micron core fiber is shown here. Spatial units = pixels. There is some high spatial frequency structure on the return beam. No doubt from clipping somewhere in the system. The circular aperture is consistent with the annular reaction mass aperture.
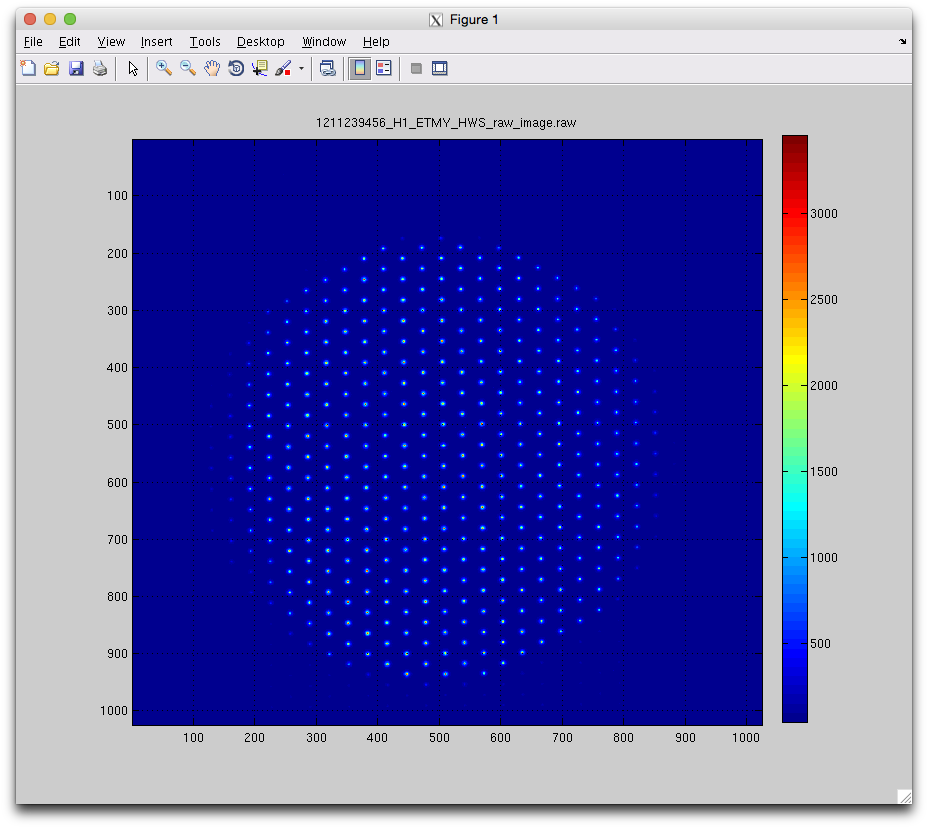
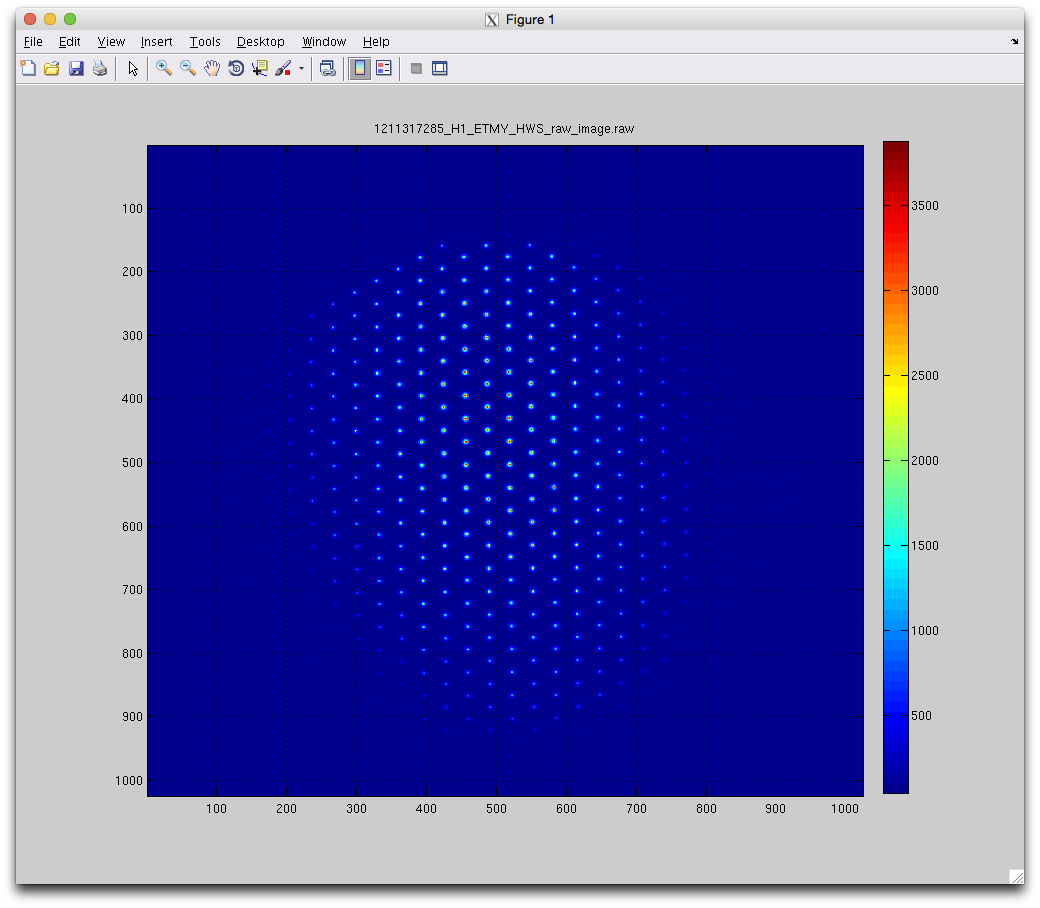
When the Hartmann plate is put on the CCD, the result is the following:
200 micron core fiber
We switched to a 200-micron core fiber and achieved more transmission and similar HWS performance with a beam showing noticeably less high spatial frequency intensity fluctuations.
And with the Hartmann plate in place:
ALS cross-coupling
We turned on the ALS beam and found that, although s-polarization is incident on the PBS going into vacuum system, there is significant leakage through the PBS for the return beam. The HWS CCD looks like this when the ALS beam is turned on (and the Hartmann plate is removed).
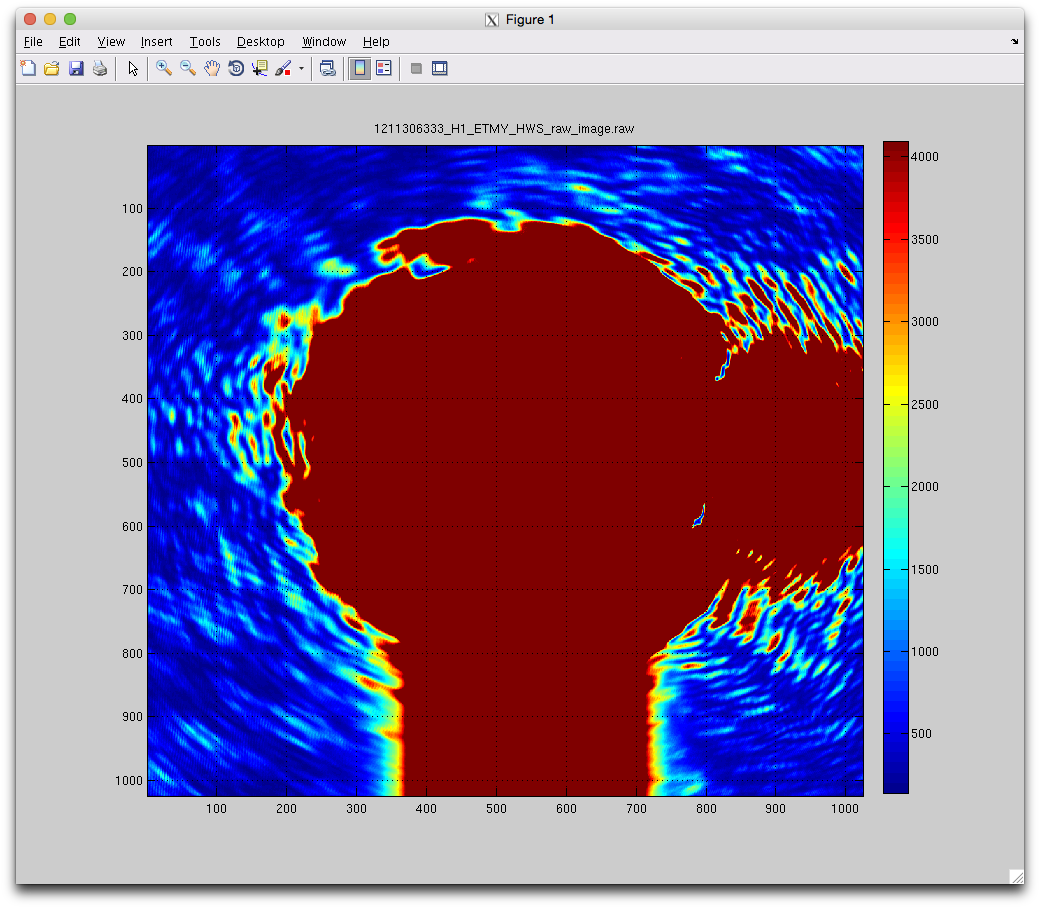
We measured the amount of ALS light and found that at least 750 micro-Watts is getting through the PBS. This is a couple of orders of magnitude larger than the HWS beam (which is difficult to measure accurately because of the low power level.
![]()
Background wavefront changes
The background wavefront changes are analyzed below:
- The first (4.5 minute change) compares two times shortly after the HWS was initialized on Friday
- The wavefront shows a small tilt but not much high frequency noise. The time scale for a point absorber is less than 4.5 minutes and the OPD from the ITMX point absorber was of the order of 80nm (about 50 to 100x larger than the background noise). Provisionally, without doing a full analysis to determine SNR, this looks sufficient to detect point absorbers.
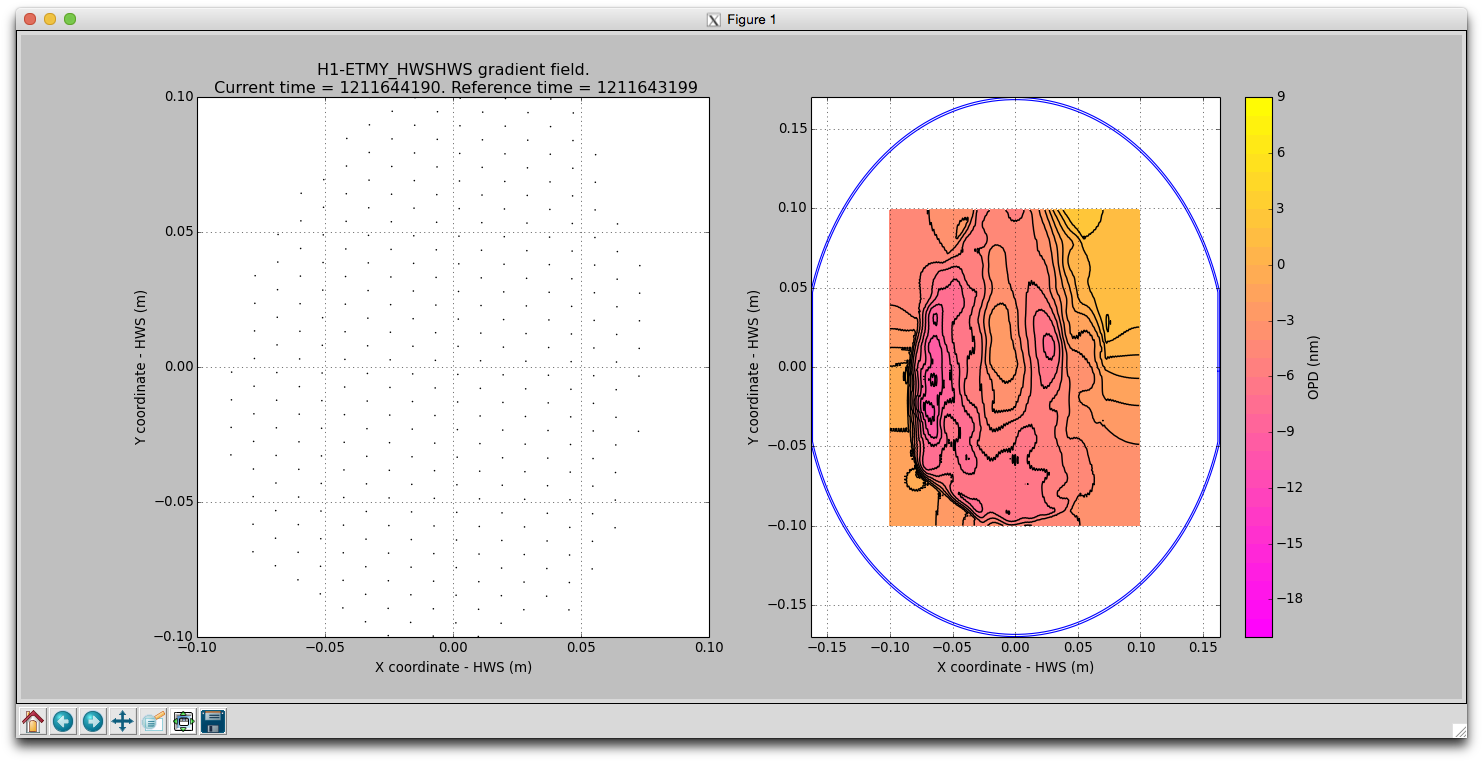
- The second (1000 minute change) compares two times this morning
- Ditto result from first plot.
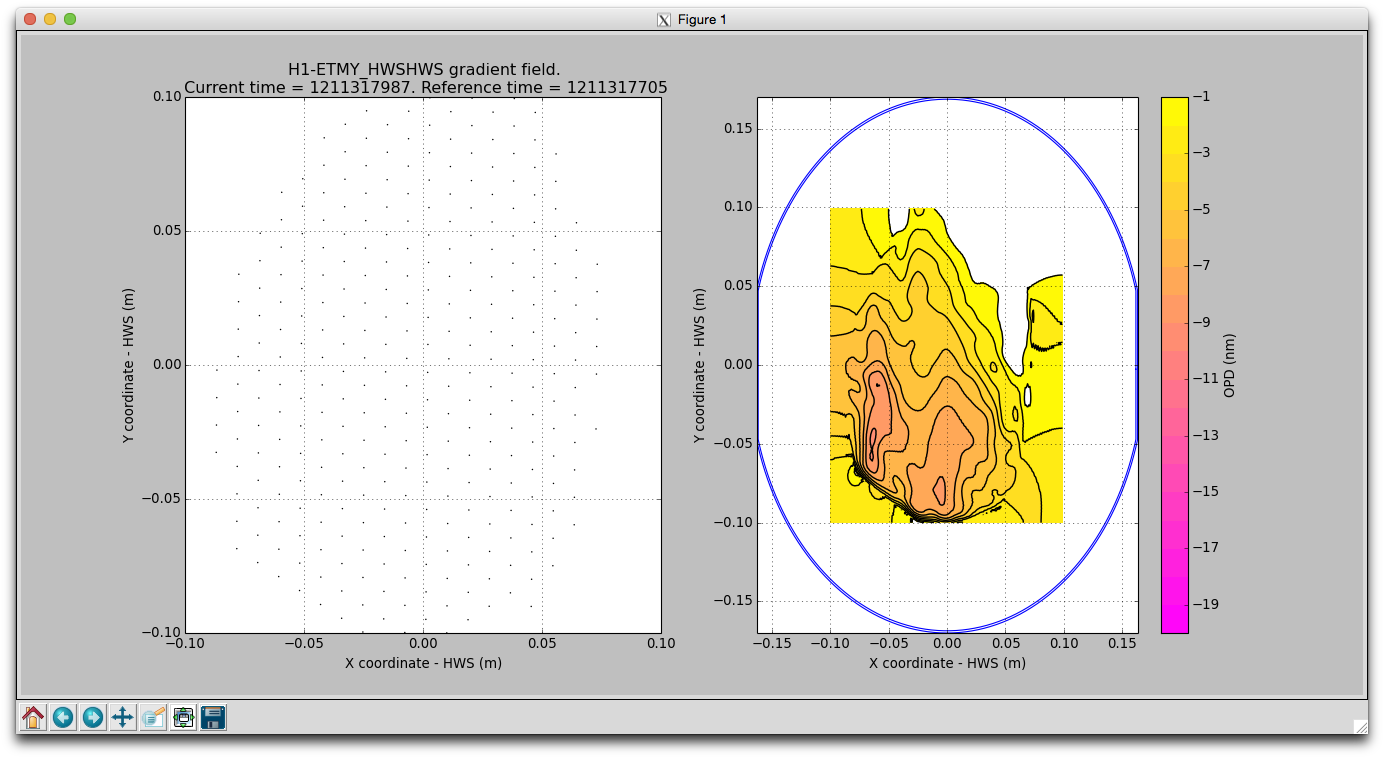
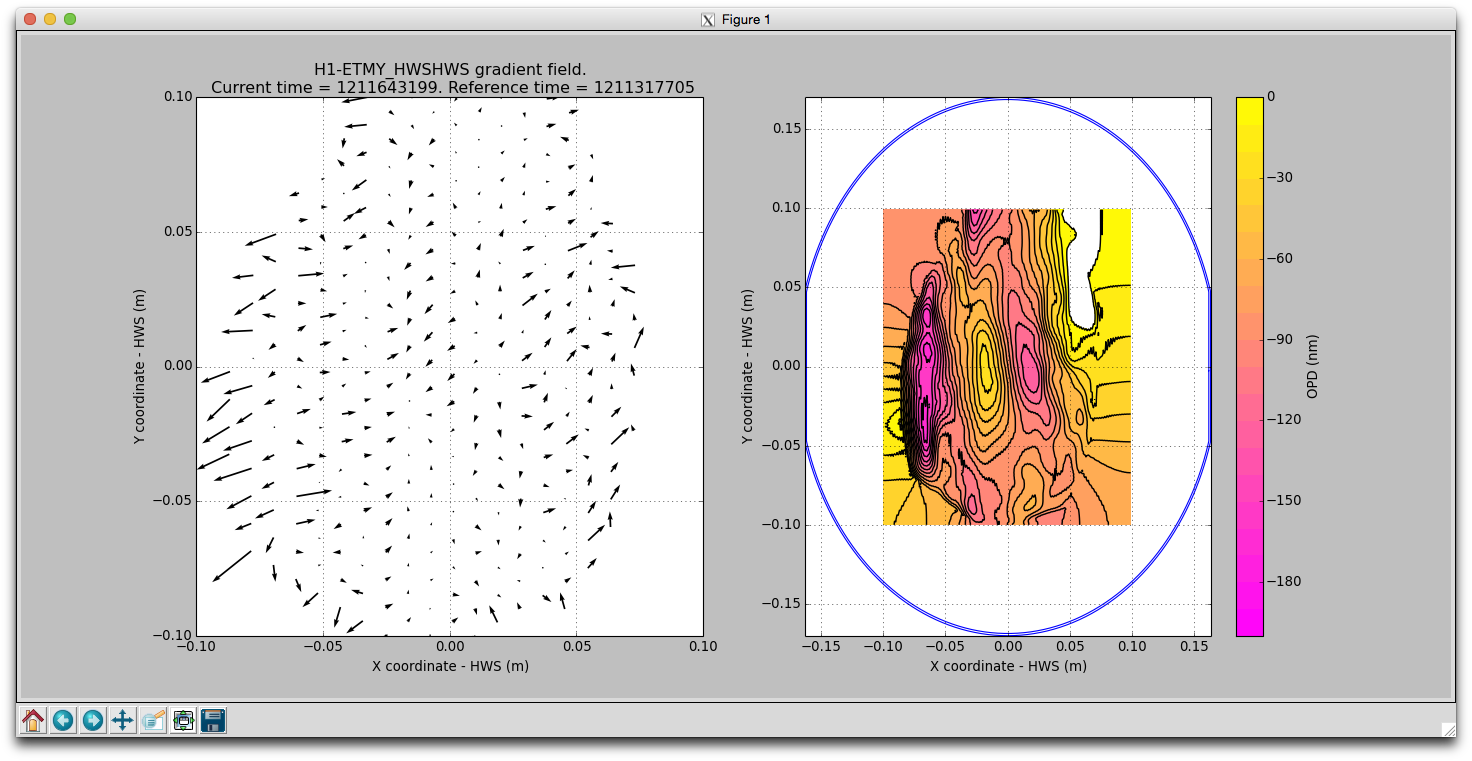
- The third (4 day change) compares a reference from Friday with the HWS measurement from this morning
- There is some clear medium spatial frequency structure to the HWS measurement here. This looks like diffraction fringes across the HWS probe beam. Further investigation is needed. However, we do know that if there are diffraction fringes on the beam we should see these become more pronounced as the time between two HWS measurements increases (assuming that the TMS and other optics slowly drift over time).
Background wavefront change: 4.5 minute change
Background wavefront: 1000s change
Background wavefront: approximately 4 day change
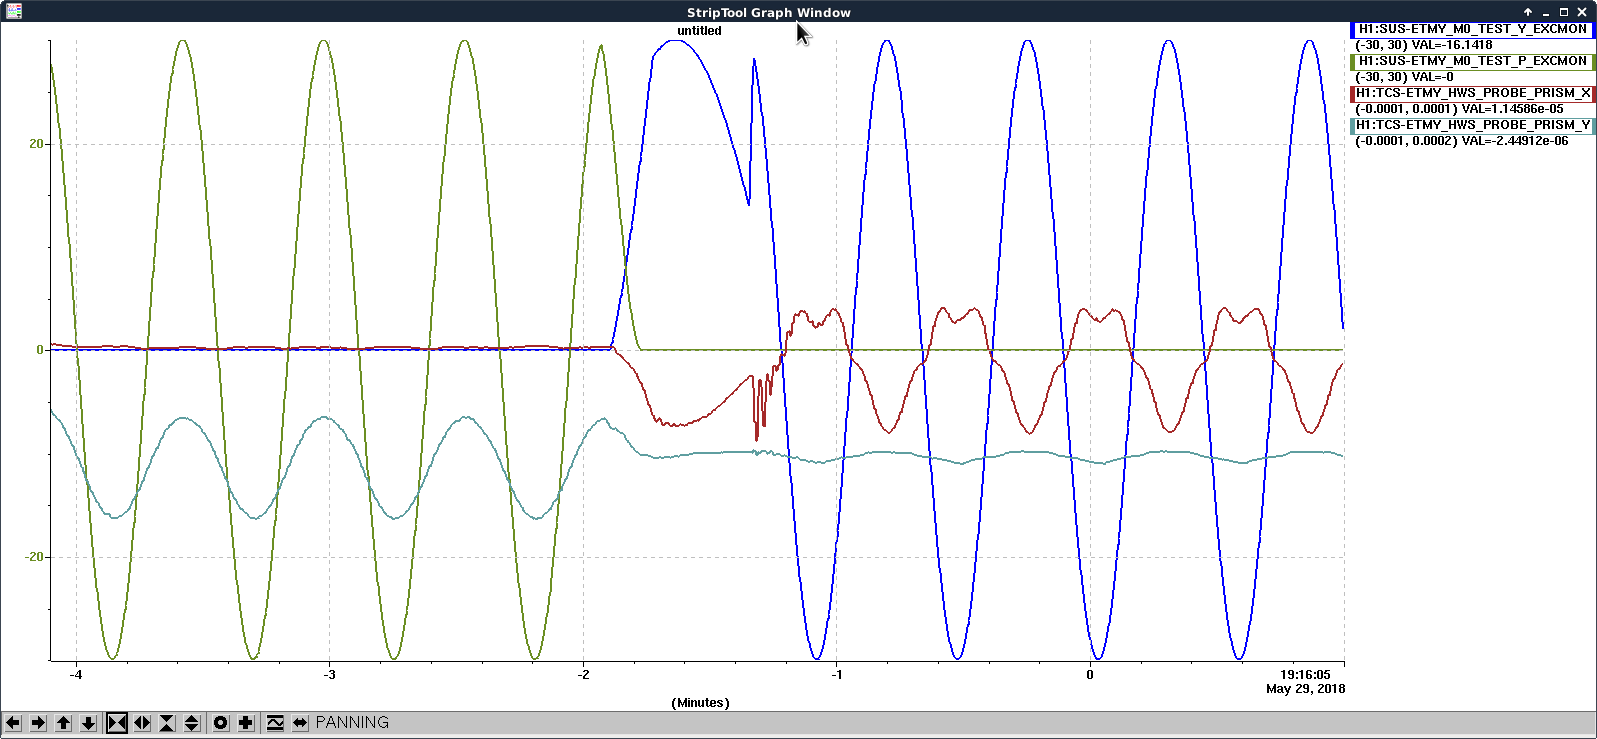
I had a look at how the ETMY pitch and yaw appeared in the prism outputs of the HWS. It seems the yaw output signal (prism x) is pretty messy, whereas pitch seems sinusoidal. This is probably due to the clipping which is worse horizontally.