I've made a similar measurement to the usual ETM-optical-lever-effective-bias-voltage, on ITMX.
Method
Since the ESD quadrants are hooked up to a low voltage driver, in order to drive them hard enough I connected the bias output of the ITMY HV chassis to the quadrants directly, one by one. I looked at the optical lever response to the individual quadrant drive (V_{signal}) as a function of ITMX bias voltage. The bias voltage where the optical lever response is zero is the usual V_eff we measure.
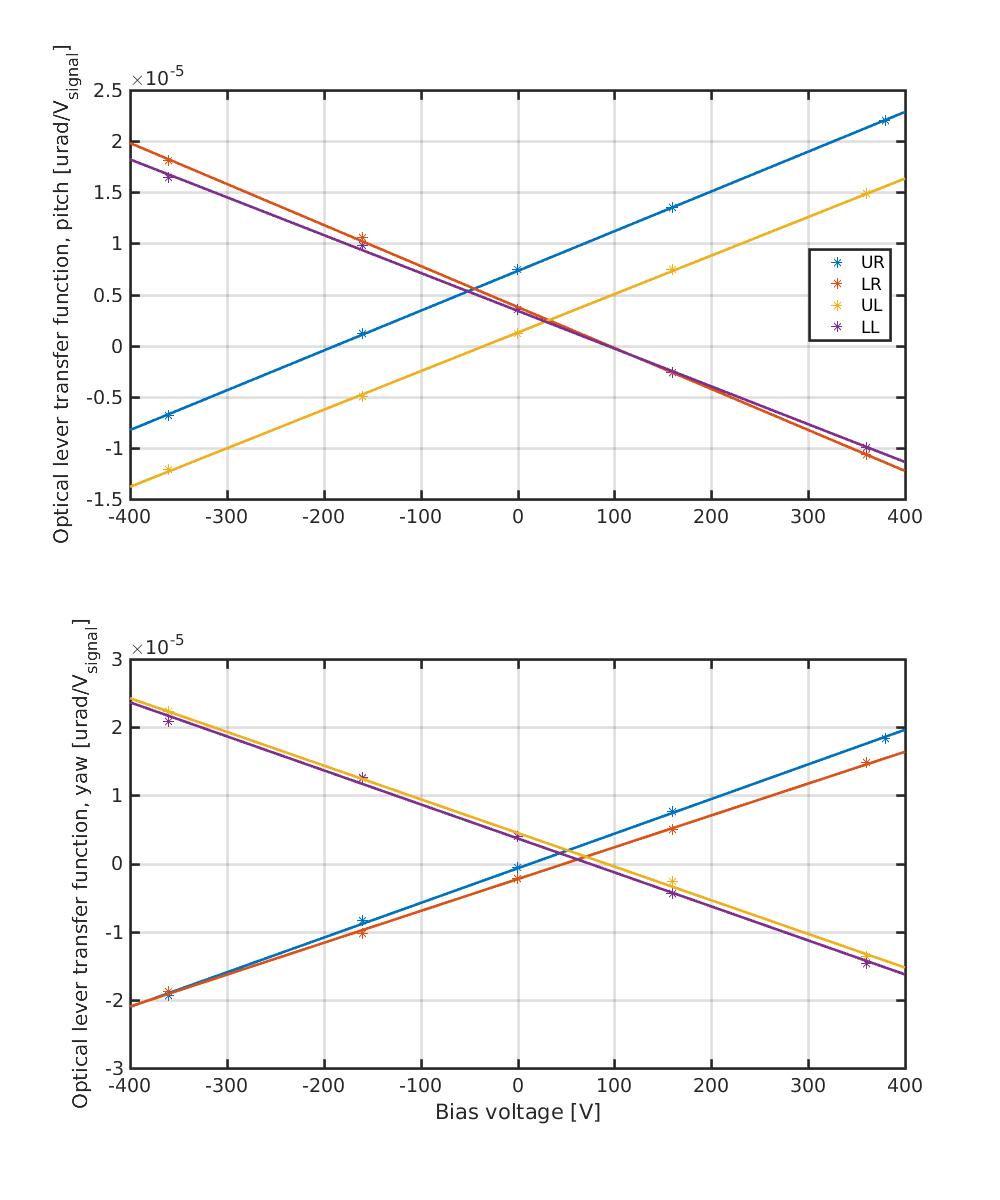
I drove each quadrant for 2 mins, at 0.8 Hz, with an amplitude of ~120000 counts as monitored on H1:SUS-ITMY_L3_MASTER_OUT_DC_DQ. I recorded the timestamps for these drives and bias voltages and then looked back at the optical lever pitch and yaw channels. I then calculate the transfer function from the signal drive to the optical lever, and plot this as a function of bias voltage. See attached plot.
The scripts (driveITMChargeMeas.m, using the function process_single_quadrant.m) live in userapps/release/sus/common/scripts/quad/opLevChargeMeasurements/ and are adapted from Sheila's in-lock charge measurements.
Final numbers
| V_eff (pitch) [V] | V_eff (yaw) [V] | |
| UR | -187.7 | 14.5 |
| LR | 94.6 | 49.6 |
| UL | -33.5 | 91.6 |
| LL | 92.6 | 74.6 |
Note that due to the larger gap between the test mass and reaction mass, the alpha and gamma co-efficients are smaller for the ITMs than the ETMs (see alog 38387), giving a larger V_eff. To compare the V_eff of ITMX to the ETMs we need to divide by a factor of ~1.5.
I'm not 100% confident in this data as the V_eff varies significantly for pitch and yaw of the same quadrant (in particular UR) which I don't understand.