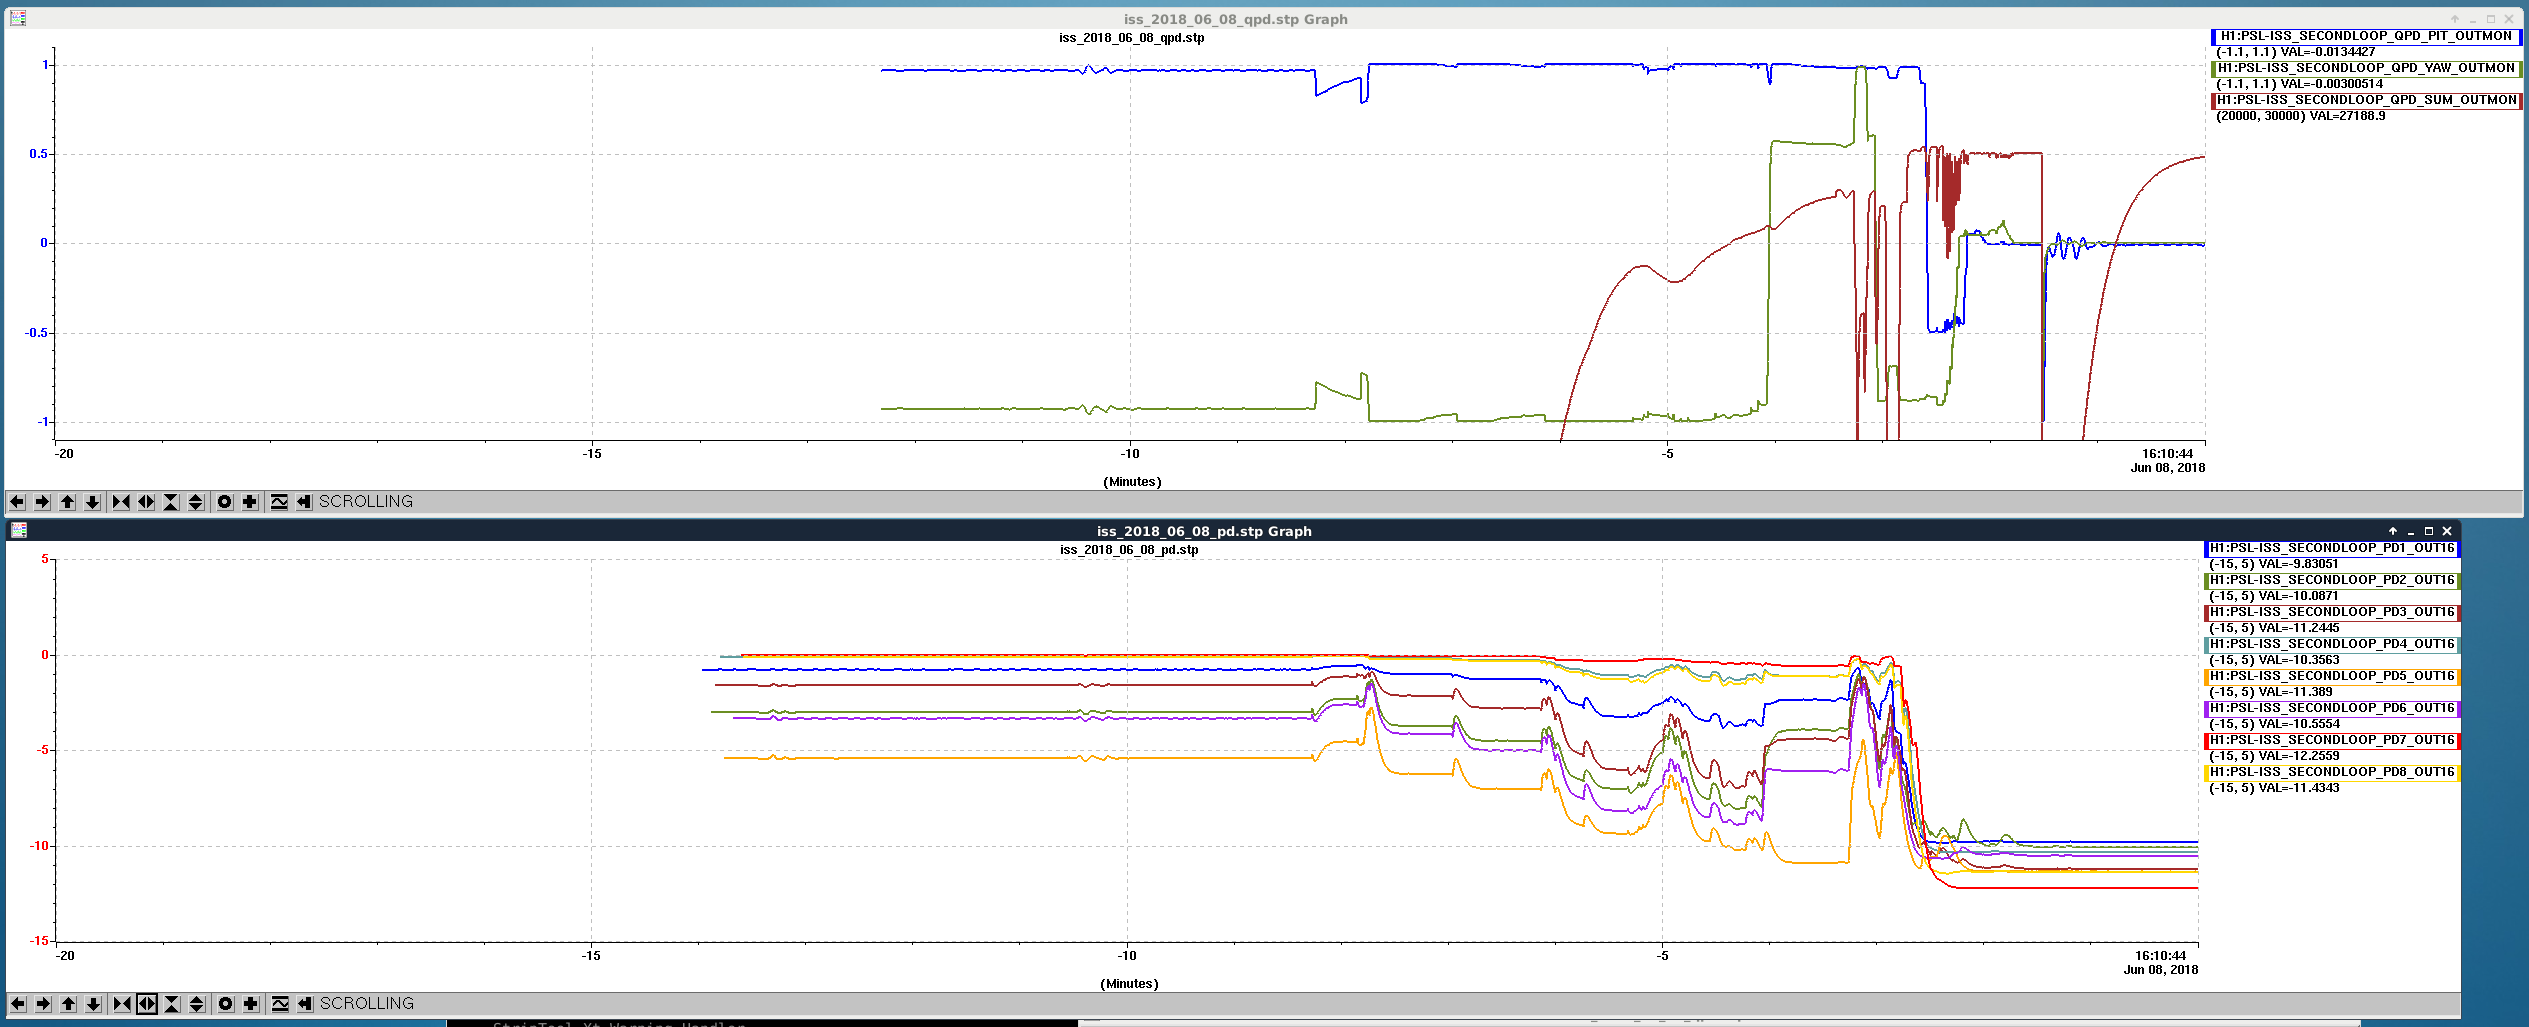
Centered the ISS second loop array, using picomotor 1. The QPD signals were zeroed, and in that state all PD powers were high and quite similar. See first attached plot.
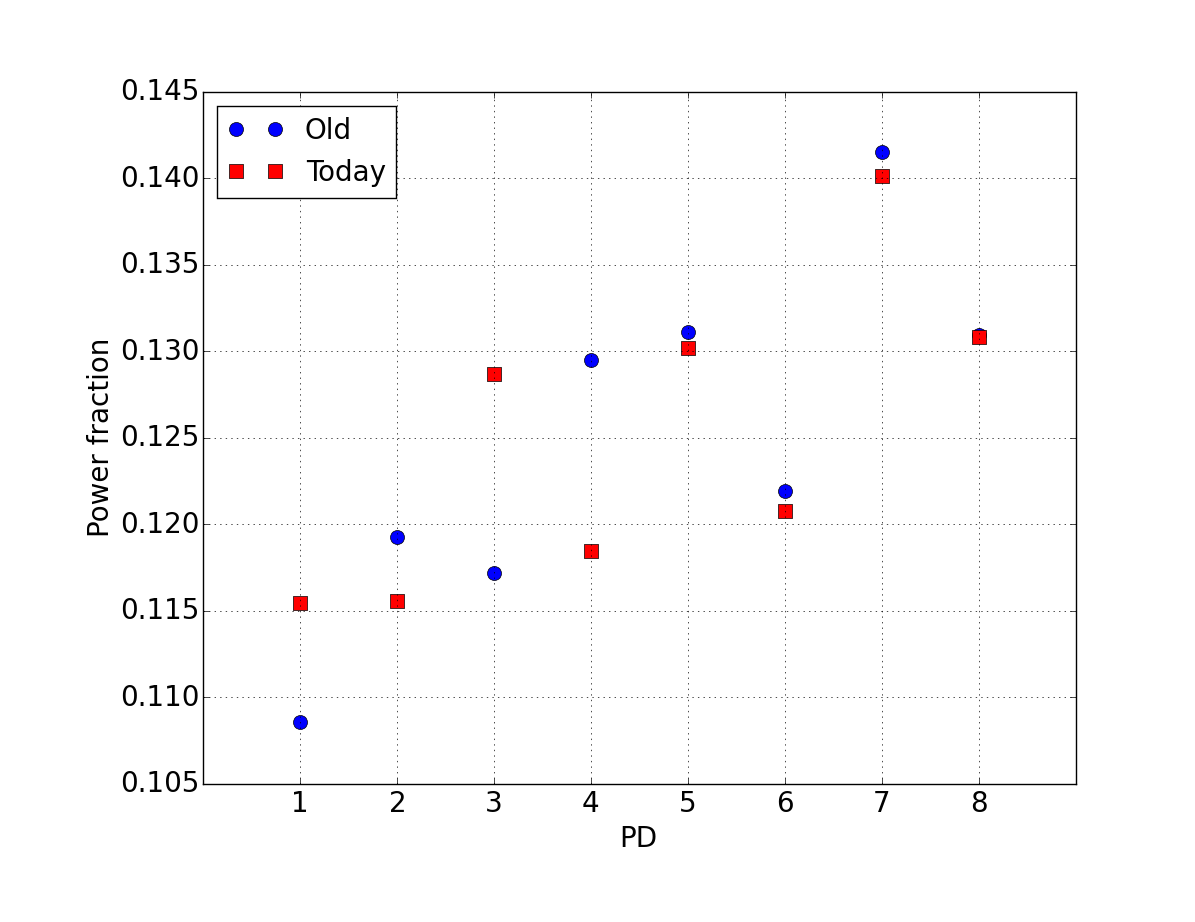
For reference, the typical power levels measured before are (18054)
| Old | New | ||
| PD1 | IOP-PSL0_MADC1_EPICS_CH24 | 1247 | 10167 |
| PD2 | IOP-PSL0_MADC1_EPICS_CH25 | 1370 | 10179 |
| PD3 | IOP-PSL0_MADC1_EPICS_CH26 | 1346 | 11333 |
| PD4 | IOP-PSL0_MADC1_EPICS_CH27 | 1487 | 10434 |
| PD5 | IOP-PSL0_MADC1_EPICS_CH28 | 1506 | 11467 |
| PD6 | IOP-PSL0_MADC1_EPICS_CH29 | 1400 | 10640 |
| PD7 | IOP-PSL0_MADC1_EPICS_CH30 | 1625 | 12345 |
| PD8 | IOP-PSL0_MADC1_EPICS_CH31 | 1504 | 11525 |
Note that the normalization of the signals might be different, as well as the input power, so only the relative differences are important. The distribution of power levels is comparable with the old measurements.
With the IMC offline, measured and retuned the dark offsets:
H1:PSL-ISS_SECONDLOOP_PD1_INMON 507.360238647
H1:PSL-ISS_SECONDLOOP_PD2_INMON -0.477651876211
H1:PSL-ISS_SECONDLOOP_PD3_INMON -4.05748717785
H1:PSL-ISS_SECONDLOOP_PD4_INMON -4.37042988539
H1:PSL-ISS_SECONDLOOP_PD5_INMON 0.0666494309902
H1:PSL-ISS_SECONDLOOP_PD6_INMON -0.540560656786
H1:PSL-ISS_SECONDLOOP_PD7_INMON -1.43365537077
H1:PSL-ISS_SECONDLOOP_PD8_INMON -0.803998035192
They're all normal, except for PD1 which has a very large offset.


