jeffrey.kissel@LIGO.ORG - posted 13:04, Thursday 14 June 2018 (42527)
Metrics of Success in Balancing H1SUSITMY L2 Coils
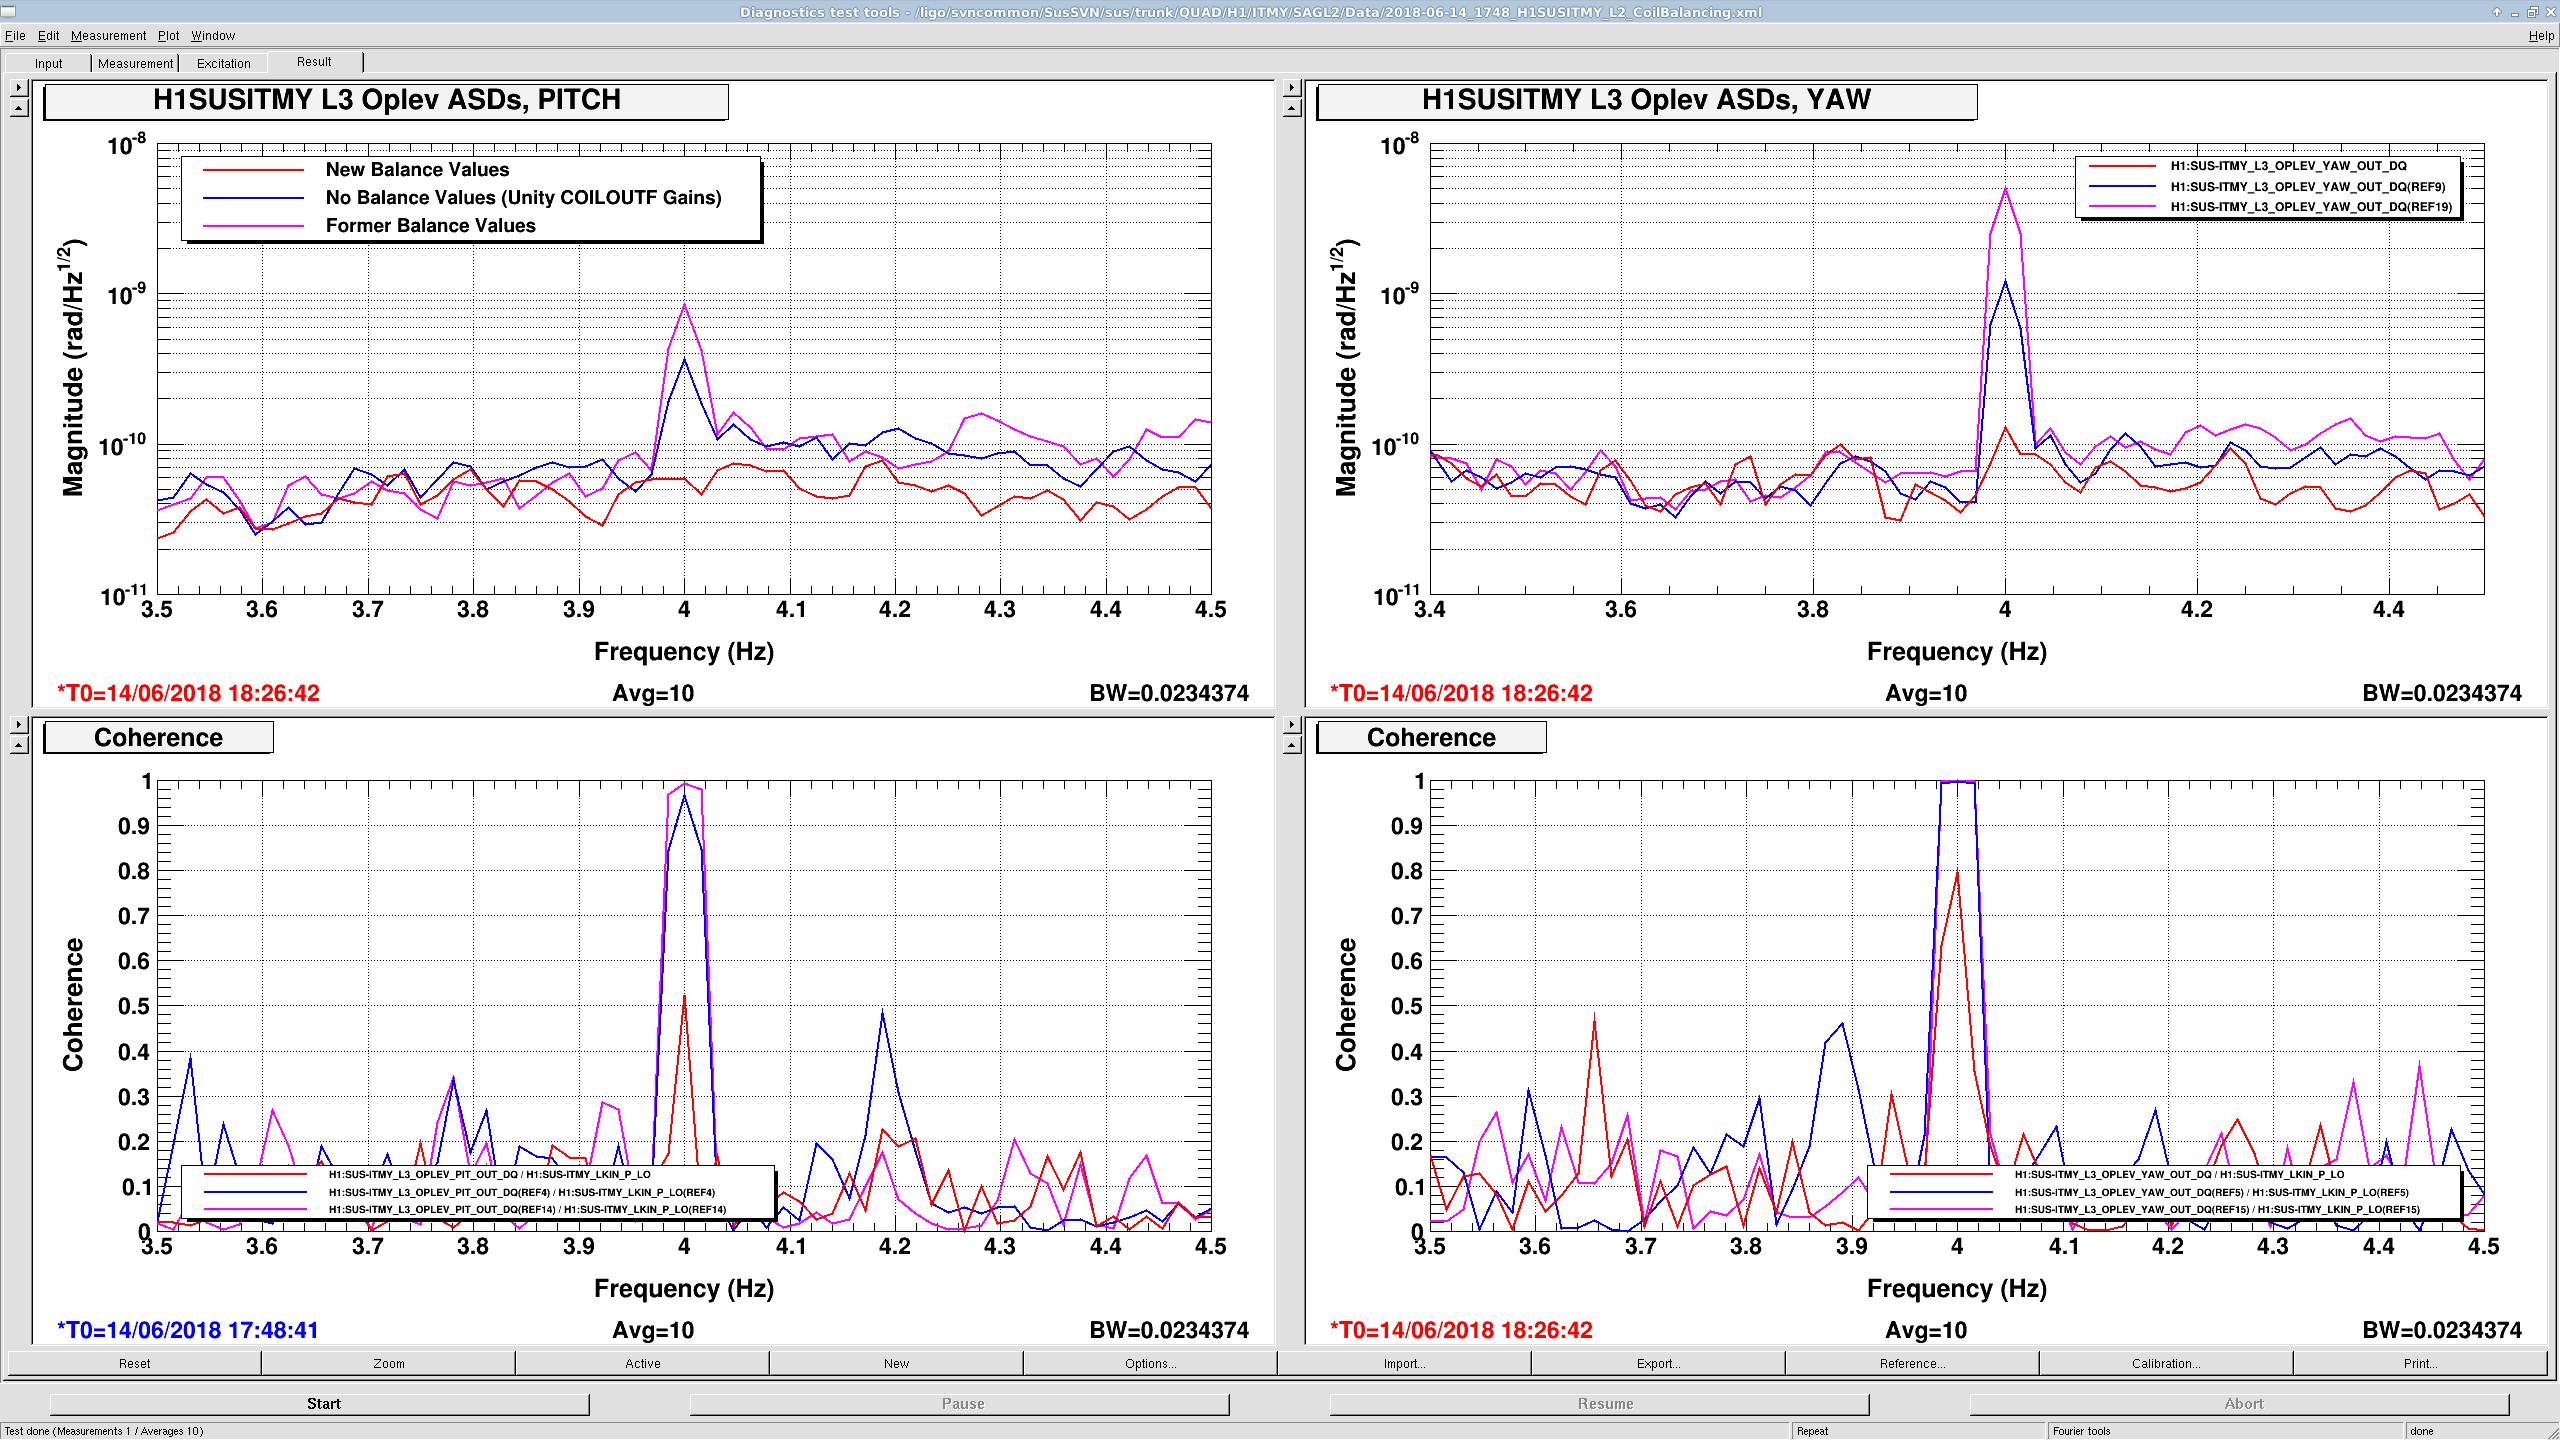
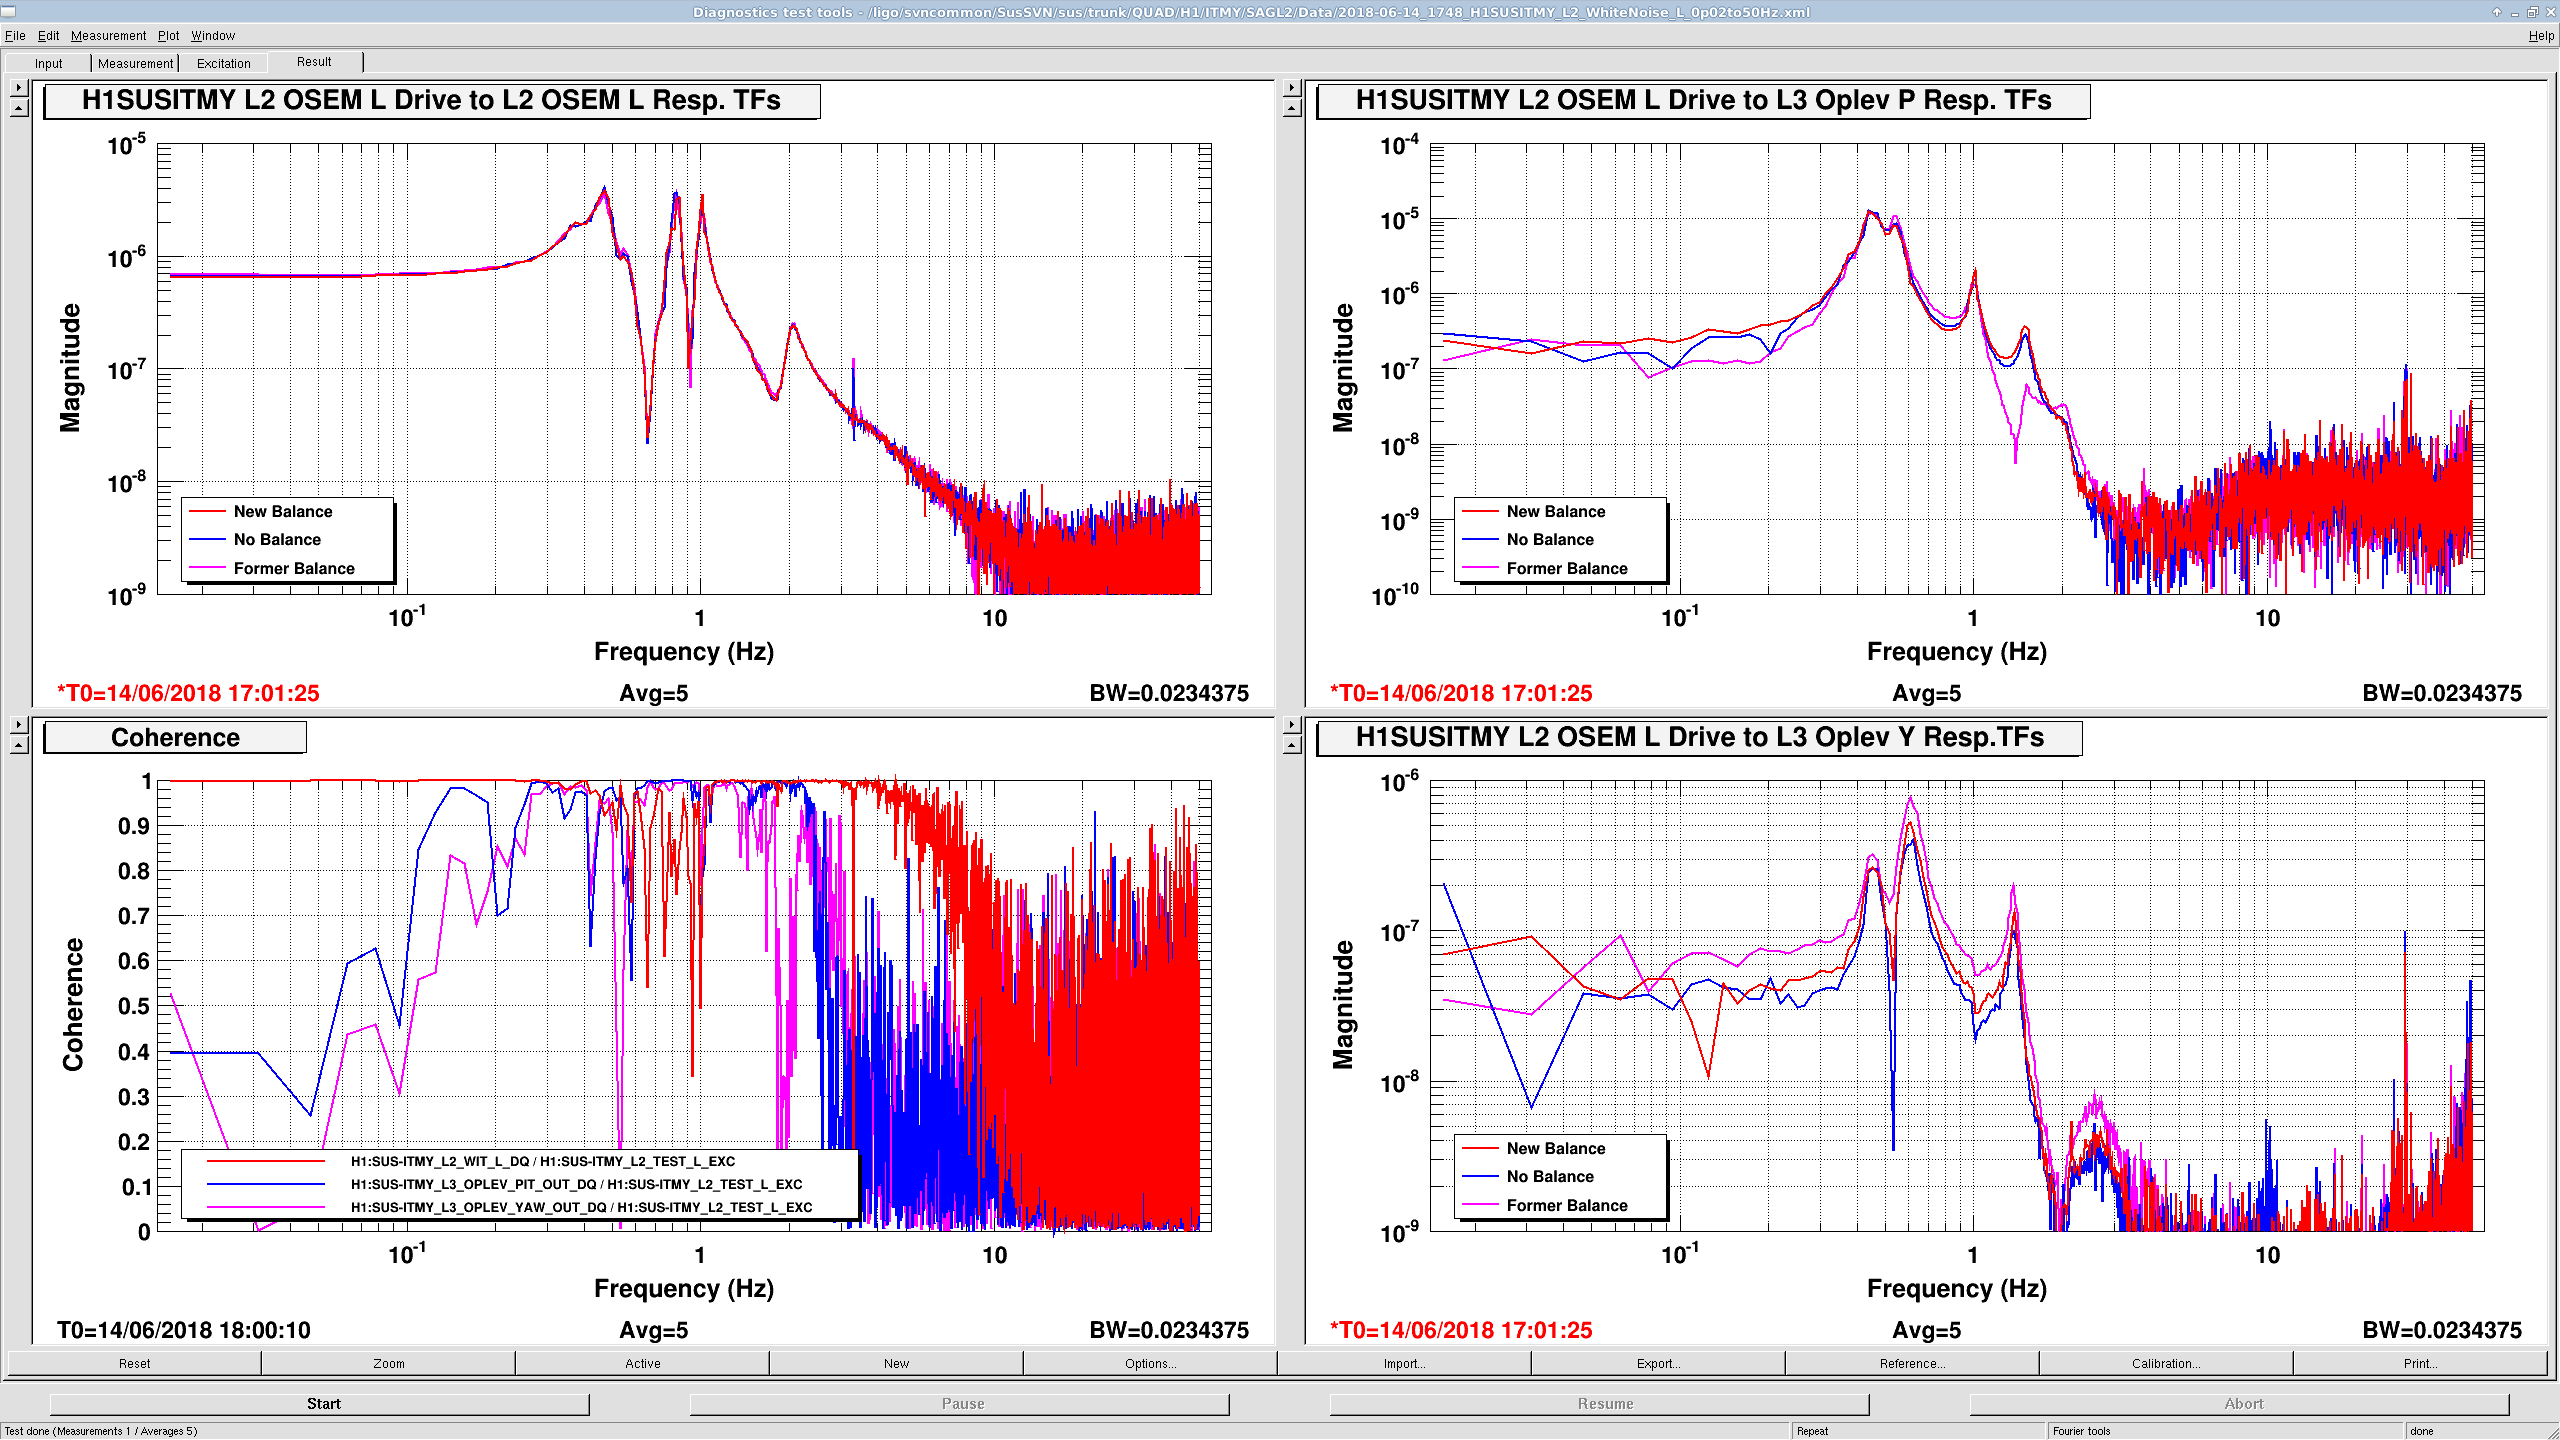
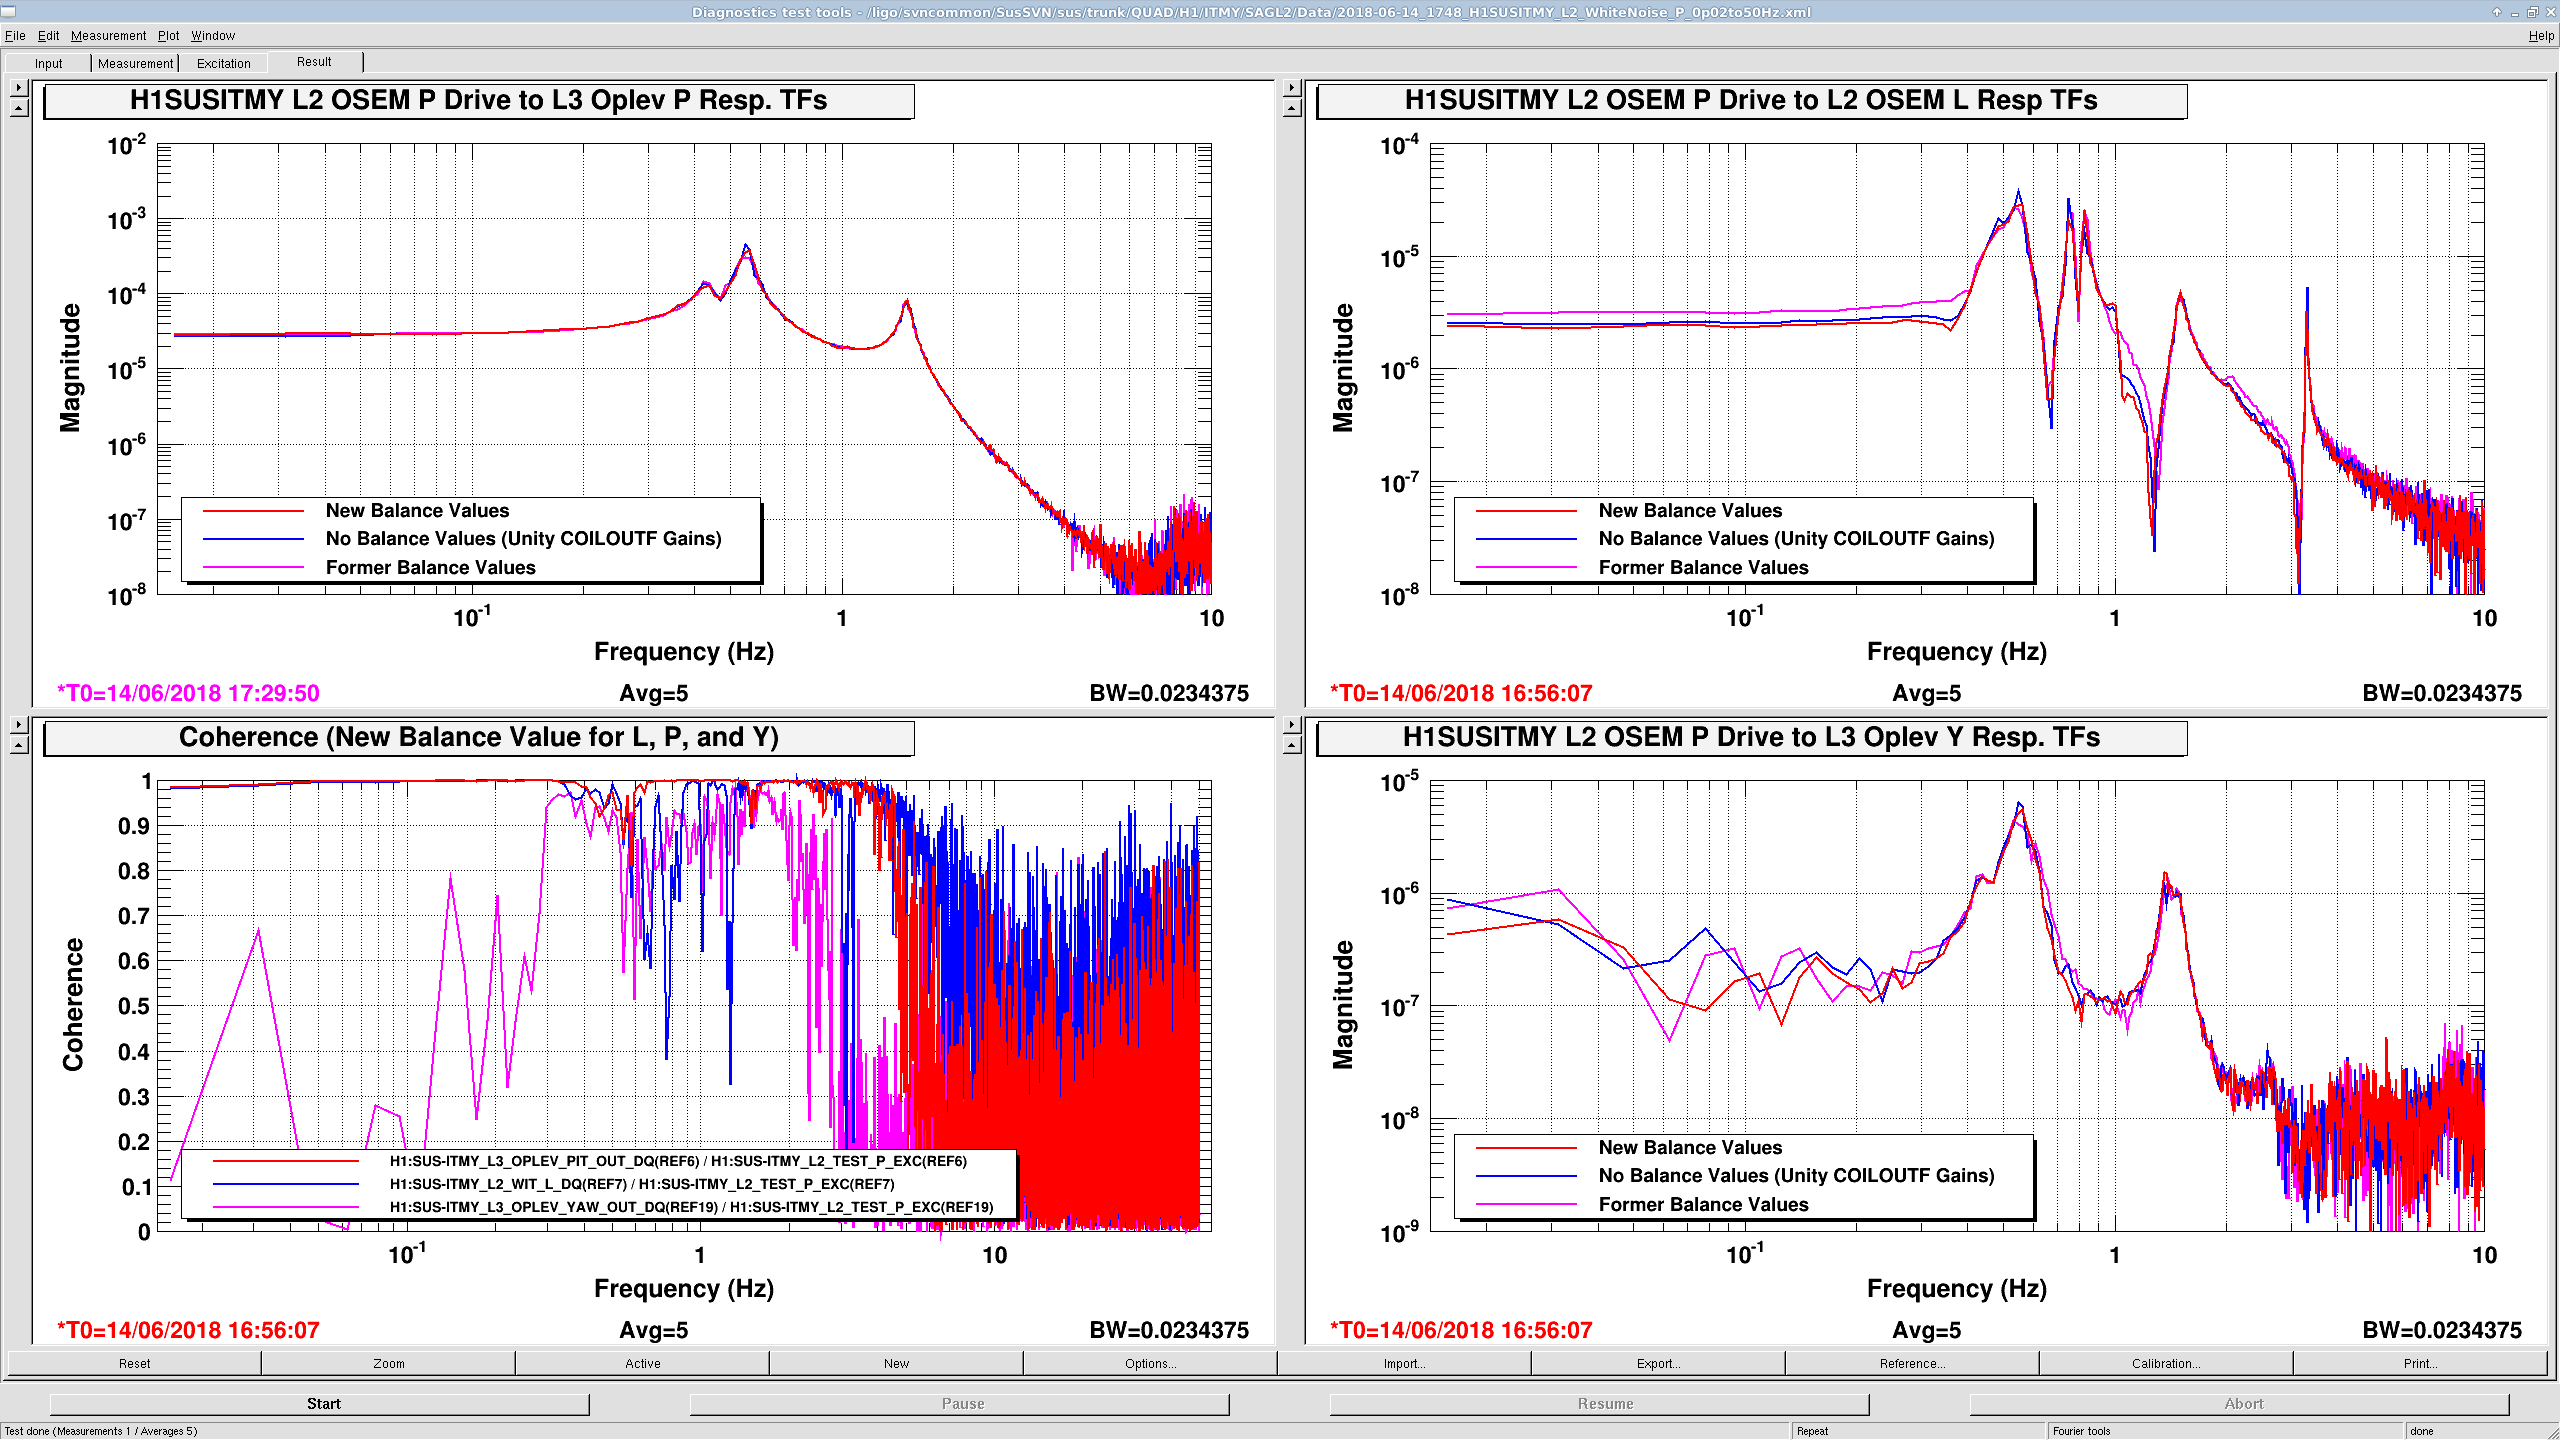
J. Kissel

After balancing H1SUSITMY's L2 (PUM) coils quickly yesterday (LHO aLOG 42513) using pringle drive, demodulator/lock-in optical lever response methods described in LHO aLOGs 11392 and 9453, I went back this morning and characterized the performance of the balancing.

For convenience, the new balance values, again, are
    New Balance:
        UL 0.973282
        LL -1.01098
        UR -0.98898
        LR 1.02728
These values have been saved into the SDF system.

I attach two types of metrics, one shown before and one new:
(1) The amplitude spectral density of the PUM/L2 driven pringle line in TST/L3 optical lever pitch and yaw signals, and
(2) A broadband response of transfer functions from PUM/L2 L drive to the PUM OSEM's L, and TST/L3 optical lever pitch and yaw.
(3) A broadband response of TFs from PUM/L2 P drive to the the PUM OSEM's L, and TST/L3 optical lever pitch and yaw.
(I didn't have time to figure out a drive amplitude that would work for an interferometric measurement of TST/L3 L).

(1) shows the expected, nicely reduced amplitude spectral density response to pringle drive at 4 Hz (in fact, I show that the former balance was actually *worse* than no balancing).

(2) and (3) are a new metric (at least as seen by me) for the performance showing how coil balancing impacts the frequency dependence of PUM/L2 L to PUM/L2 L, TST/L3 Pitch, and TST/L3 Yaw, as well as PUM/L2 P to PUM/L2 L, TST/L3 Pitch, and TST/L3 Yaw.
   - The low frequency magnitude of the L2 P to L2 L TF (upper right panel of 3rd attachment) shows the expected goodness: the 25% reduction of L from P drive, for balancing the coils with ~3% level gain matching.
   - More interestingly for the same TF, the 0.8 Hz to 3 Hz response changes in a frequency-dependent manner -- and this is notably *not* the pringle drive frequency. Where resonance features either flip sign or change phase, the magnitude is reduced by as much as, e.g. a factor of 3.3 at 1.06 Hz.

   - The L2 L to L3 P and Y TFs (upper and lower right panels of 2nd attachment) show equally interesting results:
       - The low frequency L to P TF (upper panel) shows an *increase* in magnitude from the former balance to the new "better" balance, where the middle frequency response is drastically different. I don't want to call this "worse," my gut tells me that we've simply reduces spurious cross coupling and now we're better reproducing the modeled physical, expected, L to P coupling.

       - For the L to Y TF, is seems like no balance is best over the entire frequency band (though the new balance values are a close second, with the former values being obviously worse.)

I think these new metrics will be very useful in the future. I should probably also get Yaw drives to P and L ... I'll get them next time.
Images attached to this report