Displaying report 1-1 of 1.
Reports until 20:57, Thursday 27 September 2012
H2 SUS
keith.riles@LIGO.ORG - posted 20:57, Thursday 27 September 2012 (4327)
More OAT line studies
Following up on the earlier post 3646 concerning H2 OAT line studies, I am attaching some slides
extracted from a detchar report at the Rome LVC meeting, with some new, additional plots and tables based 
on further analysis. To make future alog searches for frequencies easier, below is a cut n paste of the final table 
of known combs and individual lines.

Comments:
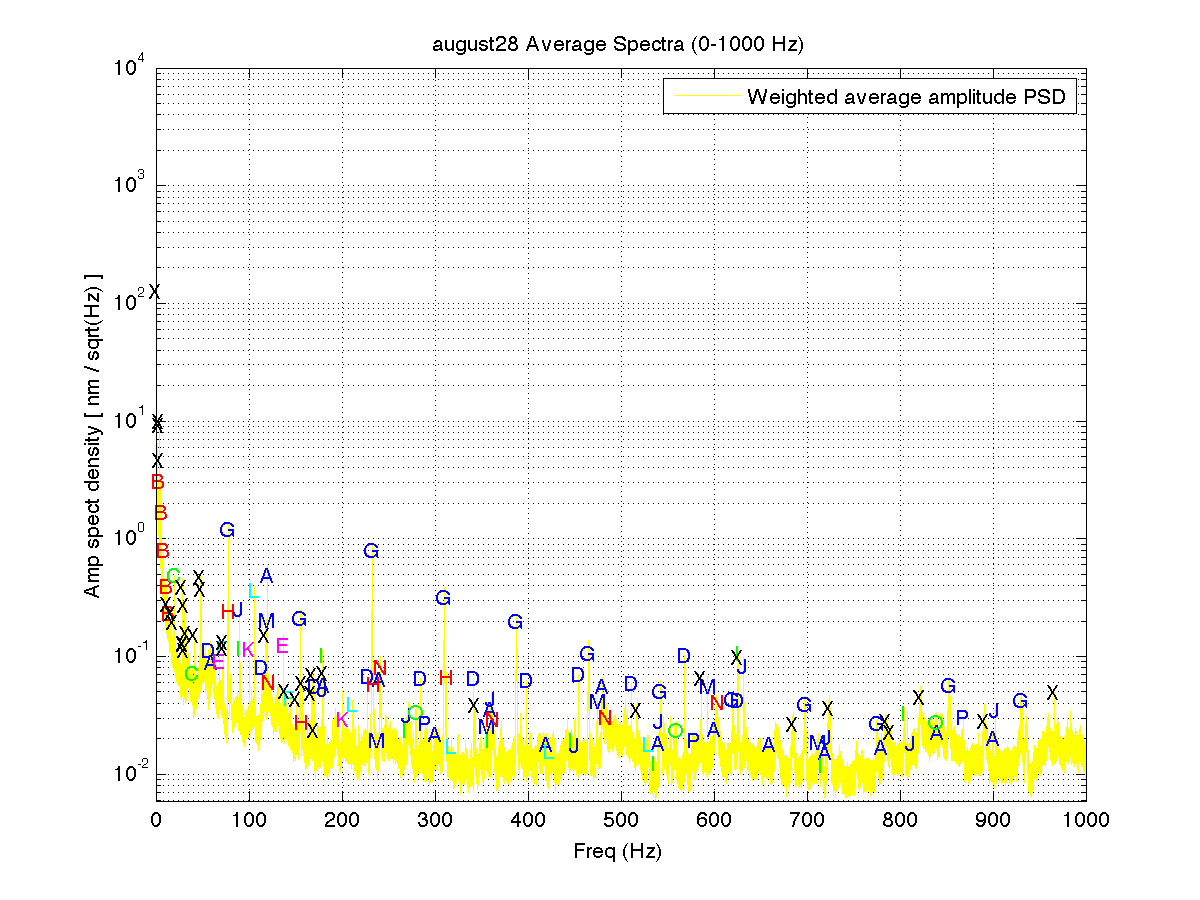
  • The bulk of the new line list is based on the weighted average spectrum for only one day in August (Aug 28). September data has not yet been examined.
  • The correlations between the primary arm feedback channel and the ~100 auxiliary channels monitored by the Noemi (Virgo) program are weakened by the sparseness of long stretches of locked-arm data since the OAT began.
  • The list of lines is not exhaustive. There is some subjectivity (based on strength, width, presence of harmonics) in the choice of lines to list.
  • While Noemi identifies correlations that gives hints of sources for most of the lines below 100 Hz, nearly all of the lines above 100 Hz show no correlation in Noemi for the ~100 auxiliary channels scanned (except for higher harmonics of lines that have correlations at the fundamental frequency).
  • The number of digits following the decimal point in the table below depends on a line's width and maximum harmonic number
  • Lines below with a label from 'A' to 'P' are the fundamental frequencies of a comb of at least one more harmonic (see slides for harmonic counts). A label of 'X' indicates a single line not obviously (to me) part of a comb.
Cut n paste of last table in slides: A – 60.0 Hz Power mains B – 2.745 Hz Laser reference cavity X – 4.012 Hz Laser reference cavity X – 4.294 Hz Correlations with LVEA seis / mag channels X – 12.08 Hz ? X – 16.36 Hz ? X – 18.83 Hz ? C – 19.62 Hz Correlations with LVEA seis / mag channels X – 28.28 Hz ? X – 29.625 Hz Correlations with LVEA & EY seis / mag / accel channels X – 29.78 Hz ? X – 30.18 Hz Correlations with LVEA & EY seis / mag / accel / mic channels X – 30.86 Hz Correlations with LVEA seis / mag / accel / mic channels X – 32.73 Hz ? X – 41.88 Hz ? X – 48.02 Hz Correlations with LVEA seis / mag / mic channels X – 49.01 Hz Correlations with EY seis / mag / accel / mic channels D – 56.84065 Hz Correlations with EY seis / mag / accel / mic channels E – 68.59 Hz ? F – 72.09 Hz ? X – 72.37 Hz Correlations with LVEA & EY seis / accel channels G – 77.54 Hz Correlations with EY mag / accel channels H – 78.00 Hz Correlations with EY accel channel I – 89.415 Hz Correlations with EY accel channel J – 90.29 Hz Correlations with LVEA seis / mag / mic channels K – 100.678 Hz ? L – 105.91 Hz ? X – 117.455 Hz ? M – 118.59 Hz ? N – 120.7 Hz ? X – 138.9 Hz ? X – 151.02 Hz ? X – 157.75 Hz ? X – 167.018 Hz ? X – 167.80 Hz ? X – 170.93 Hz ? X – 179.73 Hz ? O – 279.60 Hz ? P – 289.48 Hz ? X – 343.05 Hz ? X – 517.5 Hz ? X – 586.3 Hz ? X – 625.9 Hz ? X – 685.0 Hz ? X – 724.2 Hz ? X – 785.1 Hz ? X – 789.9 Hz ? X – 822.5 Hz ? X – 891.2 Hz ? X – 966.291 Hz Correlations with EY seis / mag / accel / mic channels The attached plot shows the full 0-1000 Hz spectra examined with all combs / single lines marked. The slides show 100-Hz bands which are more readable.
Images attached to this report
Non-image files attached to this report
Displaying report 1-1 of 1.