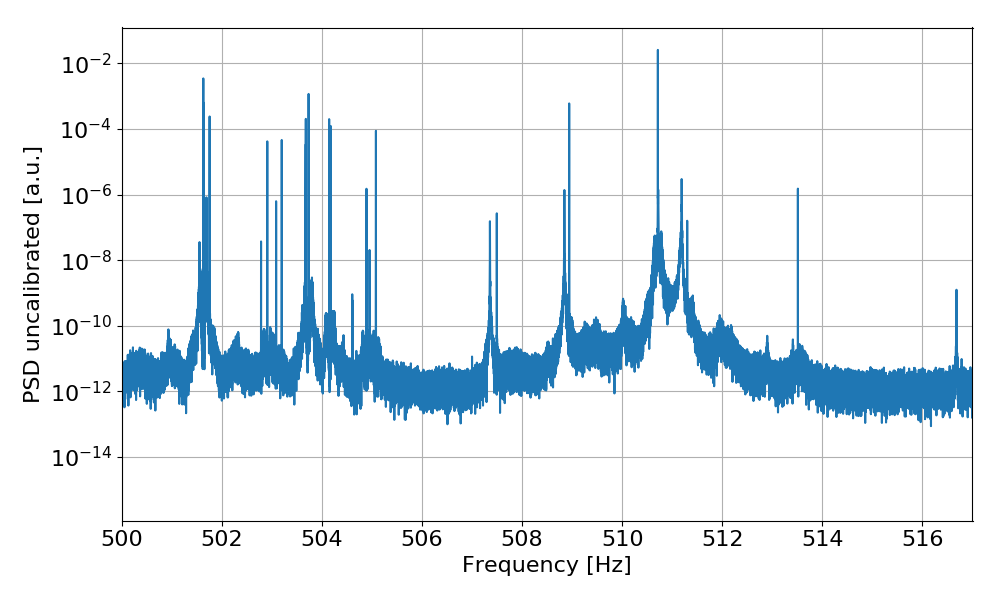
Attached plot, data and code for a high resolution (0.2 mHz) PSD around the violin modes. Here's how it was computed:
- read CAL-DELTAL_EXTERNAL_DQ for one lock durign the weekend (see 43661, data from 1219293018 to 1219305618)
- decimate to 4096 Hz
- heterodyne with a complex sinusoid at 507 Hz
- decimate the result at 32 Hz
- compute the PSD and upshift the frequency bins by 507 Hz
Additionally, I adapted some code from the C.Ri.Me. lab code library to identify peaks and measure the frequencies (code in the attached notebook). Here's a list of the main peak identified in this way and a plot
Freq. [Hz]	SNR
501.5549		216
501.6304		22387449
501.6934		2208
501.7563		1016510
502.7843		5148
502.9086		3800670
503.0852		62183
503.1976		9143441
503.6788		1360642
503.7344		8771479
504.1450		10496208
504.1786		3180409
504.6066		451
504.8855		63210
504.8906		195549
504.9527		3884
505.0795		15773030
507.3577		1366
507.4948		40605
508.8452		2856
508.9412		5231498
510.7134		975575
511.1883		210
511.2993		327
513.5110		265289
516.6803		536
516.6822		59


The attached script can be used to generate the output above from any GPS times.
Syntax:
python violin_psd.py start_gps end_gps [resolution]
where the optional parameter is the frequency resolution in Hz (default to 2e-4 Hz).
The output are four files:
violin_modes_0.2mHz_resolution_*.png plot of the PSD
violin_modes_0.2mHz_resolution_*.txt full data for the PSD (in a range centered at 507 Hz)
violin_modes_0.2mHz_resolution_peaks_*.png same lot aa above, but with the identified peaks highlighted
violin_modes_0.2mHz_resolution_peaks_*.txt list of the identified peaks, same as what is printed on screen

A new PSD from the lock that is going on right now.
Freq [Hz] SNR
501.5550 459101
501.6305 61232190
501.6937 455339
501.7564 867059
502.7844 103124
502.9087 783689
503.0851 4840352
503.1974 2751967
503.6788 69546
503.7344 23972
504.1449 127328
504.1784 1989882
504.6069 31477
504.7199 964331
504.8523 1286321
504.8907 472099
504.9520 417818
505.0795 610232
505.1885 962338
507.3616 2042637
508.8460 4356110
508.9411 155619
510.7133 601203
511.1812 5551906
513.4049 1859193
516.6799 11926450
516.7792 8724
