[Jenne, Craig, PatrickG]
We have a new plotting / calculating routine that will plot a measured DTT transfer function, that has been measured via noise injection. As EvanH points out in alog 27518, data points with only modest coherence will be biased toward unity if you are just looking at the traditional DTT IN1/IN2 transfer function. So, now we have a command line tool that will extract the measurement data from DTT, and calculate the open loop gain from the cross spectral densities, and save a plot. Then, if you want to know what the loop shape would look like if you added some other filters, you can use the second tool to extract filter module info from python, apply those filters to the measured OLG, and plot the result.
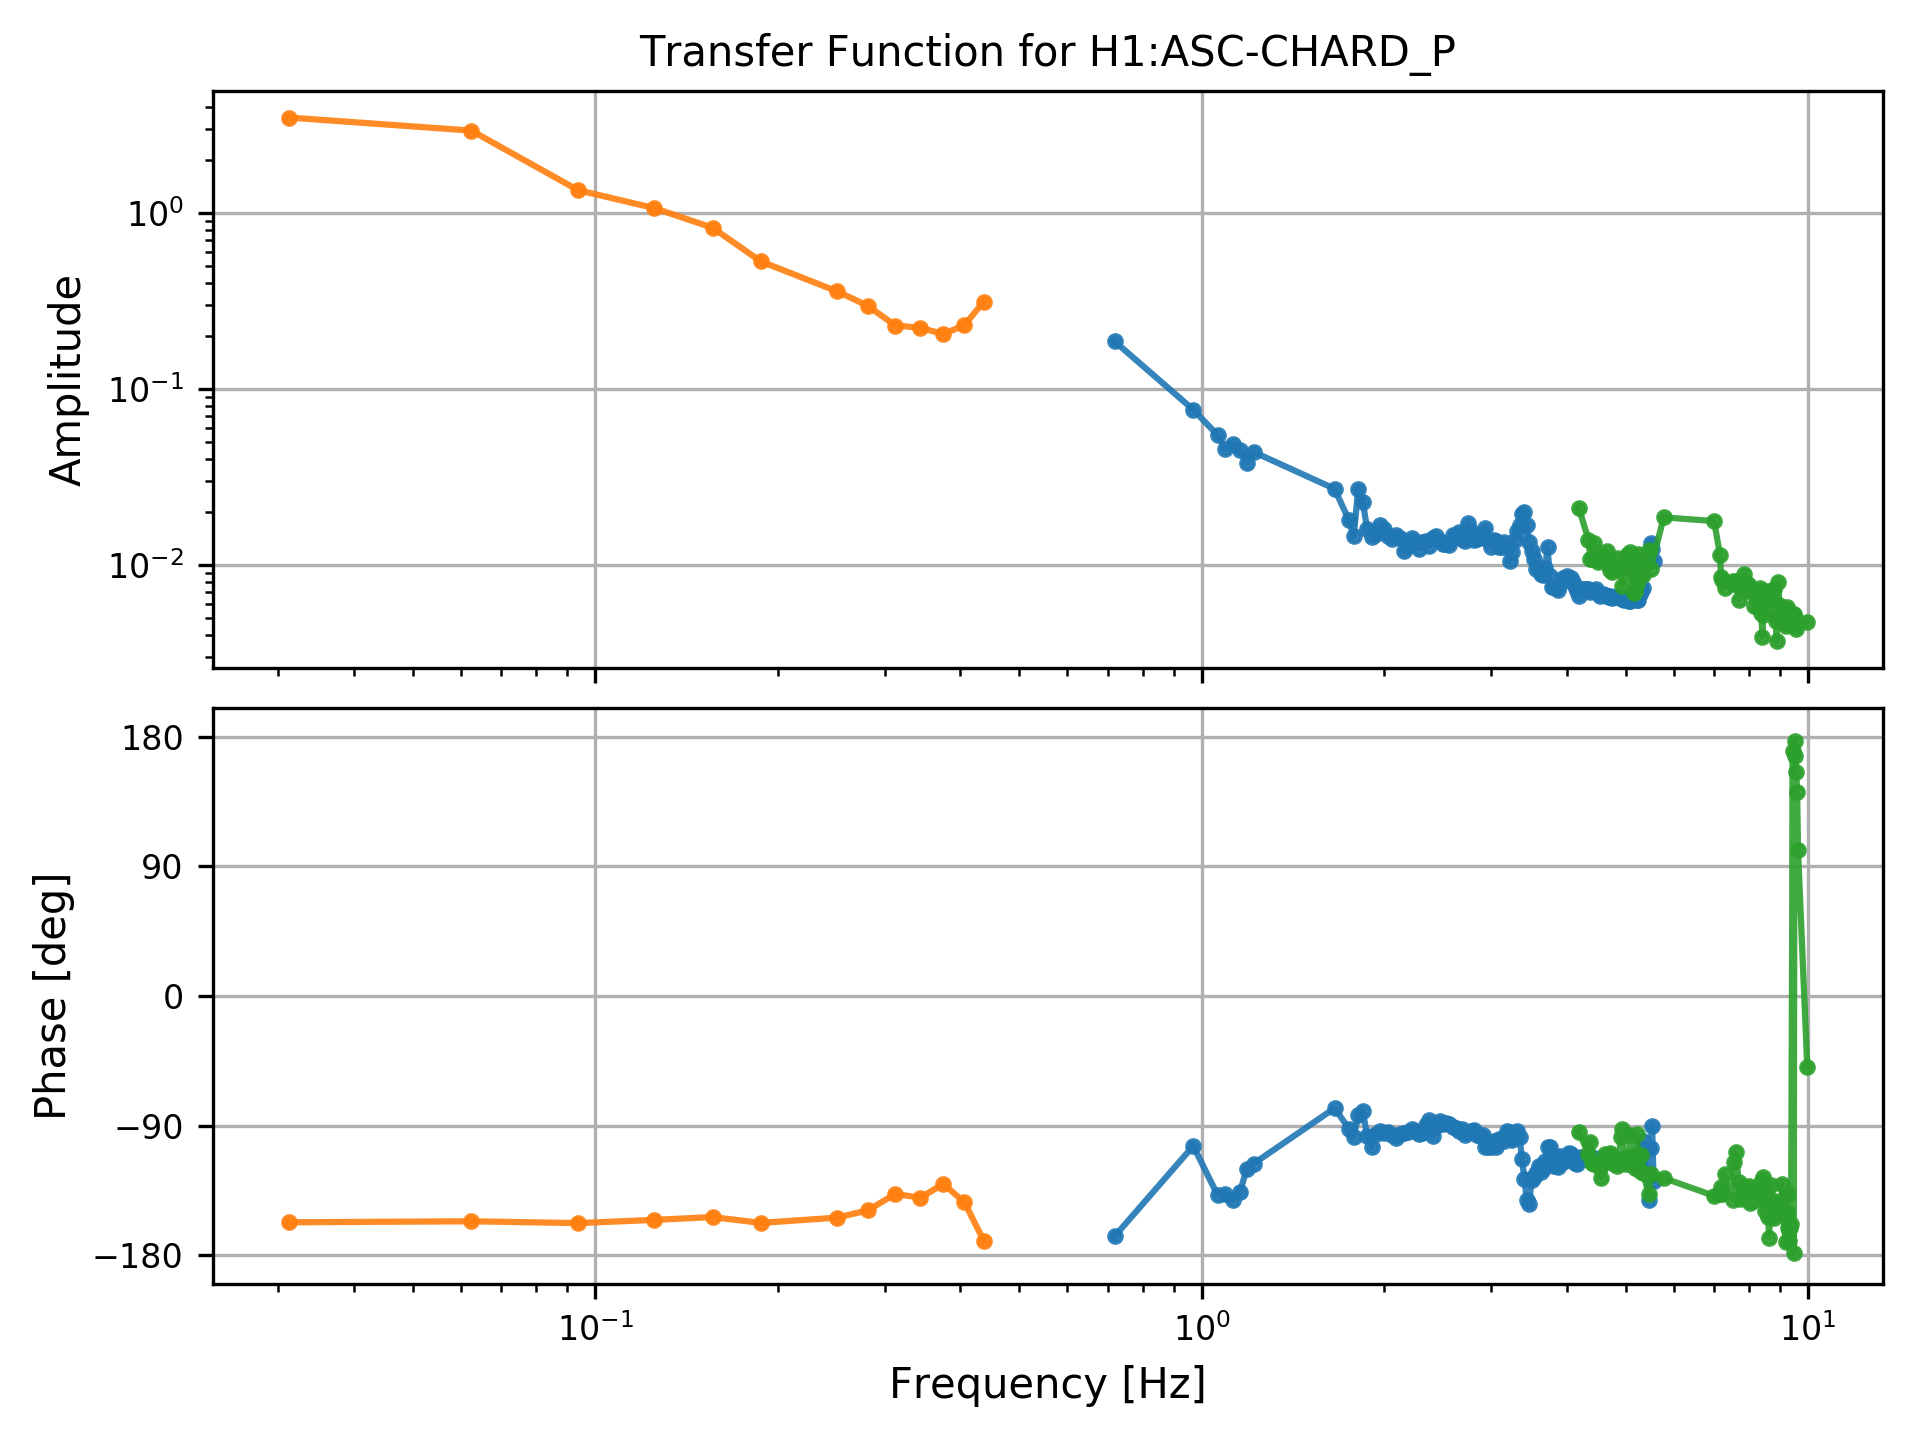
As is often the case with low gain loops (like our ASC right now), we can't push hard enough to excite with noise all of the frequencies that we are interested in. So, I have measured the CHARD loops with several bandpassed noise injections. The DTT extractor cannot get info about references, so each measurement must be saved in a separate .xml file. For example, I have 3 separate .xml files for the CHARD_P measurements that I took yesterday.
The output from the first plotter shows that CHARD_P, as it was yesterday, had very very low gain - see first attachment. Each color is the data from one of the frequency bands, for data points where the coherence between (IN1 and EXC) and (IN2 and EXC) are both greater than 0.5.
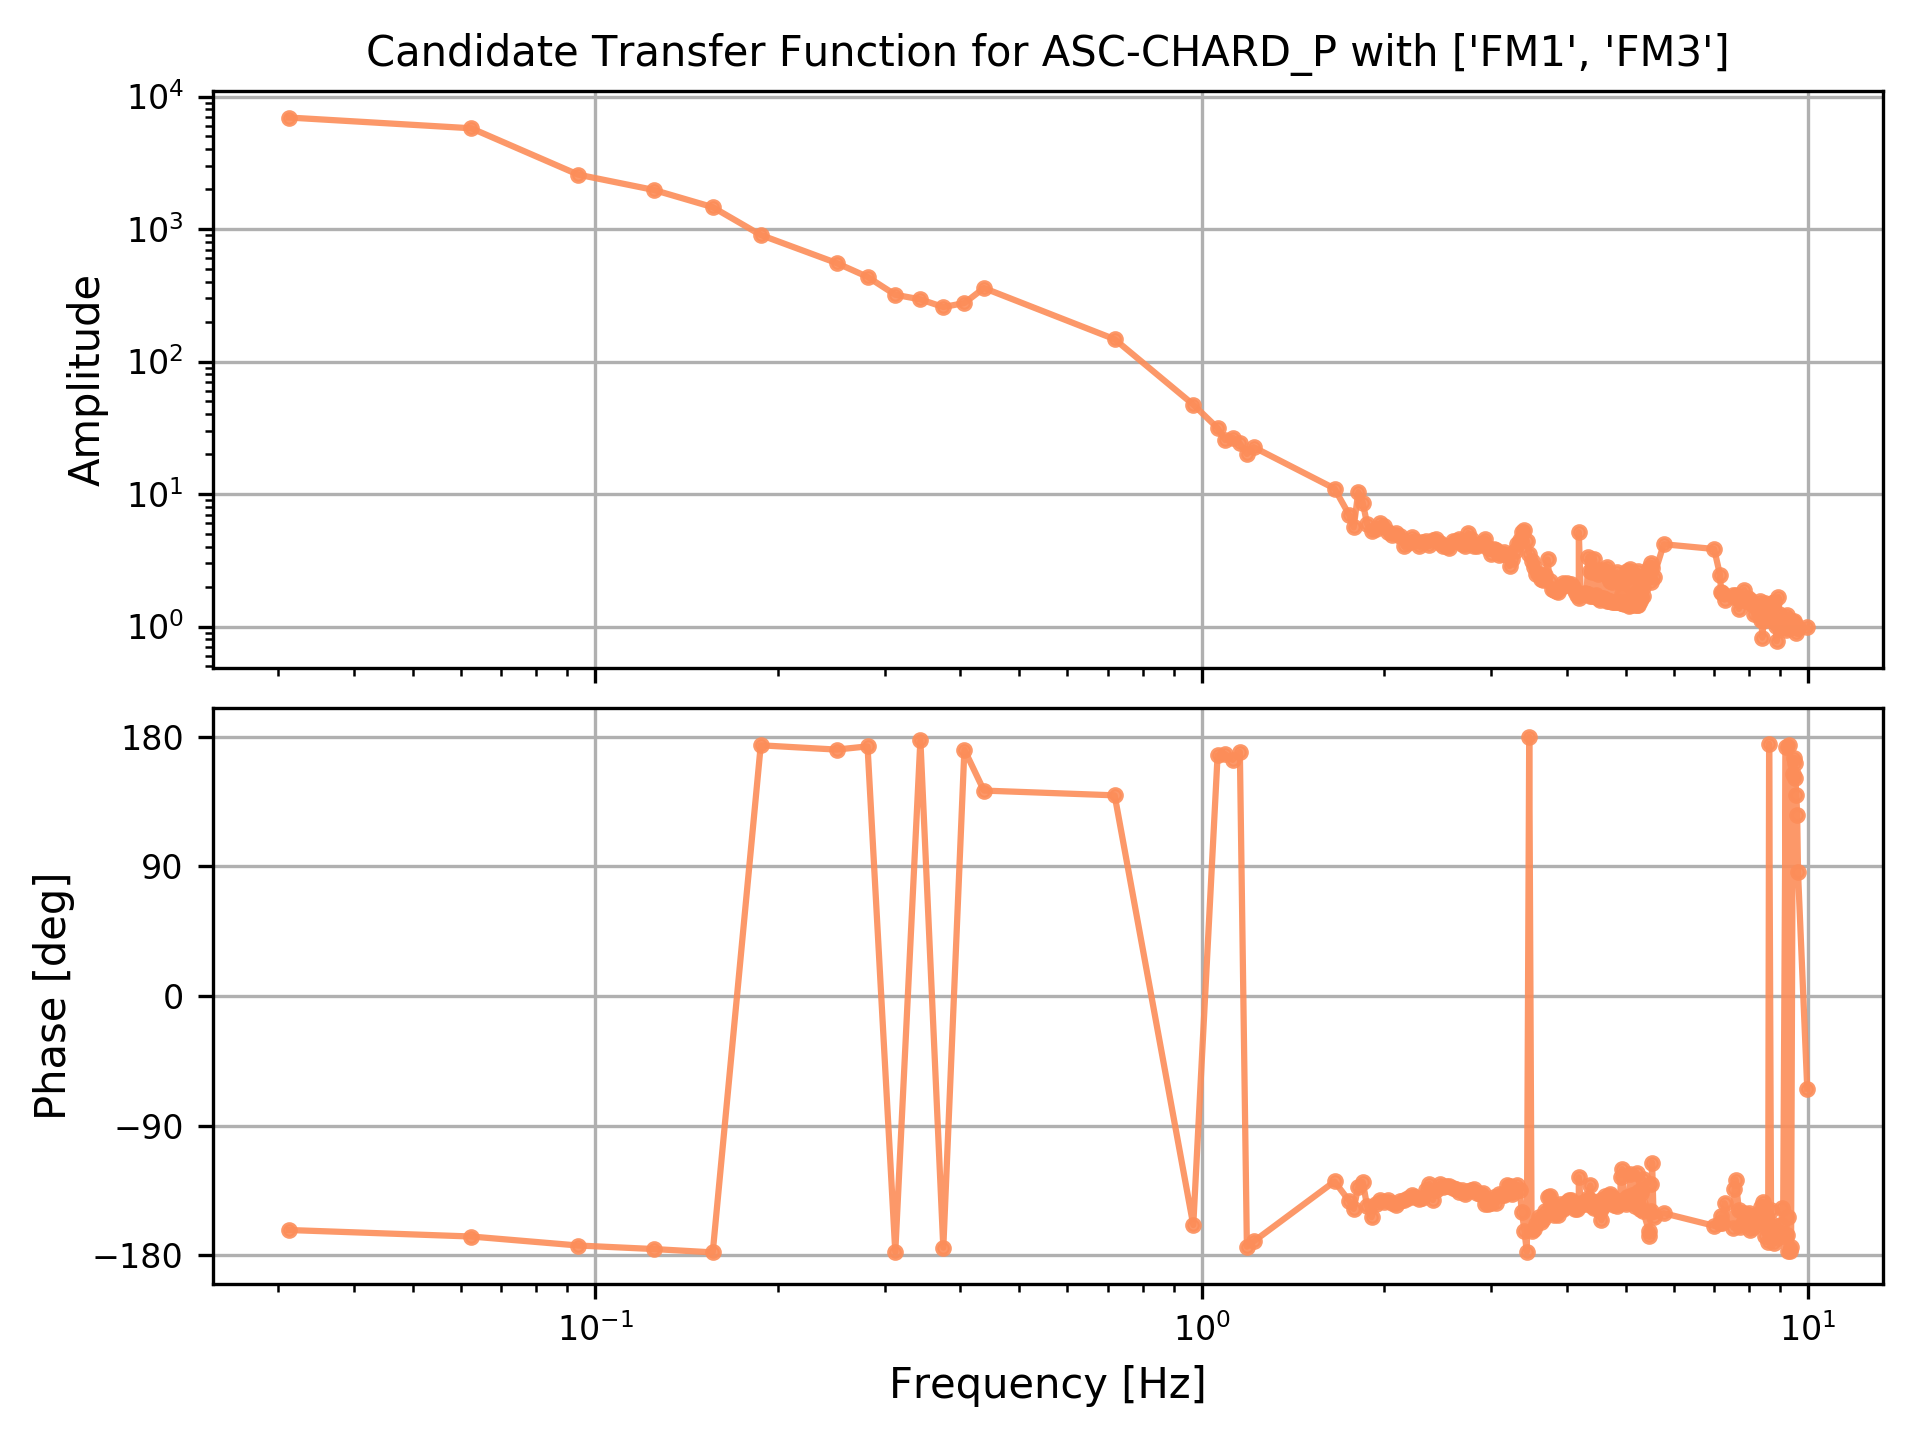
The output from the second - see second attachment - is the measured TF from above, with the indicated filters applied (here, FM1 and FM3, which is what guardian wants to have turned on for the power up). You can see that if we were to include both of these filters, we'd be unstable around 9 Hz.
Things that would be nice to add: a user-chosen coherence threshold, and the possibility of a user-defined gain value, and plotting of the loop suppression, so we can see if there is any expected gain peaking in the candidate OLG. Farther-future would even be to add error bars to the measurements, given the coherence. Also, a more generic location for the scripts.
For use right now (in a folder that contains your DTT .xml files):
>> /ligo/home/jenne.driggers/git/dtt_tools/bin/stitchTFs.py *.xml (In the case that you want all .xml files from this folder. Otherwise list them explicitly, space separated) This extracts the measurement data, saves the plot and the calculated OLG.
>> /ligo/home/jenne.driggers/git/dtt_tools_bin/plotFilters.py filename.h5 FM# FM# (The previous command saves the .h5 file, so pass that file name to this script. Then list the FMs that you want to add, space separated) (ex. filename.h5 FM1 FM3)
I made the above script work with swept sine TF measurements as well.
Keep in mind that you must source a python anaconda virtual env for this script to work: the version of python on the control room computers is ancient.
Proper instructions are here.  Quick and dirty terminal commands copied below.

source /opt/rtcds/userapps/release/cds/h1/scripts/setup_anaconda
source activate python_for_dtt

Now you're in the environment and can run Jenne's commands above.