[Team TCS]
Last night we ran a low power (0.5 W to upper and lower RH stages) long duration (3 hours) ring heater test on ETMY.
The ETM deformation is visible on the Hartmann wavefront sensor, and the change in spherical power is similar to an identical test we did on ITMY two nights ago.
The prism x and prism y values, a measure of the wedging seen by the HWS, indicate that there is some misalignment from the center of the optic, more in yaw than in pitch. This is shown in the middle plot of the first attachment.
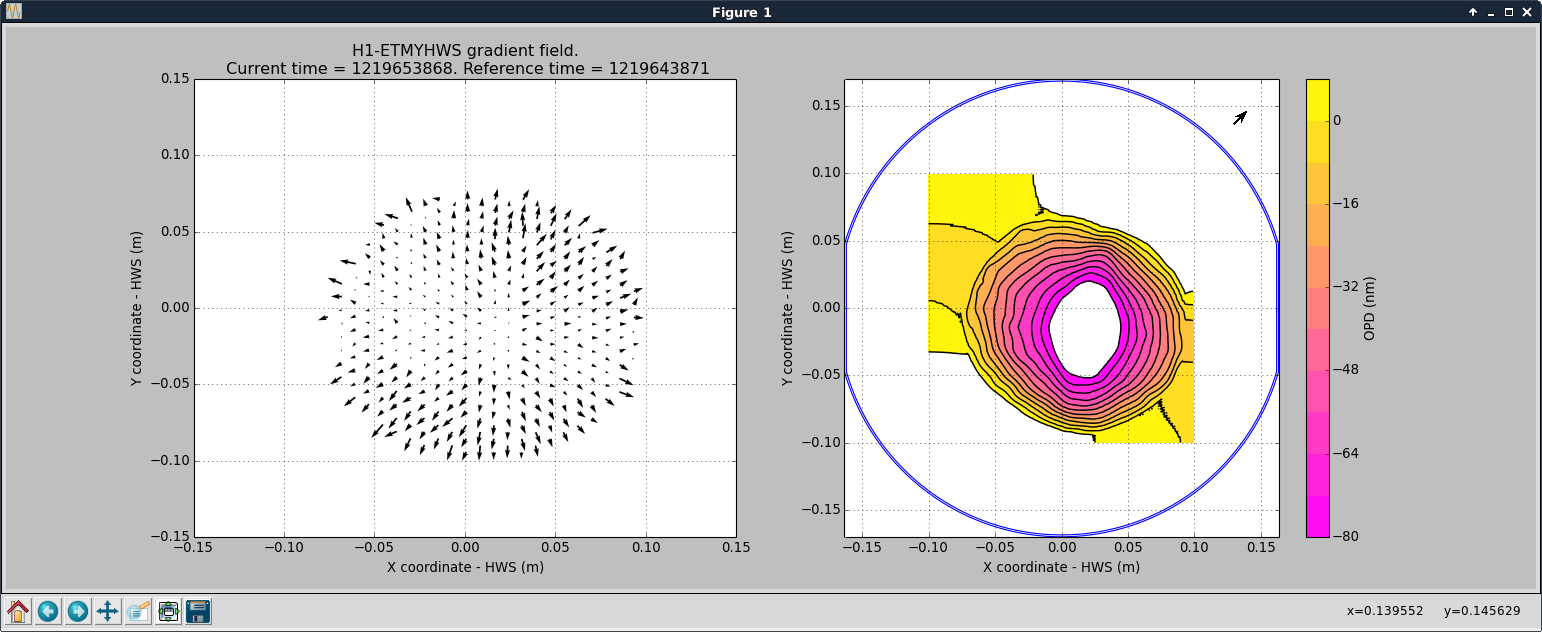
The second attachment is a contour plot, comparing a reference time just before the ring heater was turned on, and a "current time" once the prism values had reached a steady state. The hole in the middle might be because I did not reset the frame rate after starting the Hartmann code?
Edit: The hole in the second plot is due to the scaling, set in the plot contour script. I've rerun the script on the h1hwsmsr computer, where TVo has added an autoscale option, the result is attached as the thrird plot.

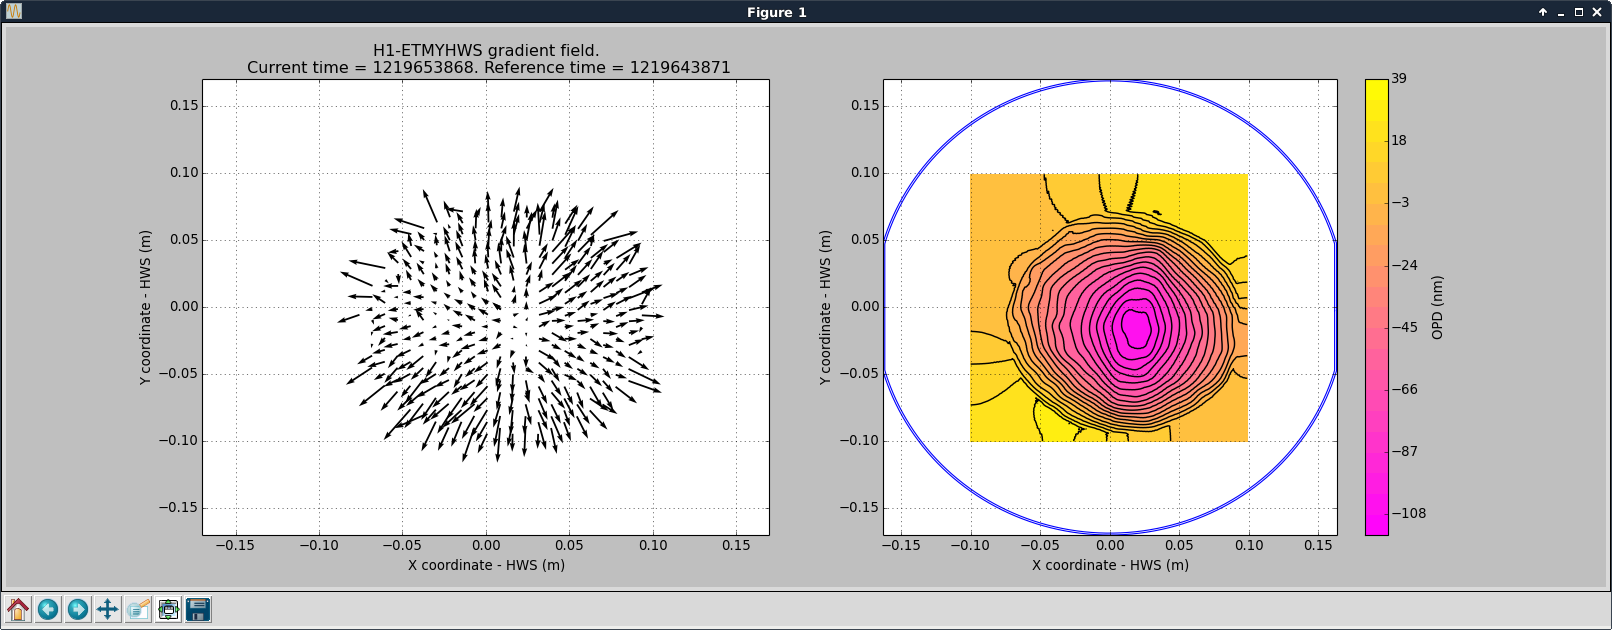
Awesome!!! That hole is a bit odd though, I don't see how the frame rate would affect this. Changing the frame rate should only lead to longer/shorter exposures.