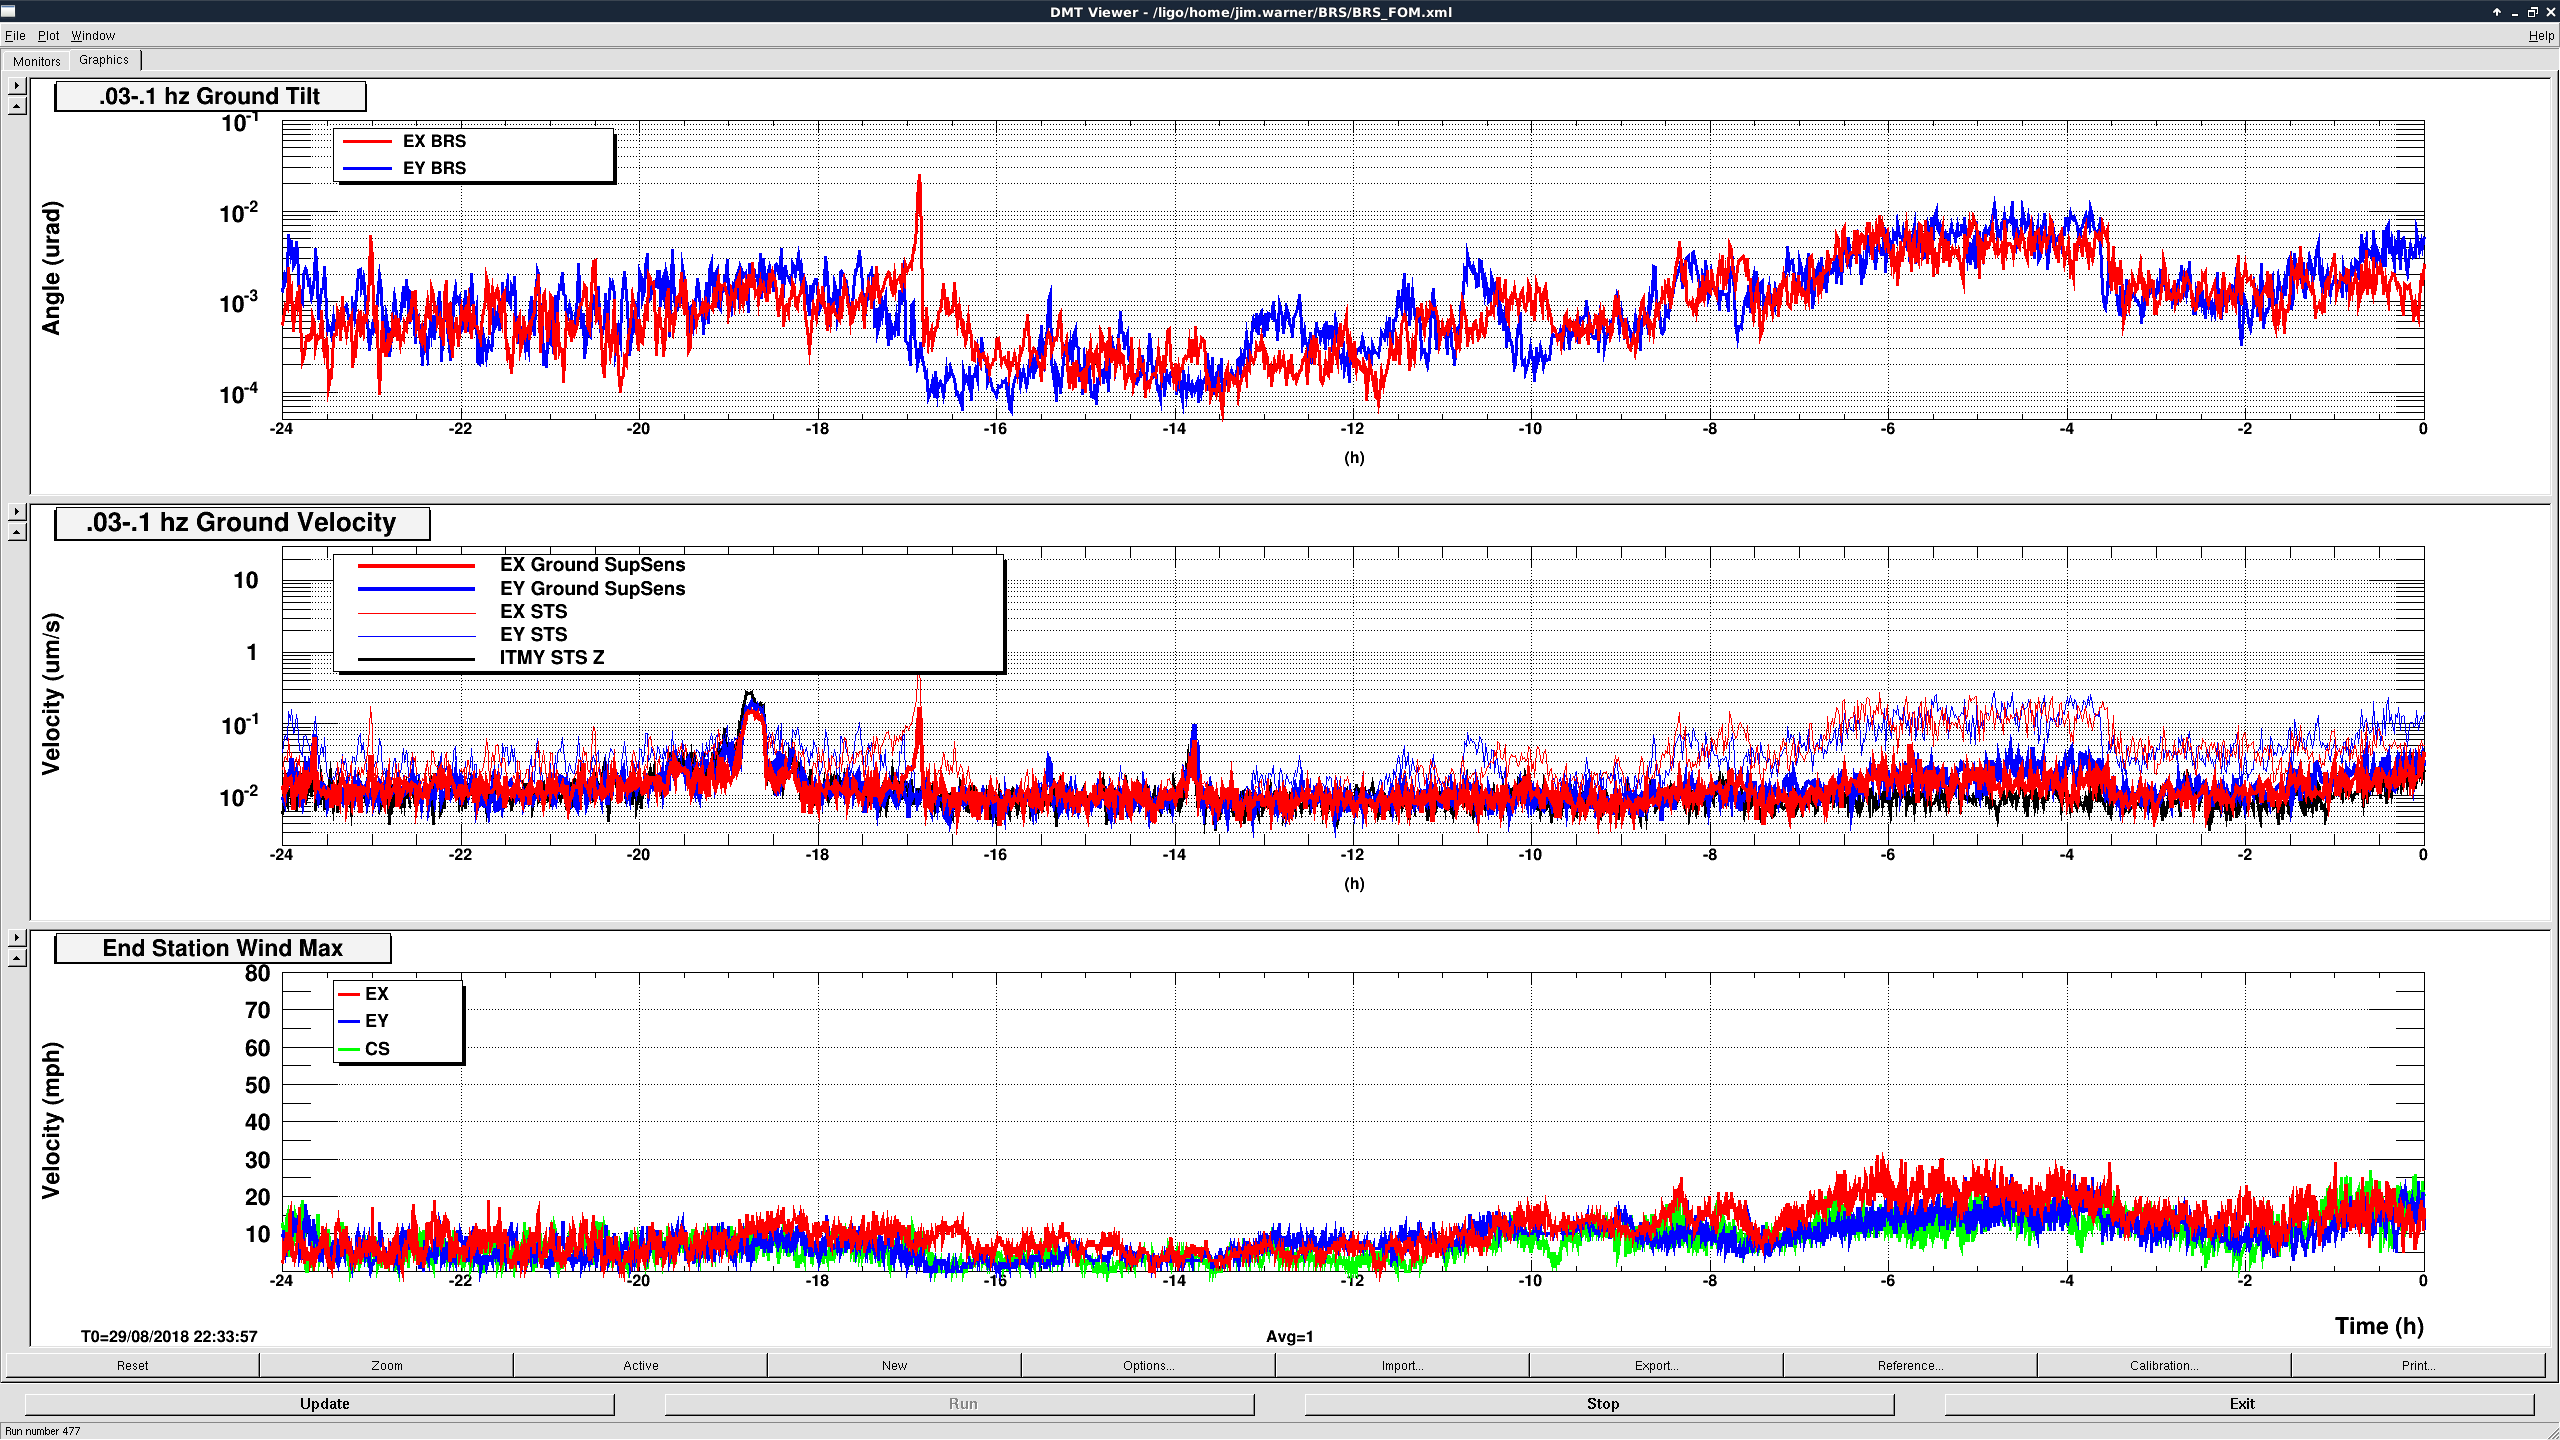
We have had BLRMS channels for the BRS and tilt subtracted end-station STS for a while, but we haven't yet put them on a wall FOM. JeffK made a suggestion in https://alog.ligo-wa.caltech.edu/aLOG/index.php?callRep=43213. I'm making a slightly different one. Attached image is my low freq DMT template. The top plot is the .03-.1 hz blrms for both endstation BRS, middle are the .03-.1 hz blrms for the endstation beamline supersensors (thick red and blue) & (unsubtracted) STS (thin red and blue) and the ITMY Z STS (black). The bottom plot are the (I'm assuming minute trend?) max wind speeds for the end and corner station. All three plots are 24 timeseries for the channels, but the DMT channels are for 48 hours, so the plots could be extended.
I like this because it lets you see most of the <.1hz information we have, disambiguates tilt and displacement and shows the performance of the BRS subtraction. I don't like how many traces there are on the middle plot and the skinny lines are hard to make out, but they are mostly the same information as the the top plot. I would like to use this to replace the wind plot that we have on the wall, then we could free up space on the current low freq wall blrms screen.