Since I could not lock the IFO due to the slow controls at X end, I decided to follow a different approach to characterize the CHARD yaw loop.
Single test mass measurements
First of all, I measured the pitch and yaw plants for each test mass, in standalone configuration, i.e. driving an excitation on the ISCINF pitch and yaw inputs, and measuring the motion using the optical lever. All measurements are high resolution (10 mHz) and gave me good coherence between 0.1 and 4-5 Hz. See below the results for pitch and yaw and all test masses:
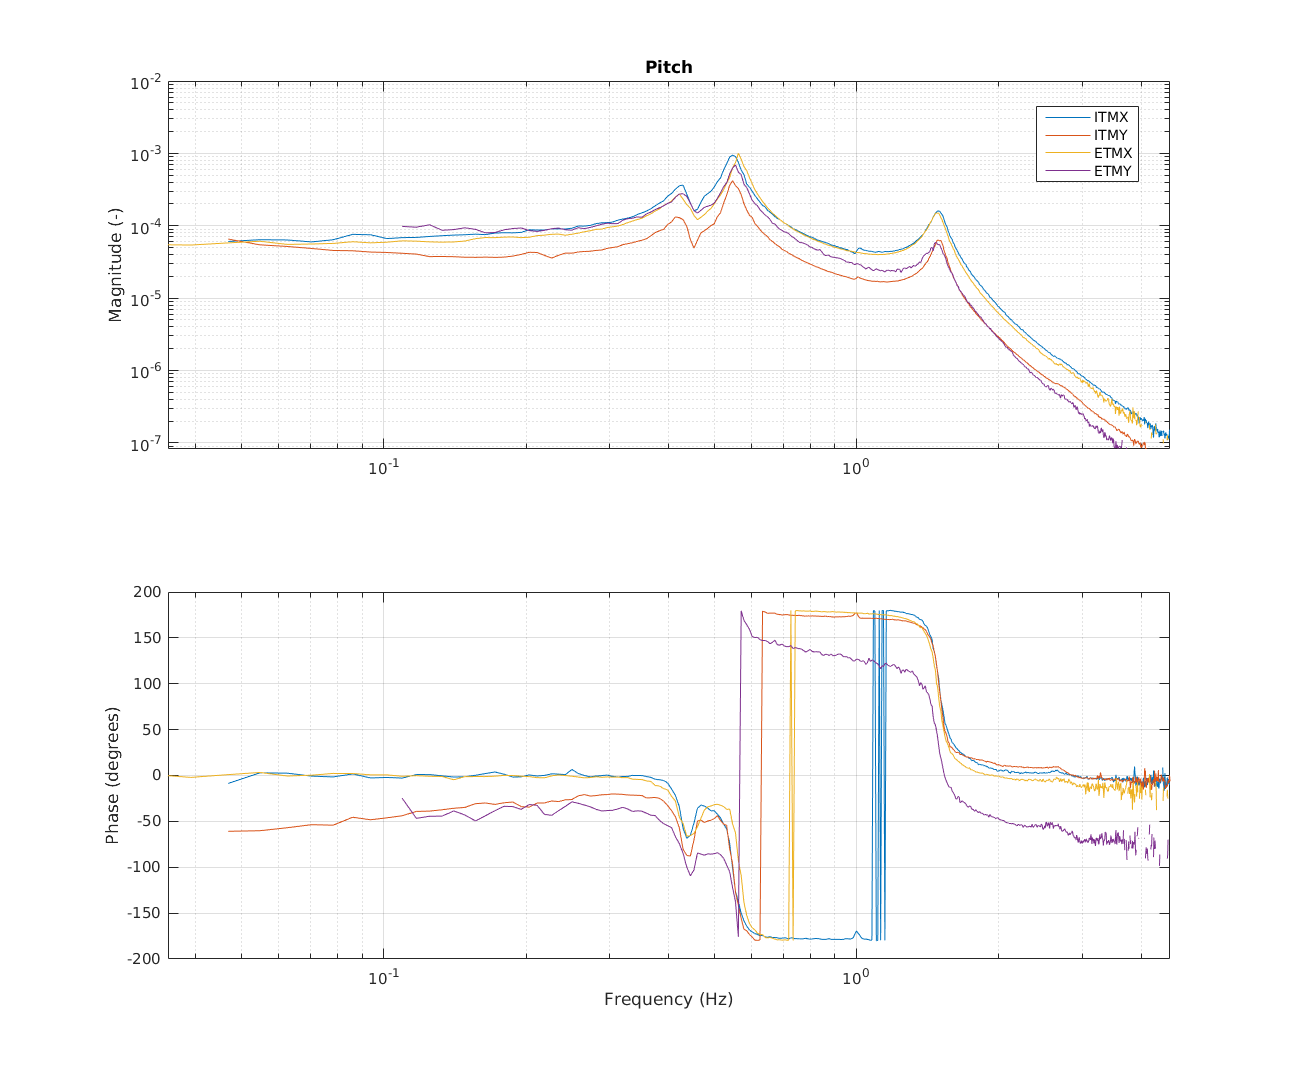
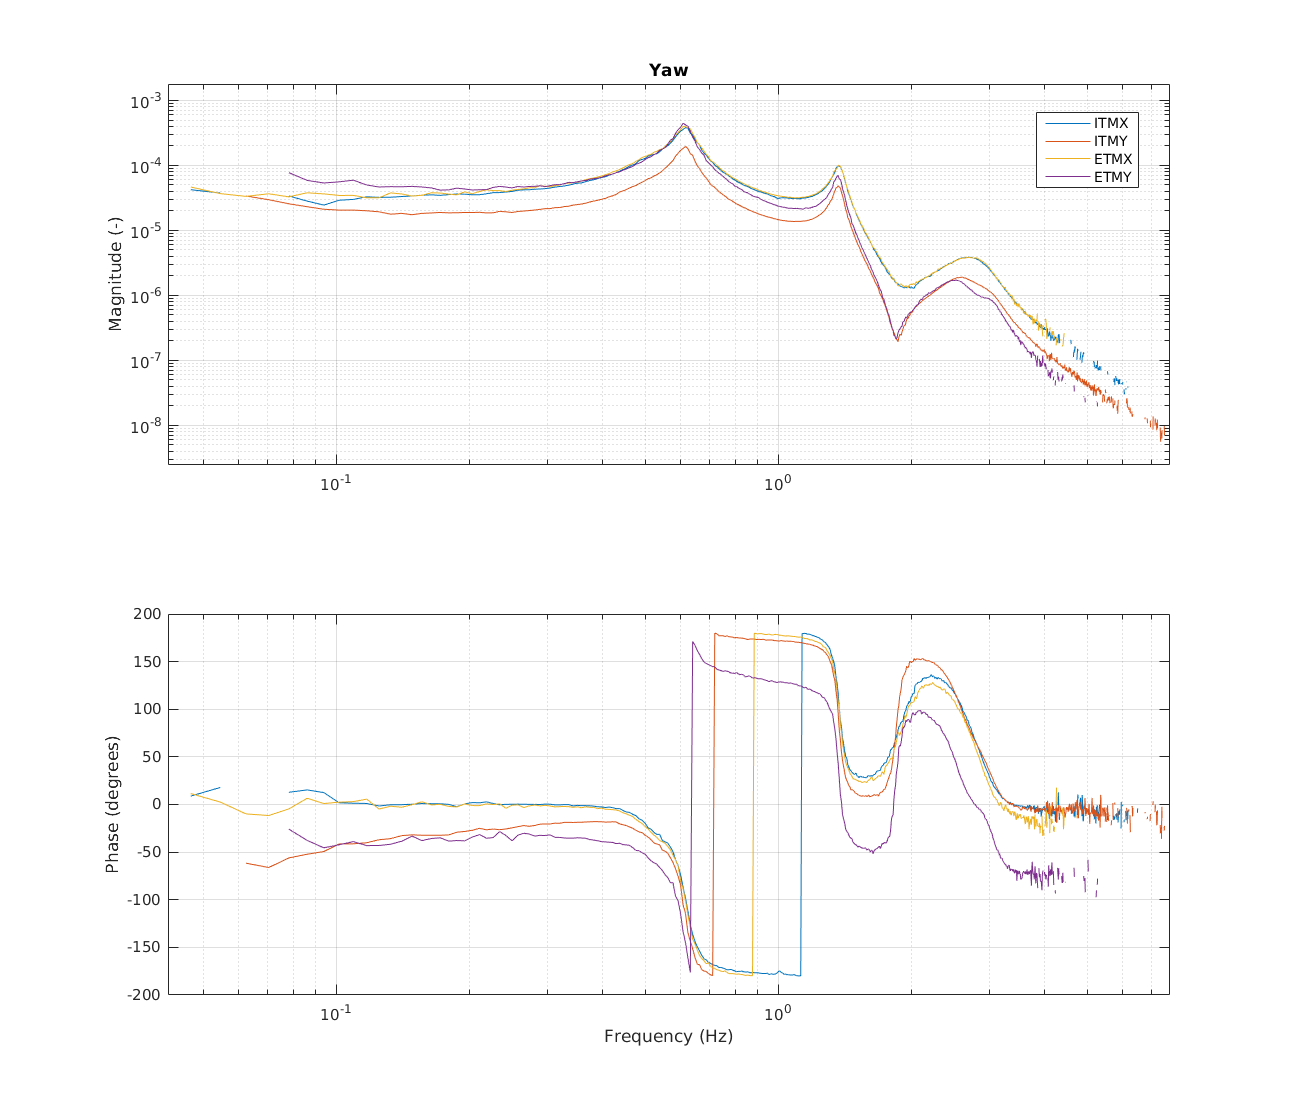
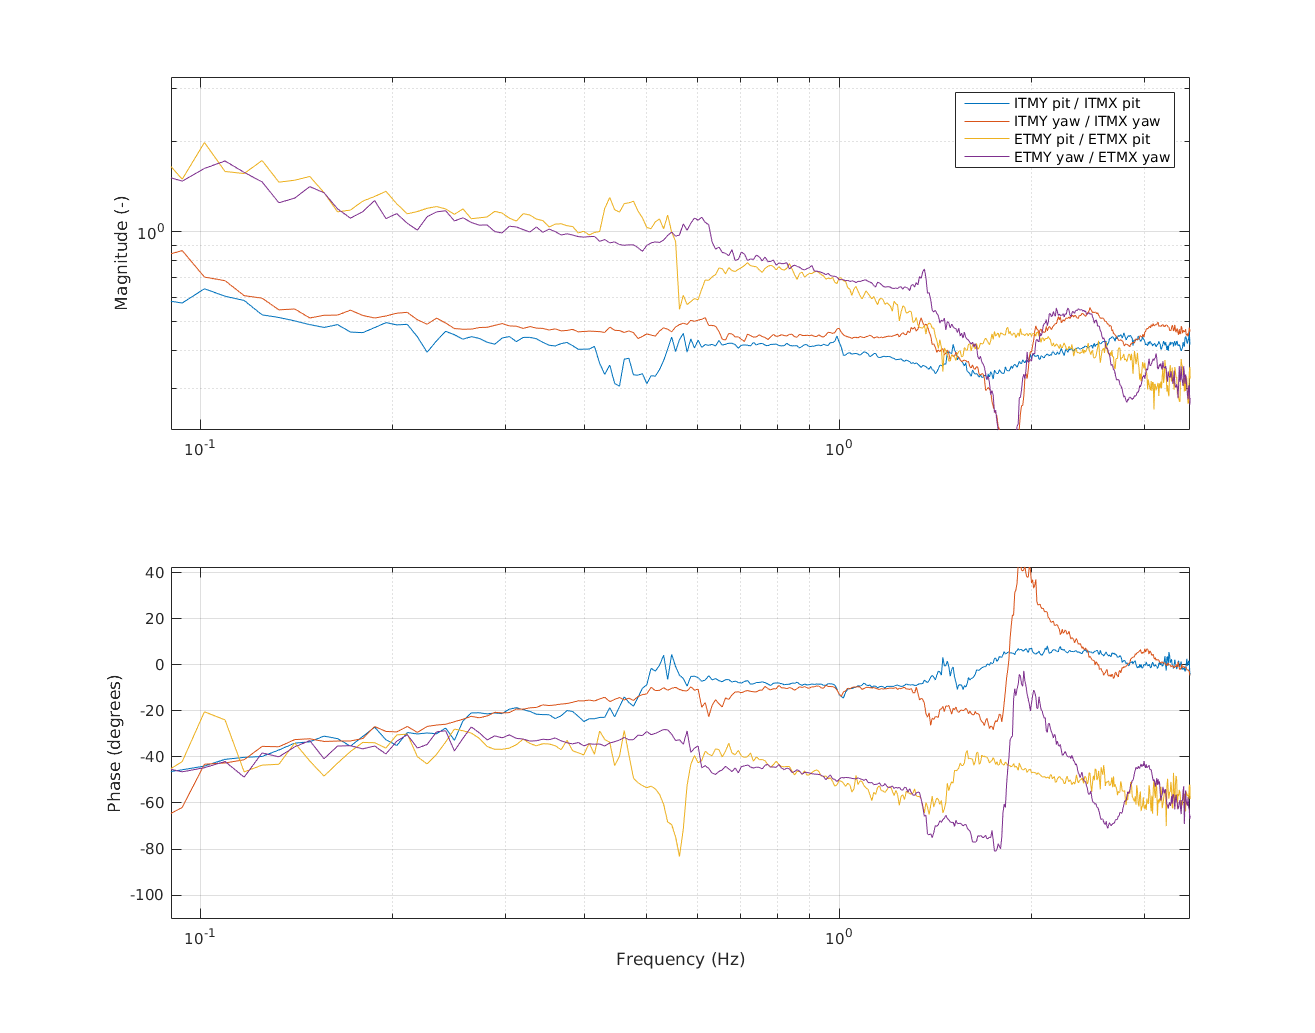
The first observation is that ETMY behaves in a different way than all other test masses: the response has a steeper slope and there is an additional phase lag. To be more precise, the plot below shows the ration of the two ITMs and of the two ETMS, in both pitch and yaw. Again, the two ITMs have similar shapes, while ETMY is clerly steeper than ETMX, both in pitch and yaw. The response of ETMY changes more steeply than ETMX, in both pitch and yaw, by a factor of about 5 if we compare between 0.1 and 3 Hz. A cursory check in the SUS screens did not show any good reason for this difference, but honestly there's a lot going on in those models. Nevertheless, this difference is worth investigating, since teh way we decoupled hard and soft modes relies in the assumption that all test masses have the same response.
Also ITMY seems to have a smaller response than the other test masses over all frequencies.
Reconstruction of hard and soft modes
Using the responses measured as explained above, I reconstructed the response in the DHARD, CHARD, DSOFT and CSOFT basis. The assumptions are
- the driving split between test masses is the one contained in the ASC output matrixes
- all optical levers are "cross calibrated" to the same units, so that I can really assume their output is in some physical units (the same for all test masses)
- the geometrical matrices to convert mirror motions into soft and hard degrees of freedom were computed from Sidles and Sigg
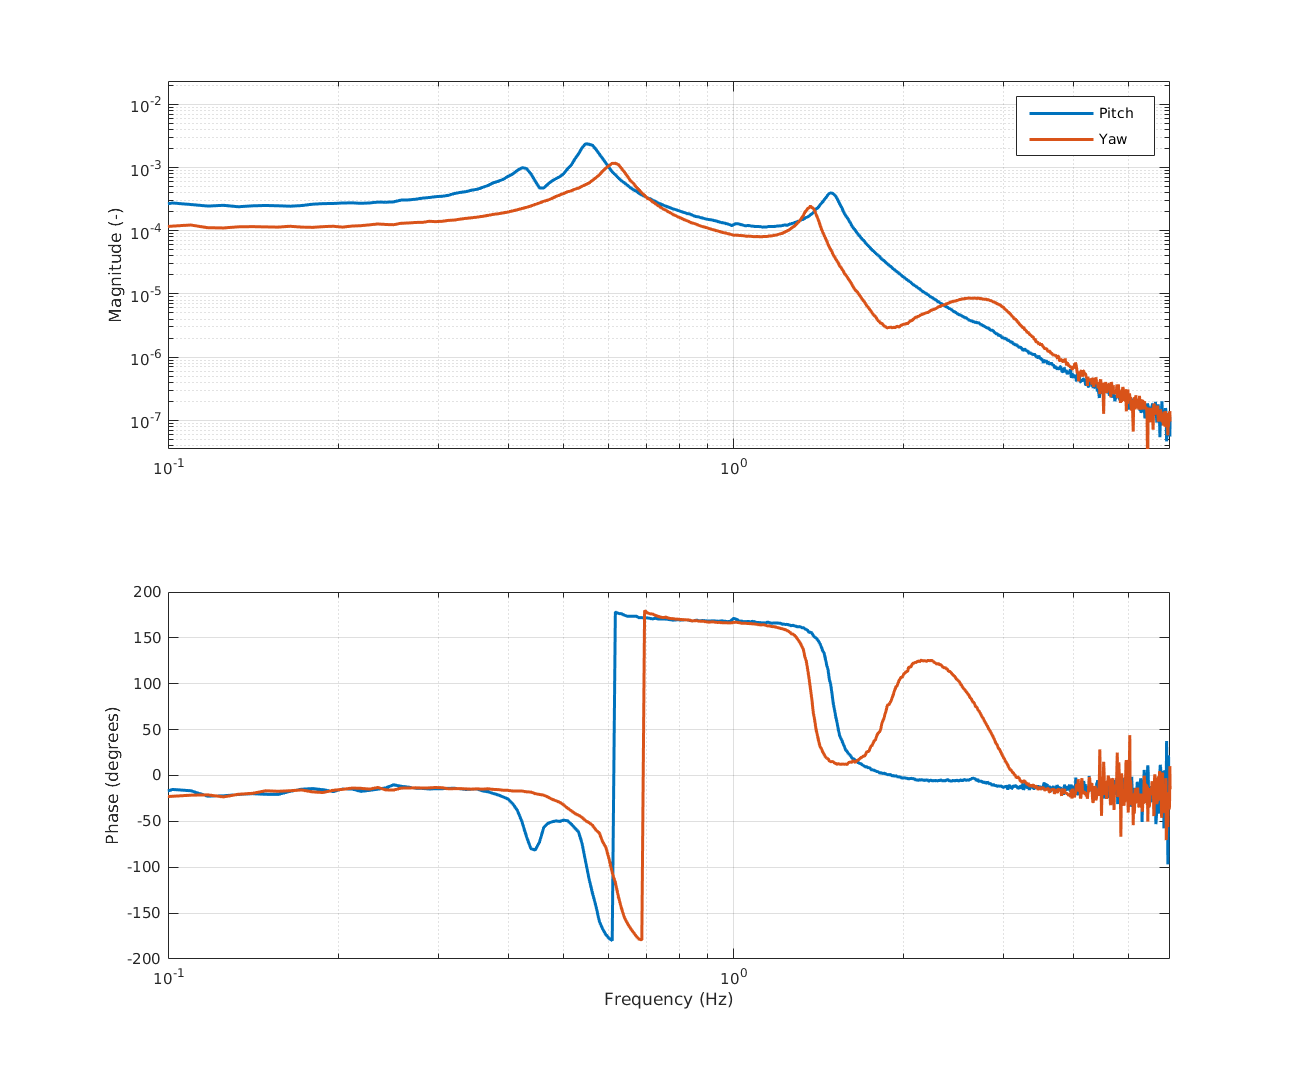
For some reason that I am currently not understanding, my reconstruction is ok in pitch, but swaps hard and soft modes in yaw. Unclear why. Nevertheless, I get a reasonable diagonalization. Below is an example of the CHARD pitch and yaw responses, reconstructed from the local measurements
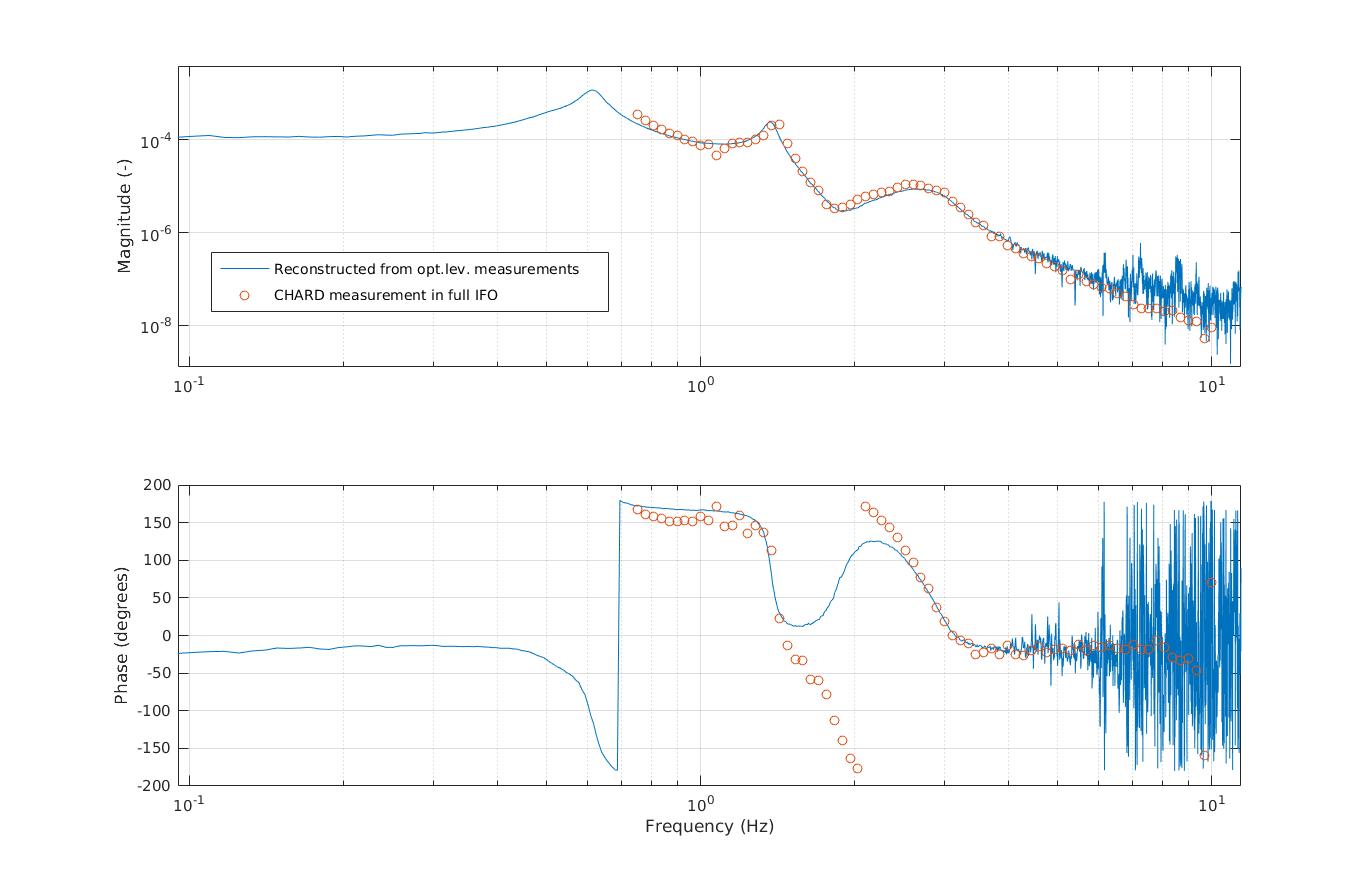
Below I'm comparing the CHARD yaw transfer function measured in full IFO with this reconstruction. The magnitude (rescaled with a overall gain) matches quite well, but clearly the transfer function measured in full IFO shows a significant phase rotation between 1.5 and 2 Hz. Incidentally, I think this phase rotation is what is causing our problems when we try to increase the gain. Indeed, yesterday I tried to fit the CHARD plant transfer function, and discovered that it's not minimum phase: there is a zero with negative frequency, which is indeed needed to explain the excess phase rotation. We should investigate the origin of this non minimum phase behavior: my bet is on a wrong sign or gain somewhere in the driving matrix, or maybe it is coming from the weird behavior of ETMY. Of course I cannot exclude that my reconstruction of the d.o.f. responses from the local measurements is just wrong.

The ETMY issue was solved, it was related to a mismatch between whitening and compensation in the optical levers. See 43814