
[Sheila, Nutsinee, Terry, Haocun]
We looked into more of the cavity scan of the OPO, especially on the polarization issue.
Several main conclusions are:
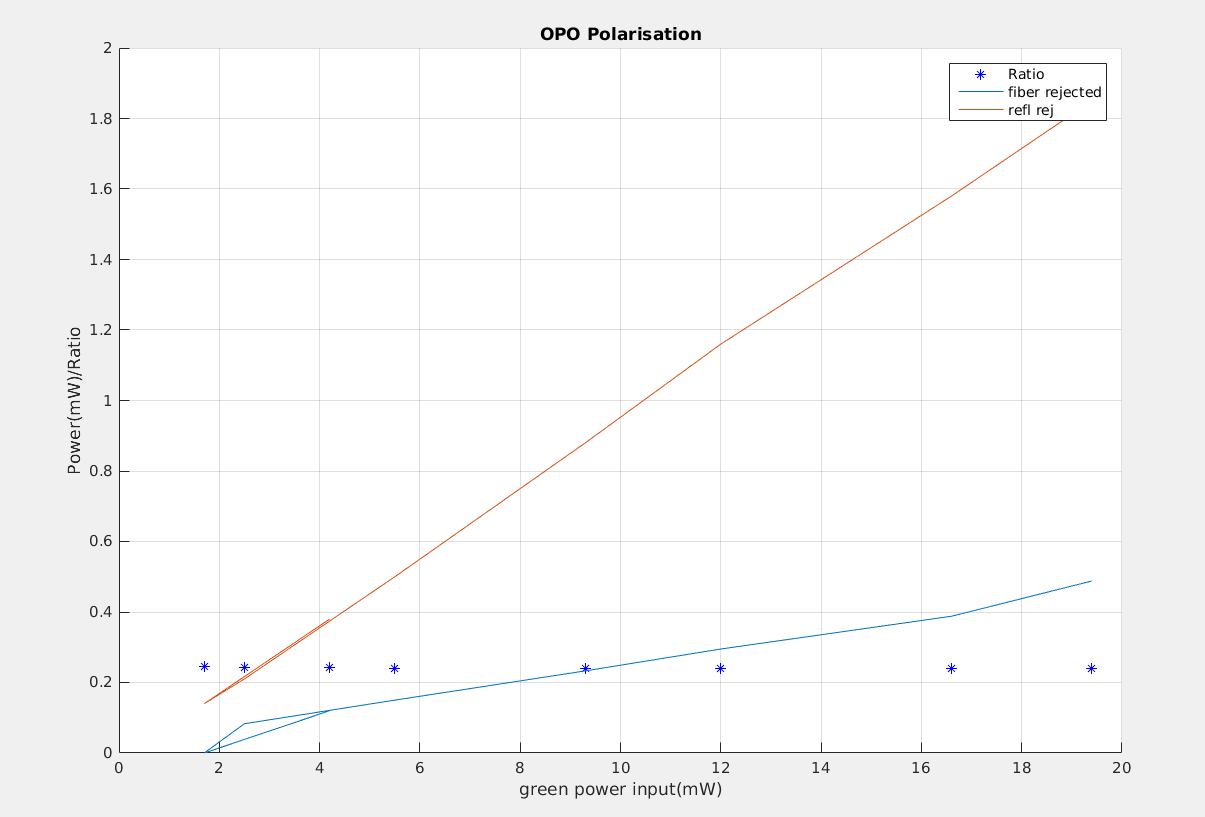
1. We looked into SHG_FIBER_REJECTED and the ratio between OPO_REFL_REJECTED and OPO_REFL under different green power input.
The wrong polarization increased linearly with the ratio remains the same, which means the polarizer on the VOPO platform does work well. (Fig attached 1)
We have a ~7% of power wrong polarization coming out from OPO as measured on SQZT6.
2. I tried to minimize the wrong polarization ratio by tweaking the waveplates before the input coupler on ISCT6, but unfortunately this helped little by only getting a changing of ~0.1%.
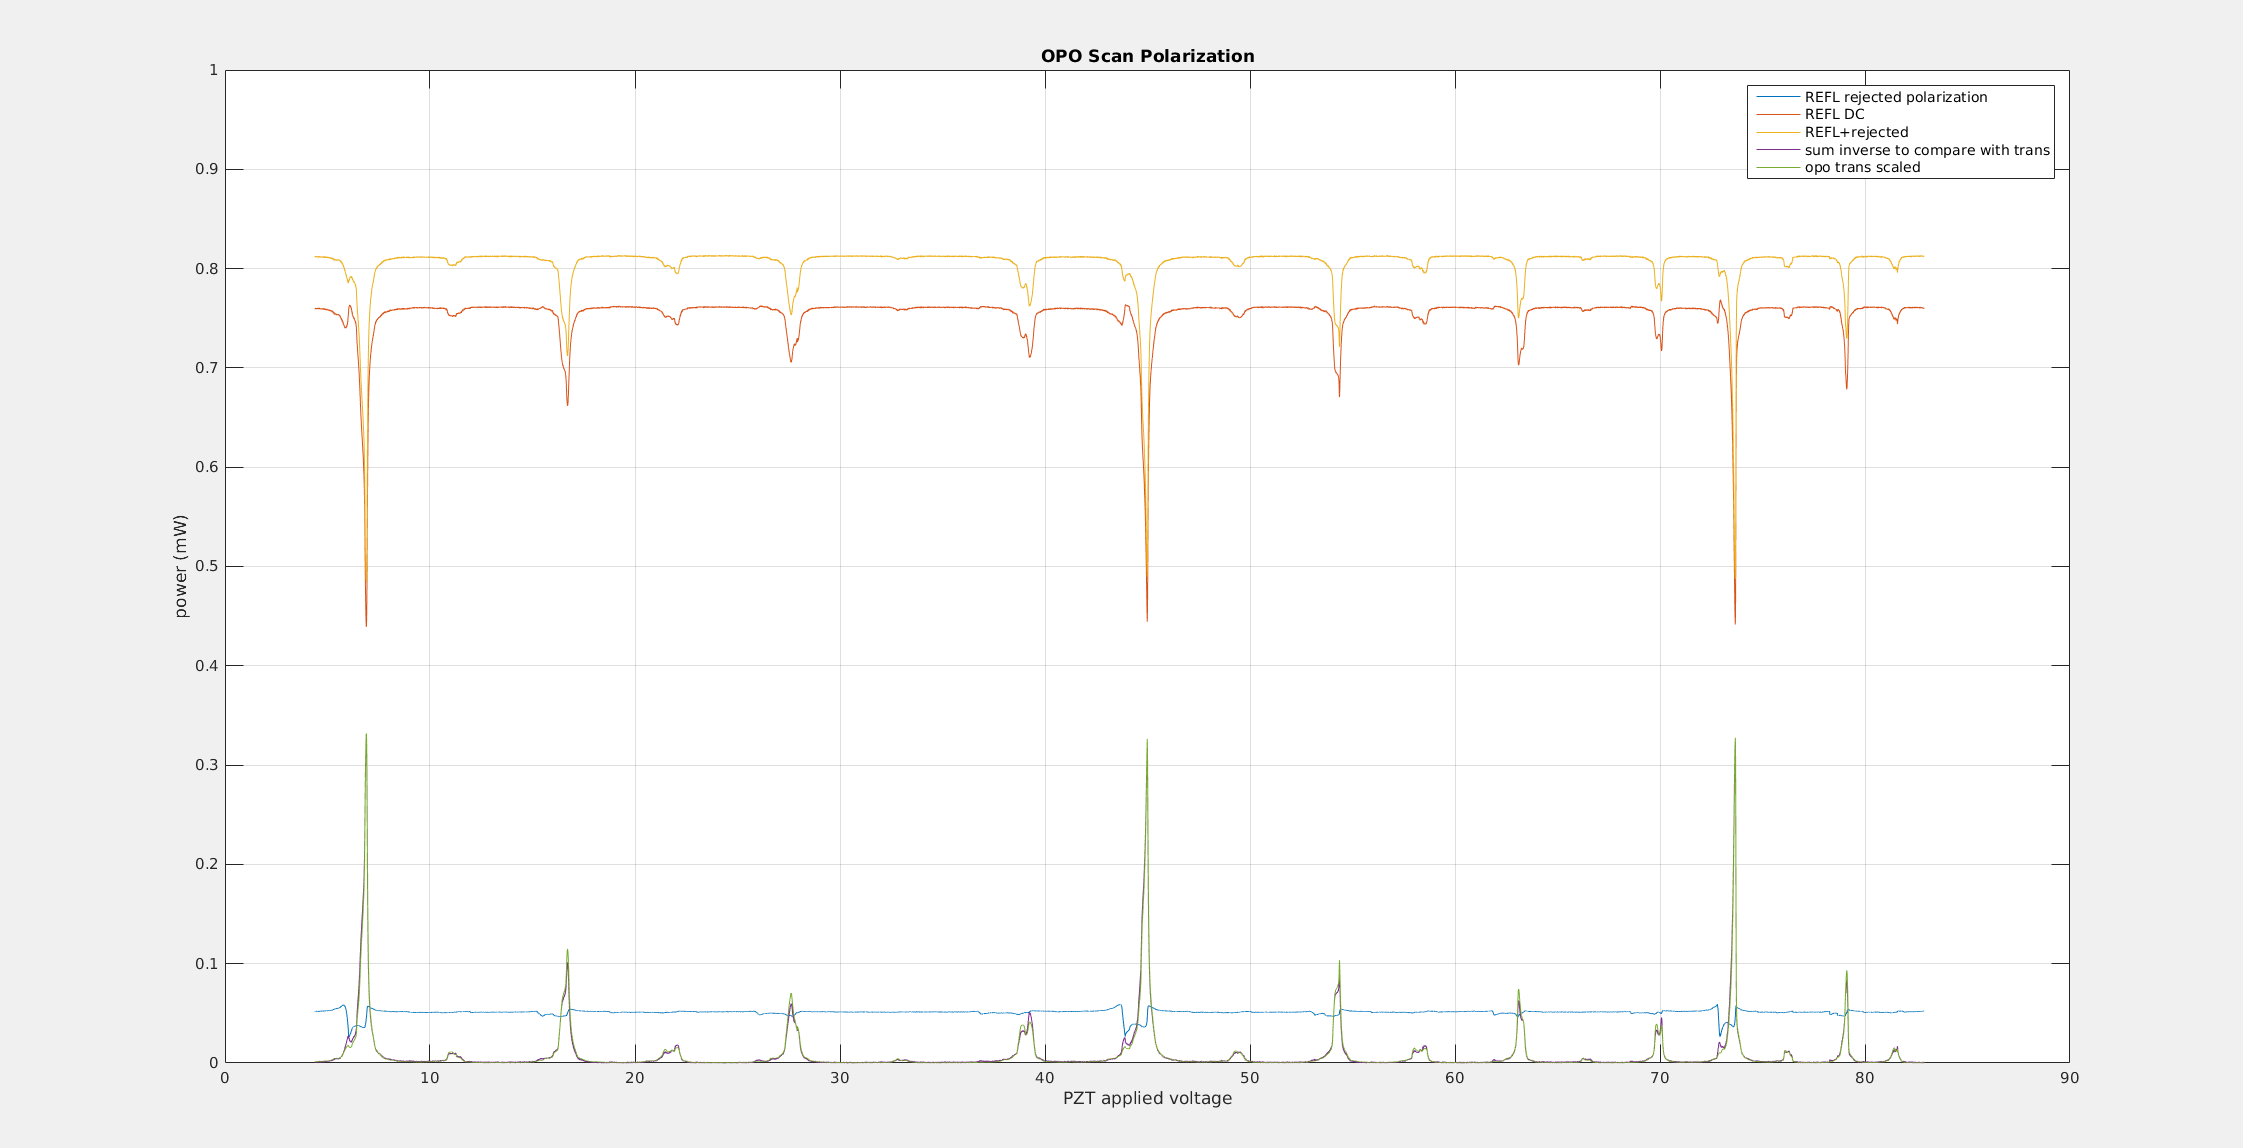
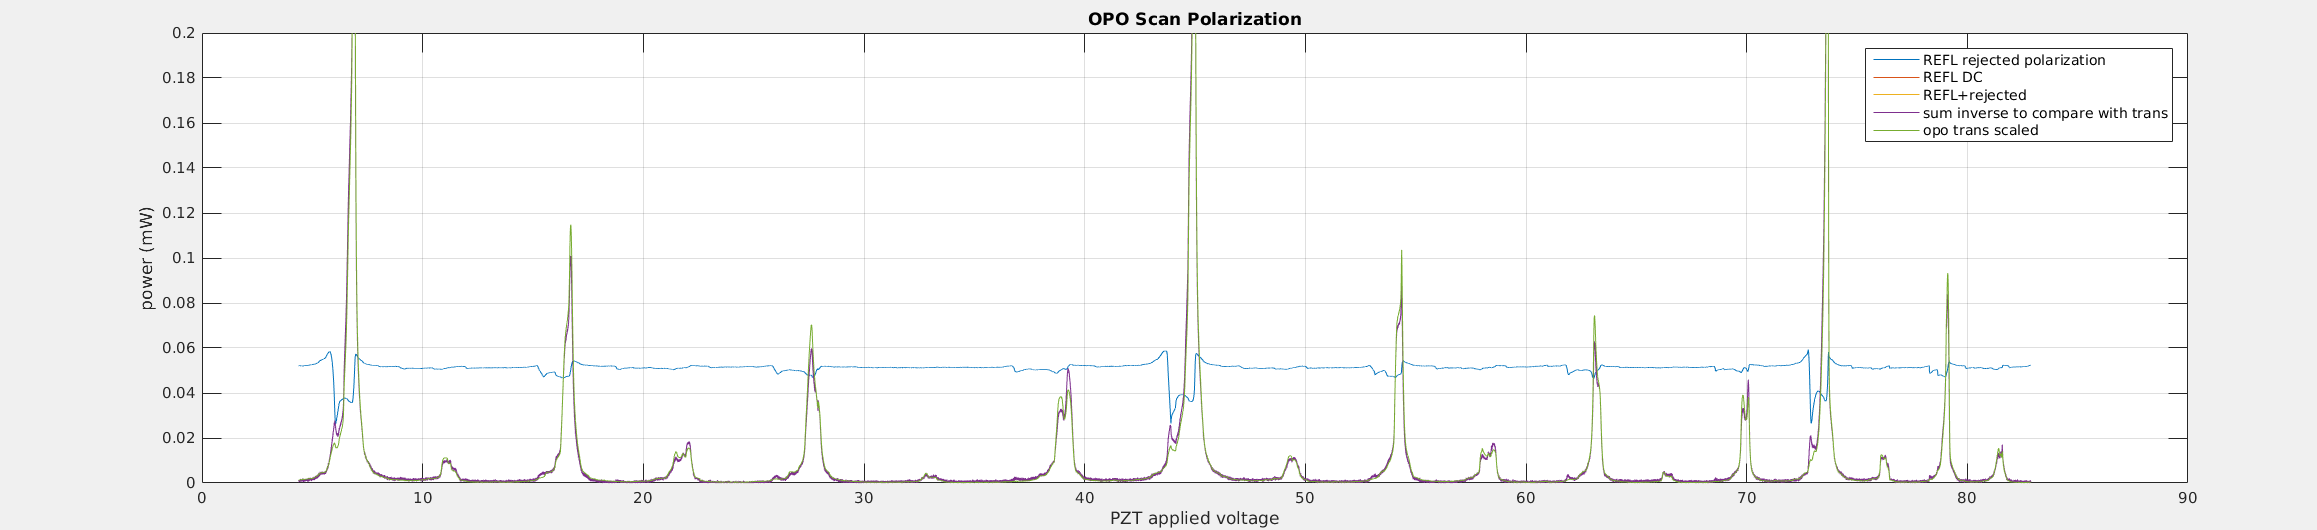
3. We have a polarization mode very close to our 00 mode (~MHz spacing, I will do more precise calculation) (Attachment 2, zoom-in plot 3). This can been seen by comparing the opo trans lining up with rejected.
Not sure yet whether and how this will effect the error signal, etc.
Next steps:
- Modeling of the error signal asymmetry based on PDH and scan asymmetry with thermal expansion.
- Install PBS in OPO Trans path to have a clearer idea on the polarization mode.
- Maybe: tweaking the crystal postilion to see whether we can separate the polarization mode further?
Additional note to what happened yesterday. I think we're close to understand what the heck is going on here.
CR/SB
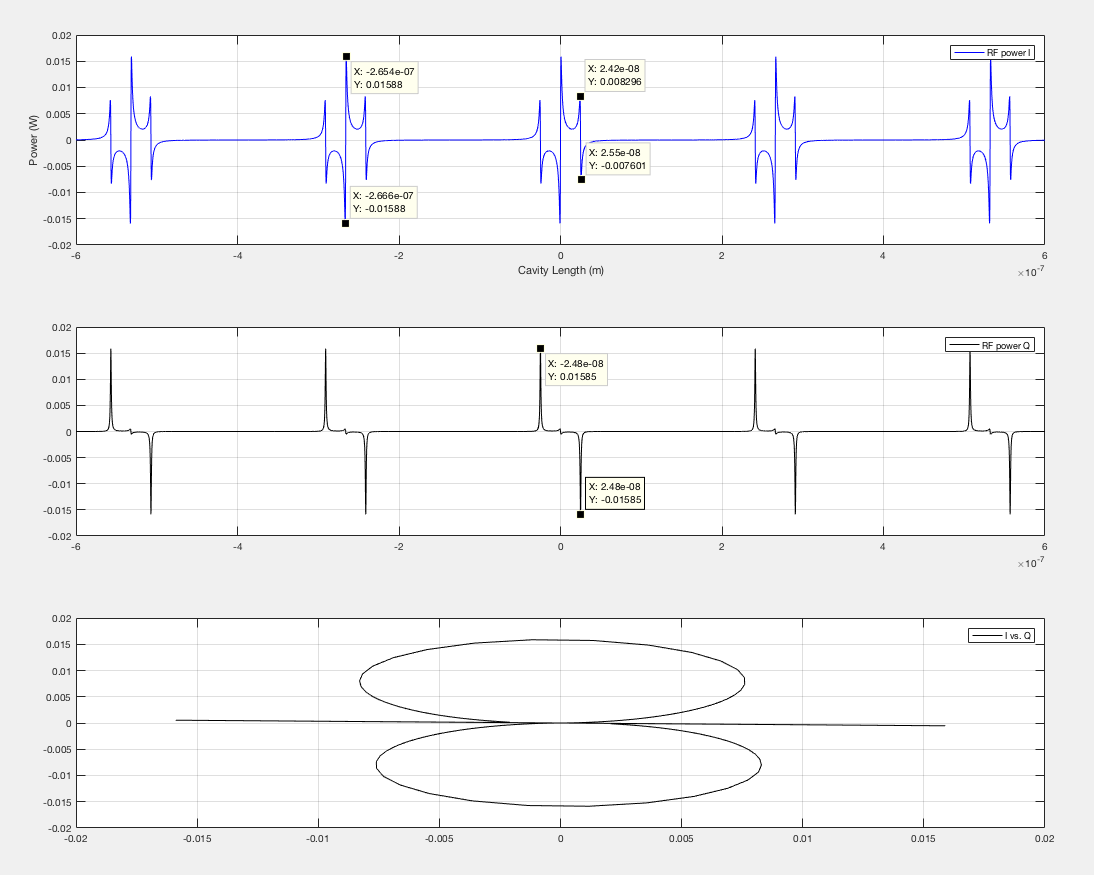
The modeled carrier/sideband RF power ratio is ~2. The plot was modeled and compared with a scan at low power. The measured CR/SB RF power ratio was 1.96. Not too far off.
(ignore the y-axis lable. It should be scope Volt).
Attenuator vs. no attenuator
In case we're saturating the diode at RF Sheila suggested we compared signal with and without an attenuator. The plot below shows the scan from the same green input power, with ND=1 filter and without.
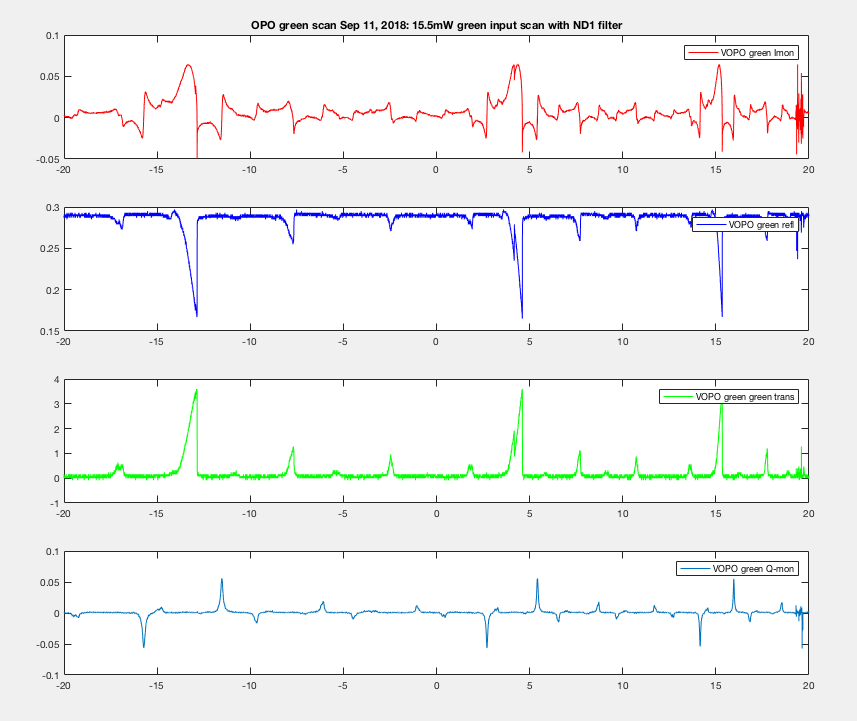
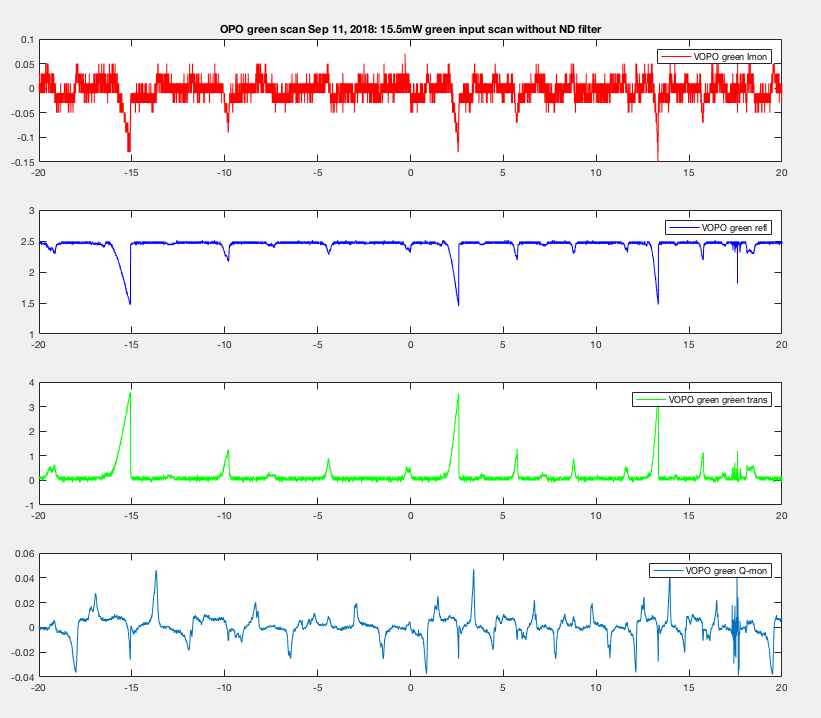
There was much improvement in the error signal with DN1 filter on.
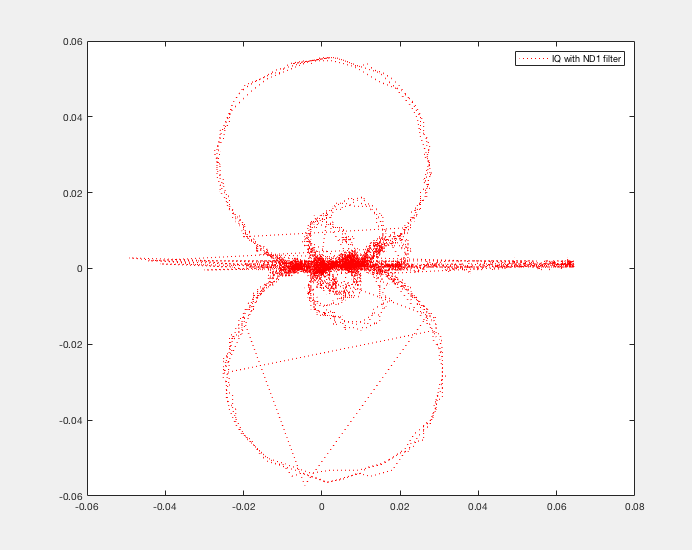
For your amusement here's an IQ plot from data with ND filter. I don't have a nice IQ plot from no-filter because I-mon data was so blocky.
So in summary, we might've been dealing with three problems on top of one another:
1) Thermal heating (modeling work on-going)
2) RF saturation (fixed-ish. If we decided ND1 is a good one to have then I'd call that fixed.)
3) Polarization peak inside the carrier. Terry calculated this peak to be about a 1MHz away from the carrier. -- This distorted our error signal on the left hand side
Judging by the error signal with ND filter on I think the locking issue is mitigated. I haven't tried locking with ND filter in front of the refl yet but the error signal looks linear around transmission peak and crosses zero.
The "polarization peak" is about 0.02~0.03FSR from the 00 mode, or ~30MHz seperation calculated from the plot.