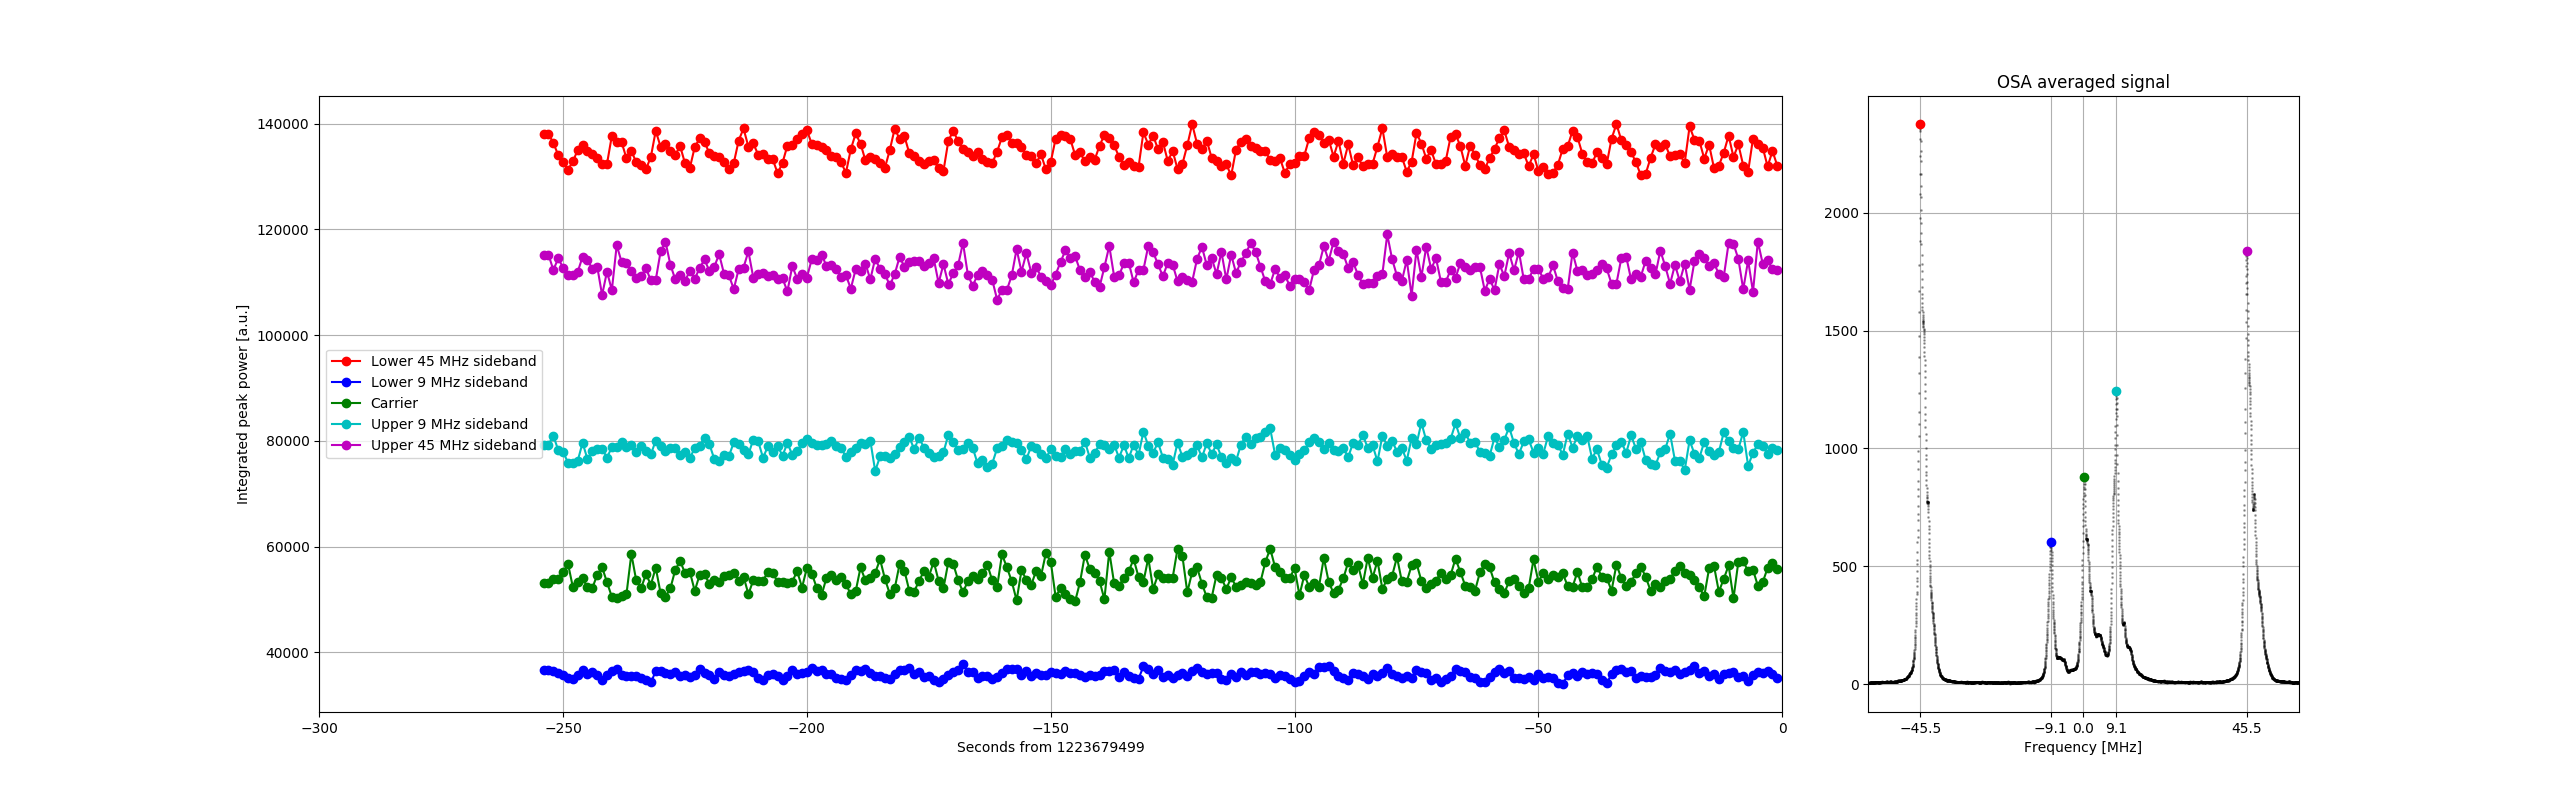
Yesterday Sheila and Danny retuned the OSA: now there is only one scan per second, with better resolution. Therefore the OSA analysis script did not work properly anymore.
Now the script does not average anymore multiple scans (since there's only one scan per second). Since the 9 MHz are well resolved, I removed the complicated fitting procedure, so that now each scan is analyzed as follows
- identify the largest peaks and find the two spaced just right to be the 45 MHz upper and lower sideband
- calibrate the scan x axis in frequency, based on the 45 MHz sideband positions
- find the largest peaks in a small range around the nominal positions for carrier, 9 and 45 MHz sideband
- compute the power in each field by integrating the whole peak
The plotting is similar to the previous version: there is only one time race now, corresponding to the integrated power in each peak. The same is true for the data saved to file: I removed the fit peak values, since there is no more need for complicated fitting.
Also, the scan turns out to be slightly longer than one second, and out of sinc with the LIGO timing. So now the script uses two seconds of data to find the trigger and the peaks.
As before, the script is availbale in /opt/rtcds/userapps/release/isc/h1/scripts/osa.py
Sometimes the peak finding fails, especially if one of the sidebands falls close to the edge. I'm sure we'll soon find another failure mode...