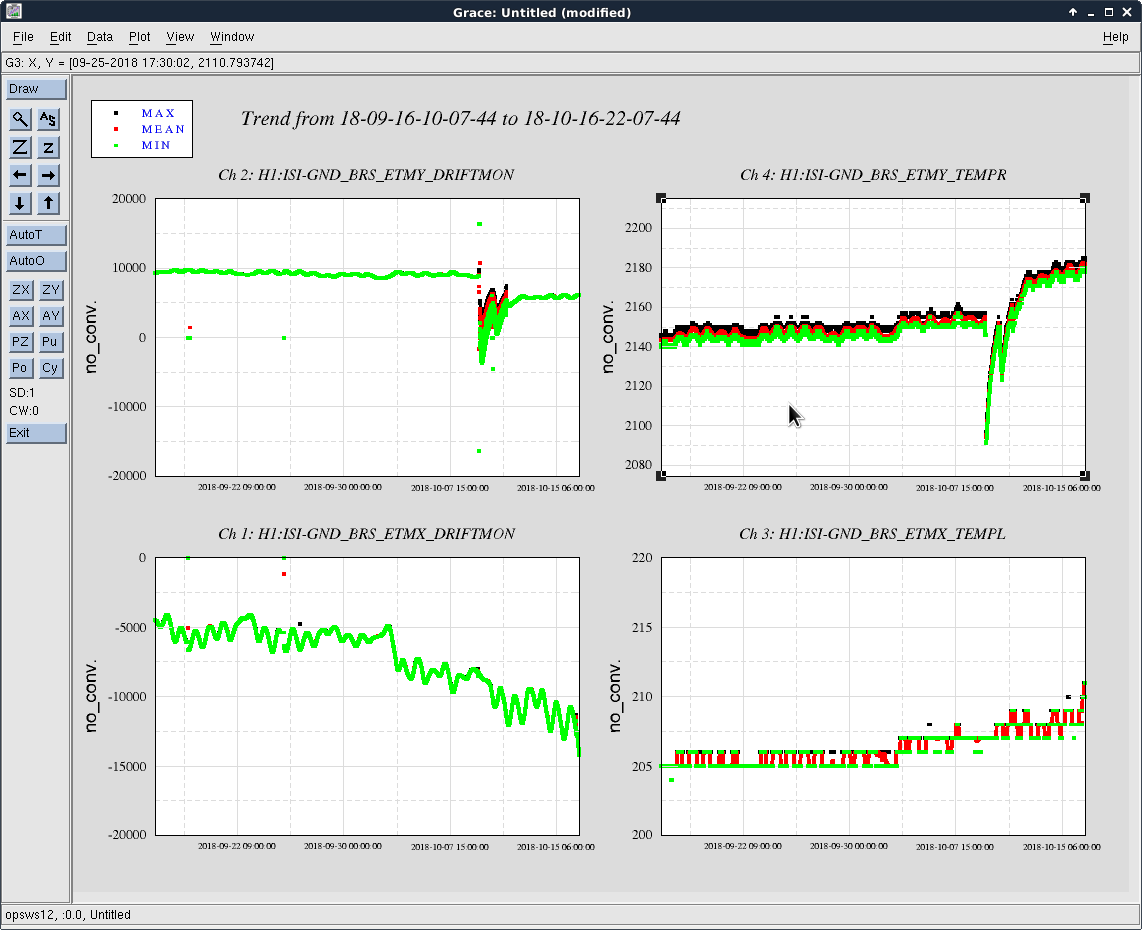
Attached plot shows 30 day trends of both BRSs DC positions and a temperature sensor in each box. Plots on the left are the DC position, plots on the right are the temps, EY is on top, EX is on bottom. It looks like both buildings have been heating up for a while, but BRSX is closer to it's limit and the temperature drift if pushing BRSX close to it's limits. The temperature in the box at EX is also about a half deg C higher than 30 days ago and that temperature is less stable now. This was going bad on it's own over the last two weeks, but the EX situation is made worse by my incursion today. I could re-balance if needed, but that's not a zero risk activity.
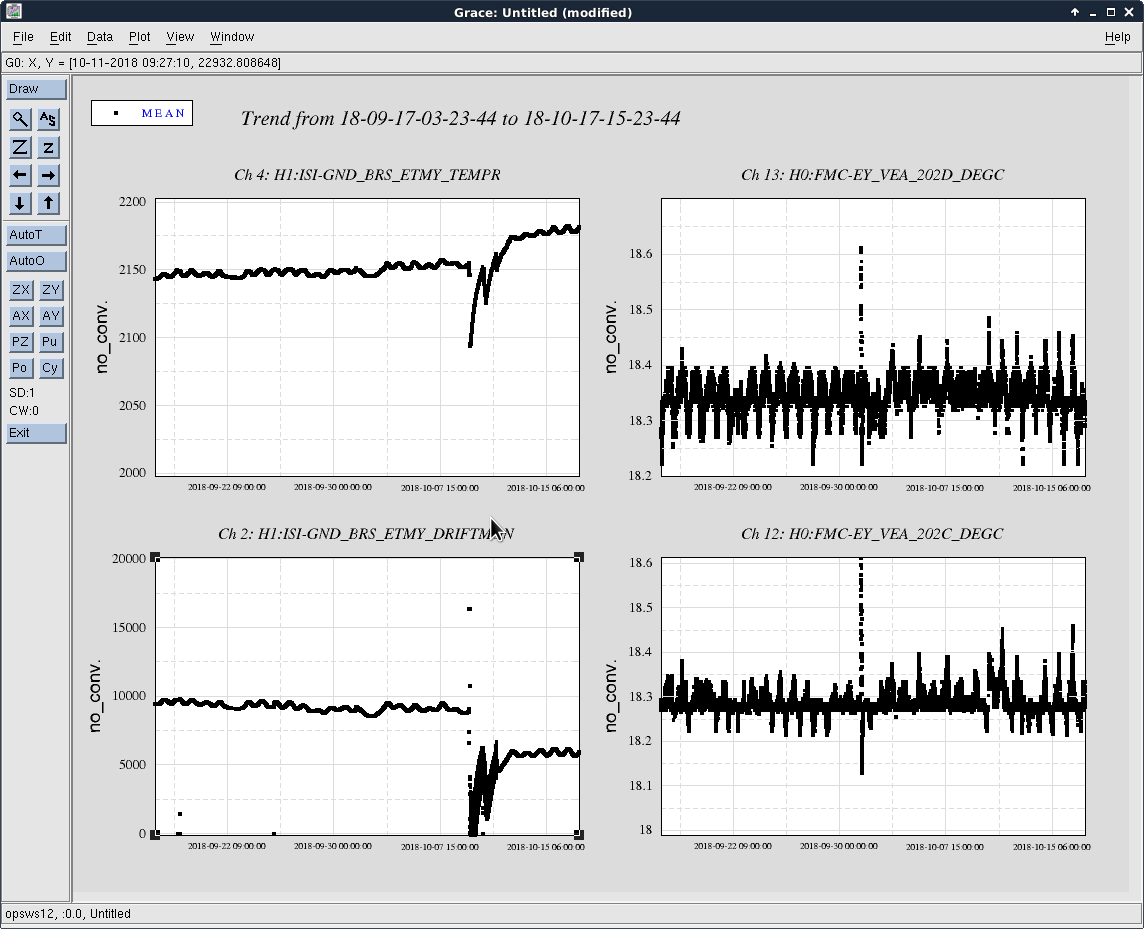
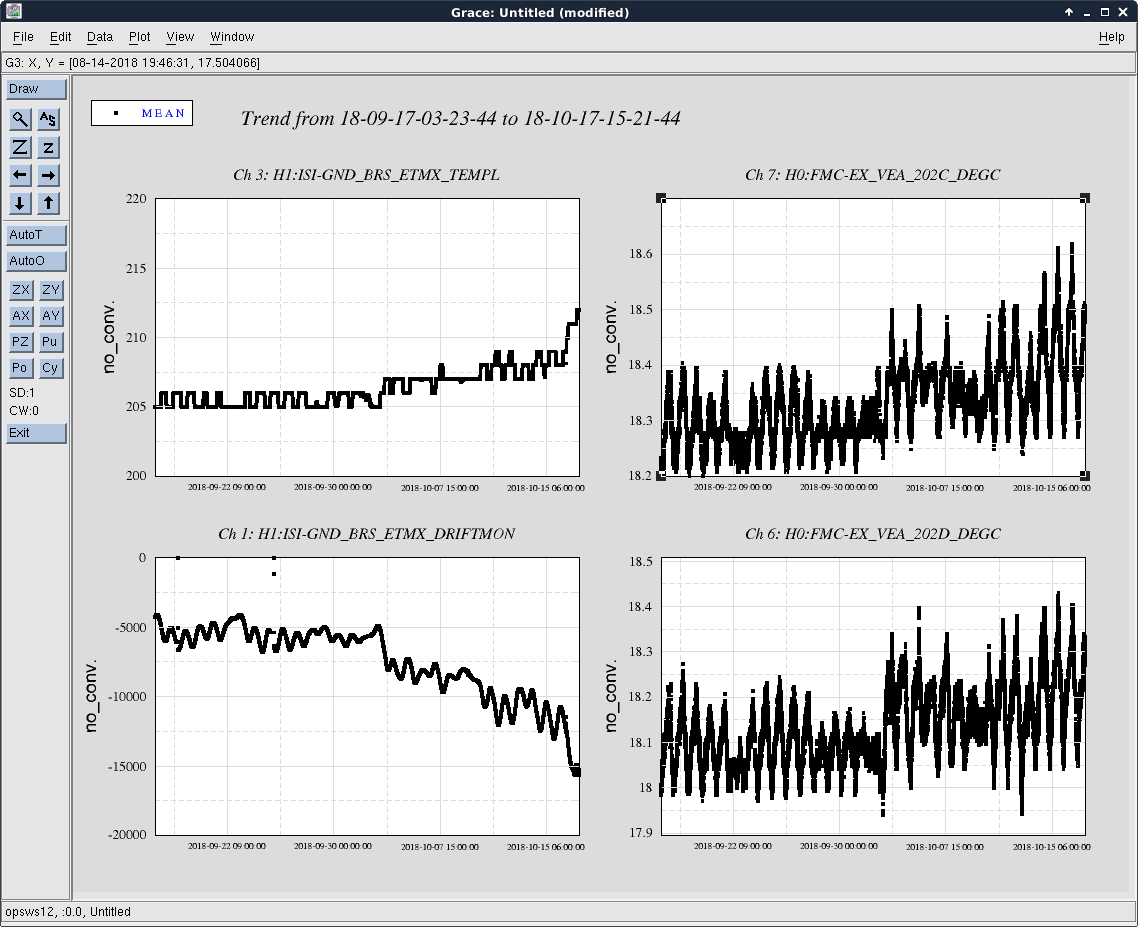
I'm attaching trends comparing both endstations for the last 30 days. For each plot, bottom left subplot is DC position of the BRS, top left is the temperature sensor in the box, and right side subplots are FMCS temperature sensors that seemed to have the strongest relationship to the BRS. First plot is EY, the upward tick in BRS temperature is me adding the thermos packs to the enclosure last week, this seems to have caused the equilibrium temp in the box to have moved up about .2 deg C, the building temps have been pretty stable over the whole period though. The second plot is the same for EX, with all the subplot ranges scaled to match the EY plot. Every sensor at EX sees about a factor of 2 greater peak to peak daily range than EY. Additionally, the EX temperatures see a couple of temperature bumps over the last two weeks and the day to day variation seems to have gotten worse over that same time period.
I probably still have to rebalance BRSX after the work yesterday, but this isn't something we want to be dealing with every month, and this could be increasing BRS noise at very low frequencies.
Filed FRS ticket 11660.