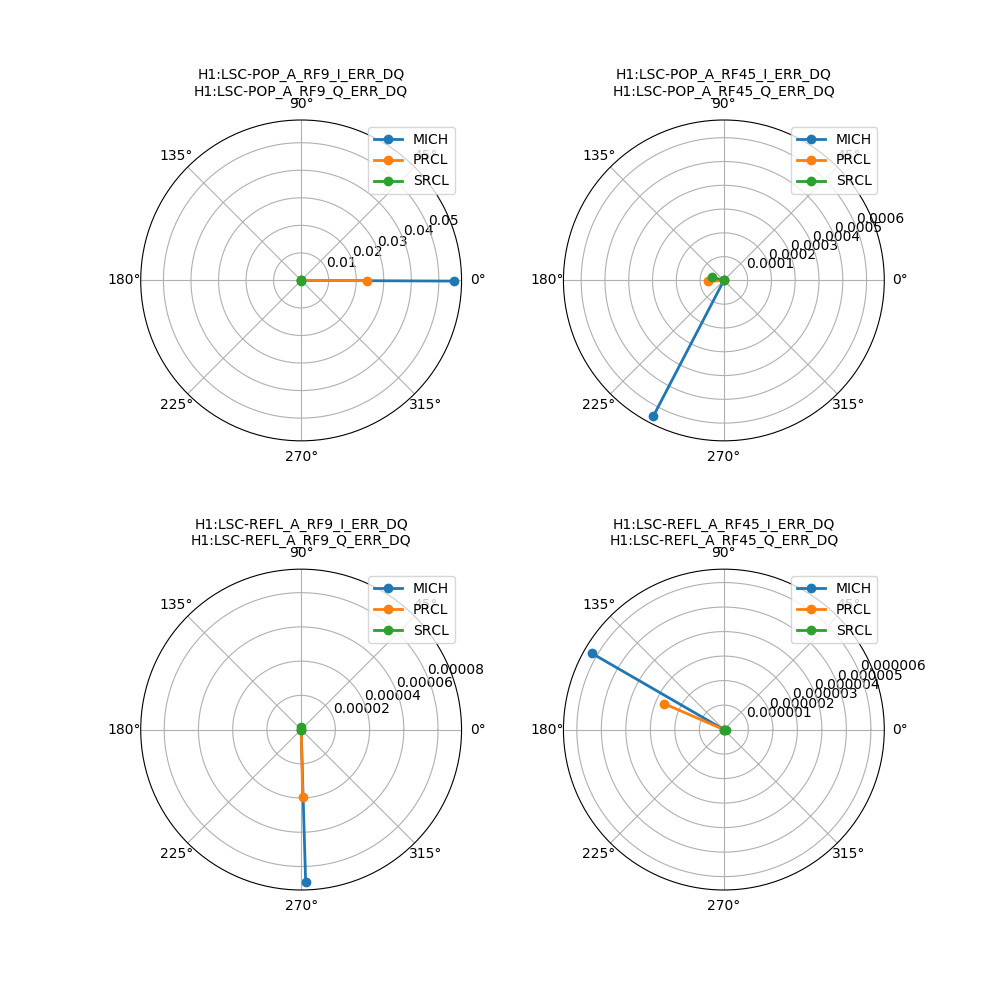
I wrote a script that automatically inject lines at 138 Hz in MICH, PRCL, SRCL, and measures the sensing matrix to POP and REFL RF signals.
The script is available in /opt/rtcds/userapps/release/isc/h1/scripts/lsc_sensing_matrix.py
Options are set at the beginning of the file. In particular excitations amplitudes and measurement time. The current excitations are tuned for full IFO in "high noise" state, i.e. before DC readout and before coil drivers to low noise.
The script outputs a matrix of the transfer functions from MICH2/PRCL2/SRCL2 _OUT to the POP_RF* and REFL_RF* signals. Also, it outputs a matrix of coherence of all signals with the excitation. The output is both in ASCII format and in HTML format, so that it can be easily copied and pasted into the logbook. The script saves the ASCII and HTML outputs to a file named lsc_sensing_DATE_TIME.txt and lsc_sensing_DATE_TIME.html.
A measurement performed at 2 W, before DC readout, it shown below:
| Trans.func. [sigs / LSC_*2_OUT] | MICH | PRCL | SRCL |
| H1:LSC-POP_A_RF9_I_ERR_DQ | 5.55e-02 + 1.56e-02j | 2.39e-02 + -1.04e-02j | 1.09e-04 + 1.43e-05j |
| H1:LSC-POP_A_RF9_Q_ERR_DQ | -2.50e-04 + 7.33e-05j | -7.90e-05 + 1.02e-04j | -4.50e-05 + -5.48e-06j |
| H1:LSC-POP_A_RF45_I_ERR_DQ | -2.96e-04 + -7.45e-05j | -6.55e-05 + 3.27e-05j | -5.03e-05 + -7.17e-06j |
| H1:LSC-POP_A_RF45_Q_ERR_DQ | -5.70e-04 + -1.71e-04j | -4.10e-06 + -1.23e-06j | 1.45e-05 + 2.01e-06j |
| H1:LSC-REFL_A_RF9_I_ERR_DQ | 2.64e-06 + 4.66e-07j | 9.27e-07 + -3.27e-07j | -3.65e-09 + -5.16e-10j |
| H1:LSC-REFL_A_RF9_Q_ERR_DQ | -8.92e-05 + -2.82e-05j | -3.92e-05 + 1.54e-05j | 1.75e-06 + 2.33e-07j |
| H1:LSC-REFL_A_RF45_I_ERR_DQ | -5.40e-06 + -1.54e-06j | -2.42e-06 + 1.04e-06j | 6.85e-08 + 9.86e-09j |
| H1:LSC-REFL_A_RF45_Q_ERR_DQ | 3.12e-06 + 8.99e-07j | 1.05e-06 + -4.48e-07j | -2.66e-08 + -3.79e-09j |
| Trans.func. [sigs / LSC_*2_OUT] | MICH | PRCL | SRCL |
| H1:LSC-POP_A_RF9_I_ERR_DQ | 5.76e-02 / 16 deg | 2.61e-02 / -24 deg | 1.10e-04 / 7 deg |
| H1:LSC-POP_A_RF9_Q_ERR_DQ | 2.61e-04 / 164 deg | 1.29e-04 / 128 deg | 4.54e-05 / -173 deg |
| H1:LSC-POP_A_RF45_I_ERR_DQ | 3.05e-04 / -166 deg | 7.32e-05 / 153 deg | 5.08e-05 / -172 deg |
| H1:LSC-POP_A_RF45_Q_ERR_DQ | 5.95e-04 / -163 deg | 4.29e-06 / -163 deg | 1.47e-05 / 8 deg |
| H1:LSC-REFL_A_RF9_I_ERR_DQ | 2.68e-06 / 10 deg | 9.83e-07 / -19 deg | 3.69e-09 / -172 deg |
| H1:LSC-REFL_A_RF9_Q_ERR_DQ | 9.36e-05 / -162 deg | 4.21e-05 / 159 deg | 1.76e-06 / 8 deg |
| H1:LSC-REFL_A_RF45_I_ERR_DQ | 5.61e-06 / -164 deg | 2.64e-06 / 157 deg | 6.92e-08 / 8 deg |
| H1:LSC-REFL_A_RF45_Q_ERR_DQ | 3.25e-06 / 16 deg | 1.14e-06 / -23 deg | 2.69e-08 / -172 deg |
| Coherence [sigs / LSC_*2_EXC] | MICH | PRCL | SRCL |
| H1:LSC-POP_A_RF9_I_ERR_DQ | 1.000 | 1.000 | 1.000 |
| H1:LSC-POP_A_RF9_Q_ERR_DQ | 0.924 | 0.984 | 0.999 |
| H1:LSC-POP_A_RF45_I_ERR_DQ | 1.000 | 1.000 | 1.000 |
| H1:LSC-POP_A_RF45_Q_ERR_DQ | 1.000 | 0.990 | 1.000 |
| H1:LSC-REFL_A_RF9_I_ERR_DQ | 0.542 | 0.956 | 0.722 |
| H1:LSC-REFL_A_RF9_Q_ERR_DQ | 1.000 | 1.000 | 1.000 |
| H1:LSC-REFL_A_RF45_I_ERR_DQ | 1.000 | 1.000 | 1.000 |
| H1:LSC-REFL_A_RF45_Q_ERR_DQ | 1.000 | 1.000 | 1.000 |
The script also produces a I/Q radar plot, which is saved in lsc_sensing_DATE_TIME.png. However, I have not (yet) calibrated the LSC_*2_OUT signals in meters. Since those signals are going directly to BS, PRM and SRM suspensions, the numbers that Craig posted should be fine.