Rana, Hang
We retook the nonlinear SRCL noise coupling measurement. In our previous study without SRCLFF (LHO:44770), the linear component was too high to expose the nonlinear part. This time we inject SRCL noise with both the MICH and SRCL FF on to reduce the linear component (thanks Sheila et al. for performing the injection; LHO:44772) and, as a result, now we are able to expose the NL couplings.
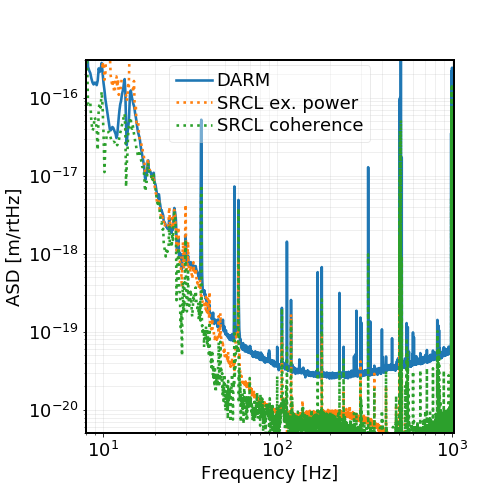
Please see the first attached plot for the SRCL noise projection. The blue trace is the DARM ASD, the orange is the projection of SRCL based on excess power (which captures both the linear and NL coupling), and the green one is the SRCL projection based on pure linear coherence (i.e., the residual linear coupling after the online FF).
It seems that the SRCL noise is the dominant noise source in the 20-40 Hz band, and is significant all the way up to ~ 300 Hz. Below 30 Hz, the SRCL coupling is still mostly linear from the FF residual, whereas in the 30-80 Hz band the nonlinear coupling dominates.
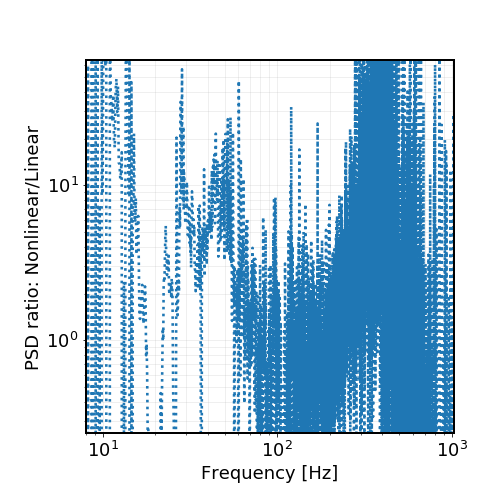
The ratio between the NL/L PSDs projected onto DARM is shown in the second plot. In the 30-80 Hz band, the NL coupling is typically a few to 10 times higher than the residual linear component in power.
===================================================================================
The data we used for generating the plots started from gps 1224400998 for 1024 sec. The excess power projection also used data from gps 1224399618 for 1024 sec with active SRCL noise injection (both MICH and SRCL FF on).