[Craig Hang TVo Rana Danny Keita Georgia]
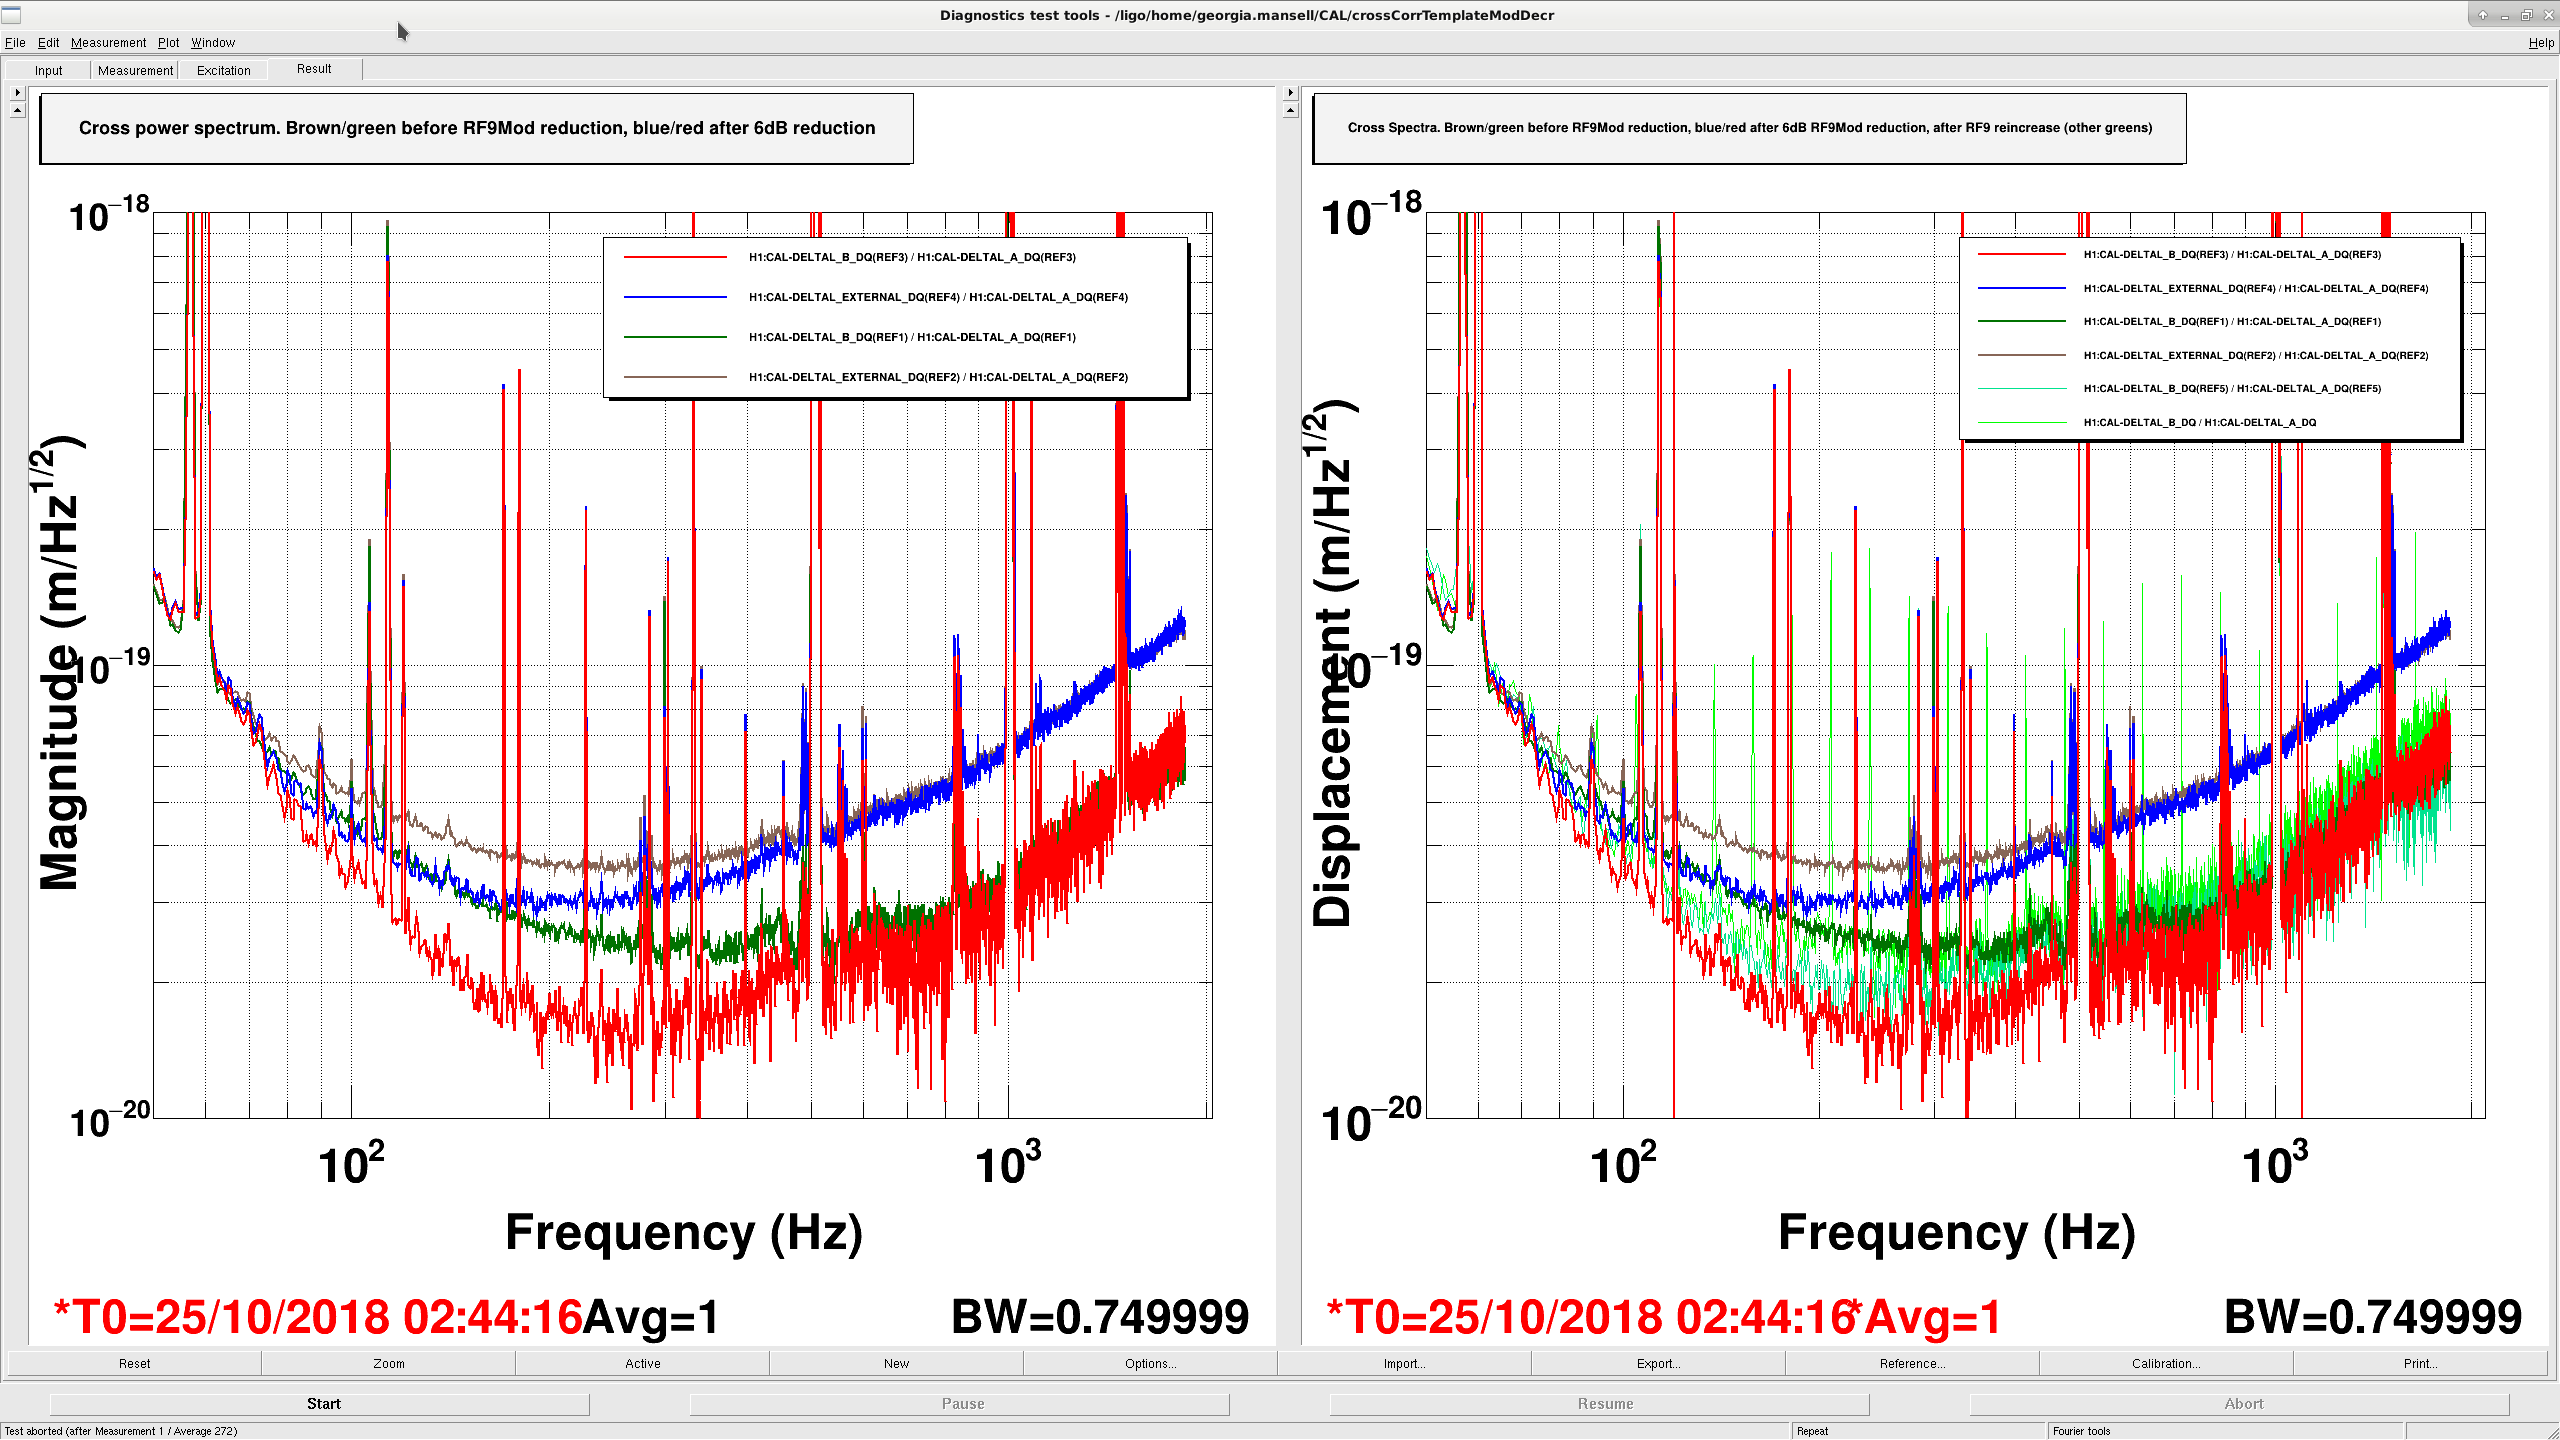
Following up on alog 44781, we had a look at the OMC DCPD cross-correlation as a function of RF9 modulation depth, using Kiwamu’s handy DCPD cross correlation infrastructure and DTT template (35156, T1700131). The cross-correlation allows us to look below the sensing noise of the OMC DCPDs and the photon shot noise.
In the first attachment, the brown and dark green traces show the DARM and cross-correlated spectra before the RF9 modulation depth decrease. Above 100 Hz the cross-correlated noise is below the DARM noise, indicating that we are limited by uncorrelated noise, eg photon shot noise, at these frequencies.
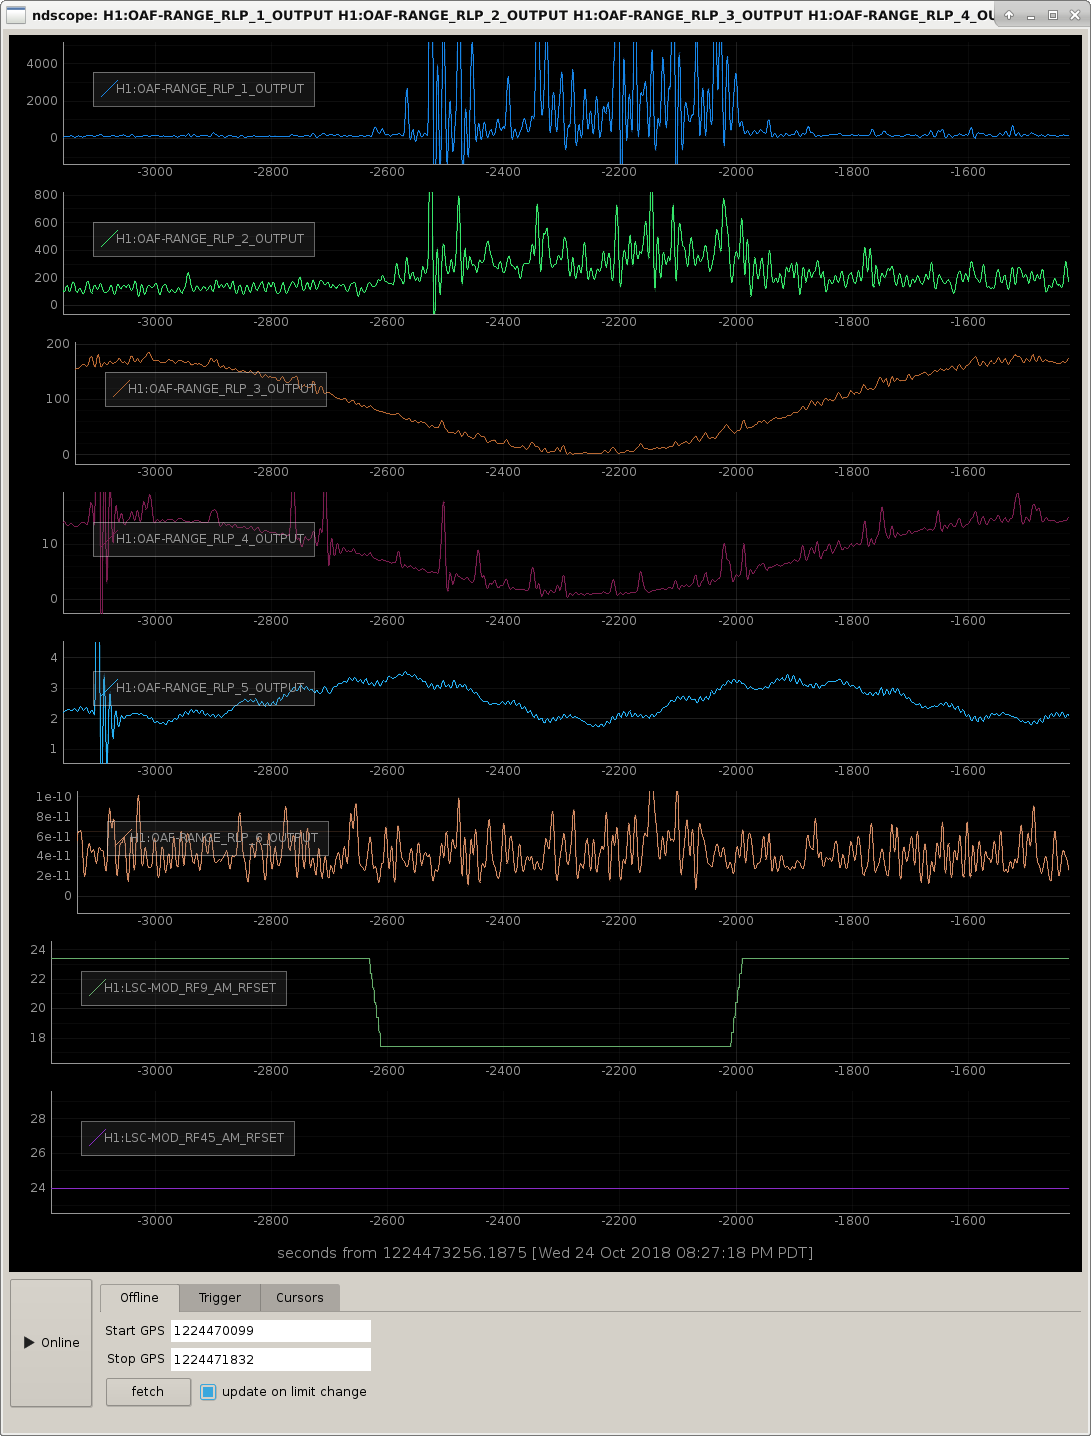
We used a Craig modification on Jenne’s script to turn the RF9 modulation depth down by 6dB for 10 minutes. Surprisingly, it looked like we had a significant reduction of noise in the bucket, from ~100 to 500 Hz in both the DARM and cross-correlated spectra, shown in blue and red, with no significant change to the noise above 500Hz. However when we brought the modulation depth back up the noise seemed to remain closer to the before-modulation-depth reduction level.
In the next lock stretch it seemed like the noise in the bucket crept back up to the original level. The two pale green traces in the right plot are cross correlation spectra from different times in the next lock where the RF modulation was not changed (03:47UTC and 04:30UTC). Similar behaviour was seen in the DARM spectrum, omitted from the plot for clarity. The second attachment shows the DARM BLRMS while we changed the RF9 modulation depth, this also has the timestamps for this test.
Before generating these cross-correlated spectra I updated normalisation and inverse sensing filters in the H1:CAL-CS_DARM_ERR_NULL filters to match the H1:CAL-CS_DARM_ERR. That is, I copied the O3_D2N and O3gain filter banks to the NULL channel. I have not updated the DTT frequency domain calibration (a transfer function in the templates calibration), and am still using the calibration from 2017.
Other locking notes:
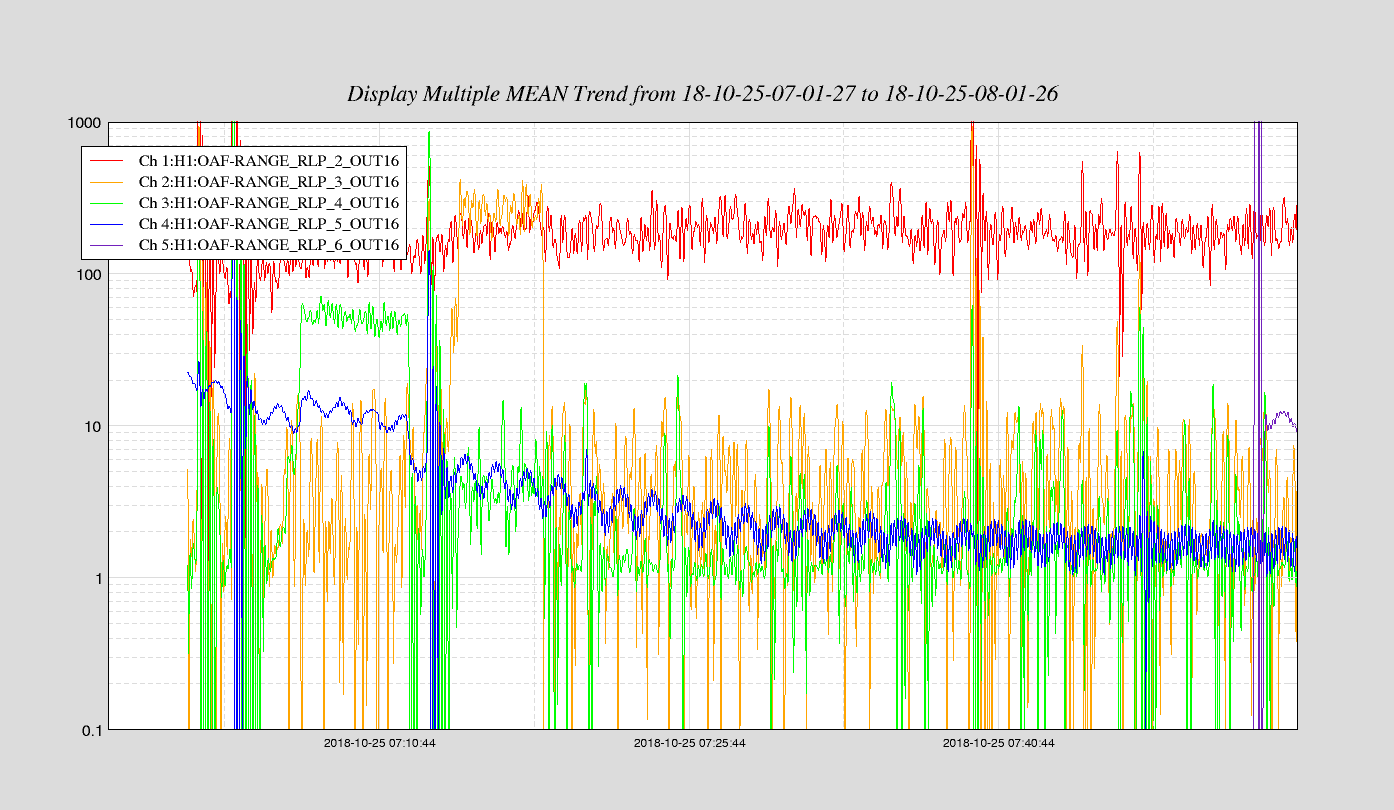
DARM BLRMS - Added 57 Hz and 114 Hz notches to the relevant DARM BLRMS filters (found in sitemap>LSC>OAF Calib>OAF BLRMS>RBP1-5) to get rid of the peak which we identified as the ITM HWSs. These notches removed the ~30 minutes period sinusoid seen in the BLRMS 3 and 4, and its harmonic in BLRMS5.
Glitches - After Hang implemented his DHARD PIT mircoseismic filter (44801) the regular glitches we were seeing in DARM are less frequent and less severe, compare locks before and after 1224468886.
in the above entry, ITM is a typo, it should be ETM Hartmann.
After putting in the notches for the heartmann noise, we were able to plot the BLRMS of DARM using the OAF-CAL LSC BLRMS (attached).
The frequency bands are 20-30 Hz, 38-60 Hz, 60-100 Hz, 100-450 Hz, and 450-950 Hz. The color coding follows the rainbow: red is the lowest frequency and purple the highest.
Since Georgia added the notches, we no longer see the 25 minute period that was characteristic of the TCS/Harmann noise, but rather the underlying breathing of the noise. Most troubling is the Orange (38-60 Hz) band. This one and the green one show all the breathing that is in our mystery noise band.
I think it would be illuminating if someone could find correlations with the orange and green bands and some other channels; it may shed light on what is causing the coupling. Note that since this is a RMS, one should find a correlation between the absolute value of (whatever) and these BLRMS channels.
I'm also attaching a plot showing DRMI error signals and coherence with DARM. The PRC signal is ~50x larger in the 20-30 Hz band than it used to be in O1. This also shows up in MICH/SRC and so there's a large coherence with DARM. I wish we had a noise budget for PRC/MICH/SRC, not just DARM.
I tried to run 'cdsutils audio' from the command line to listen to some band limited darm (to see if it sounds like rubbing or scattering) but the 'pygst' and 'gnuradio' modules are not available from this terminal. It would be useful to have that functionality added if possible.

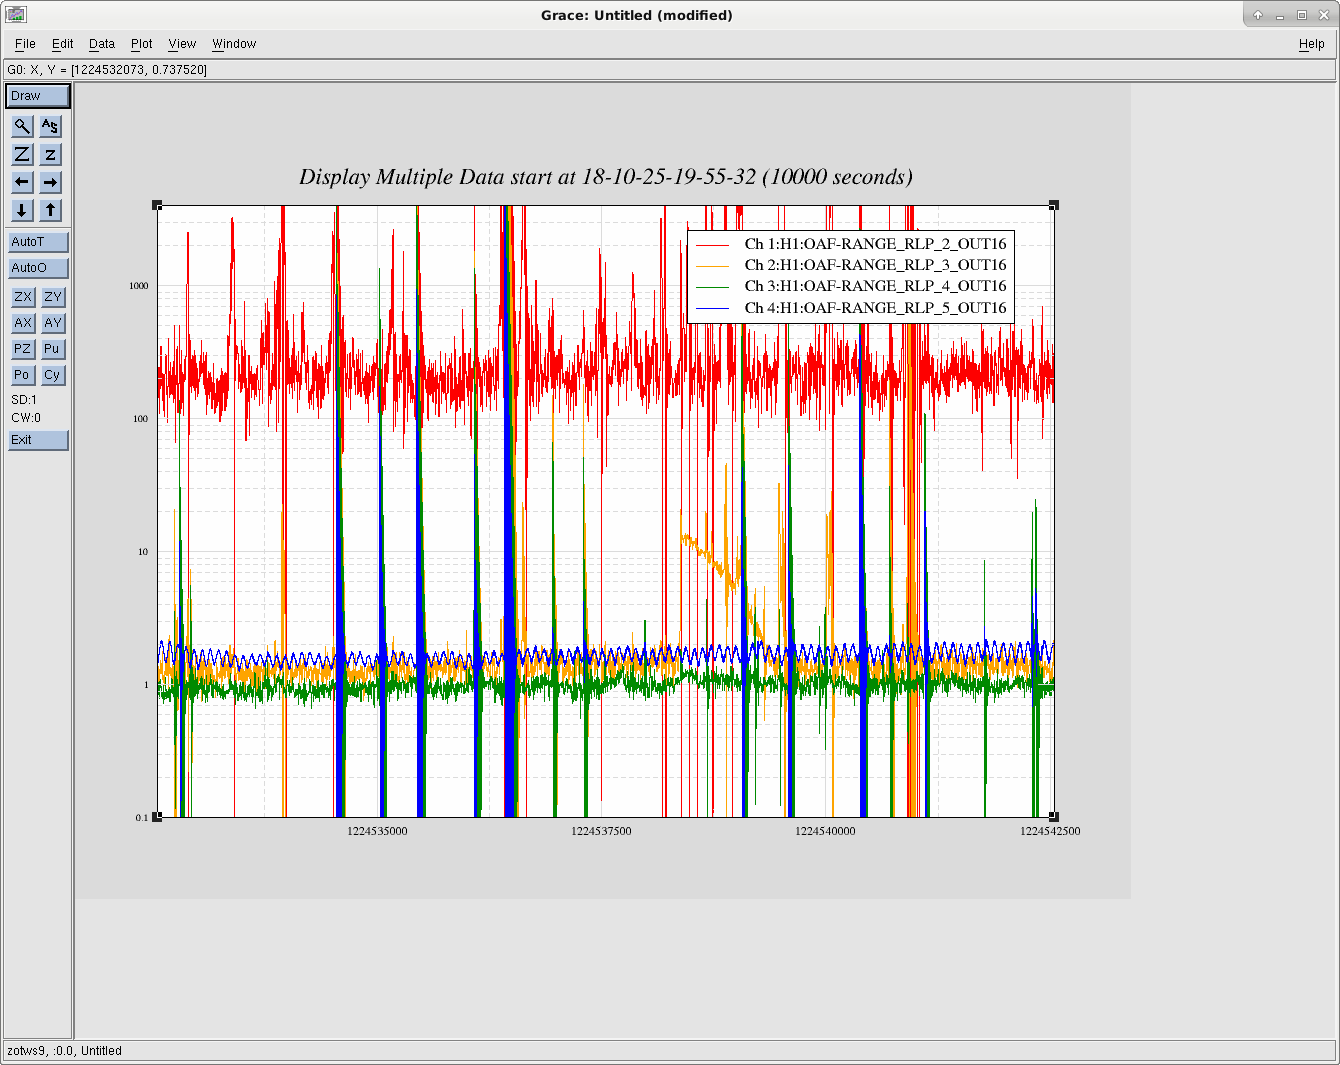
I had a look at the DARM BLRMS during this morning's long lock, it looks like the noise in the 38-100 Hz band is much quieter, see attached plot showing 10000 seconds of data. The extra noise in RLP3 band at 1224538440 is an injection (I think).
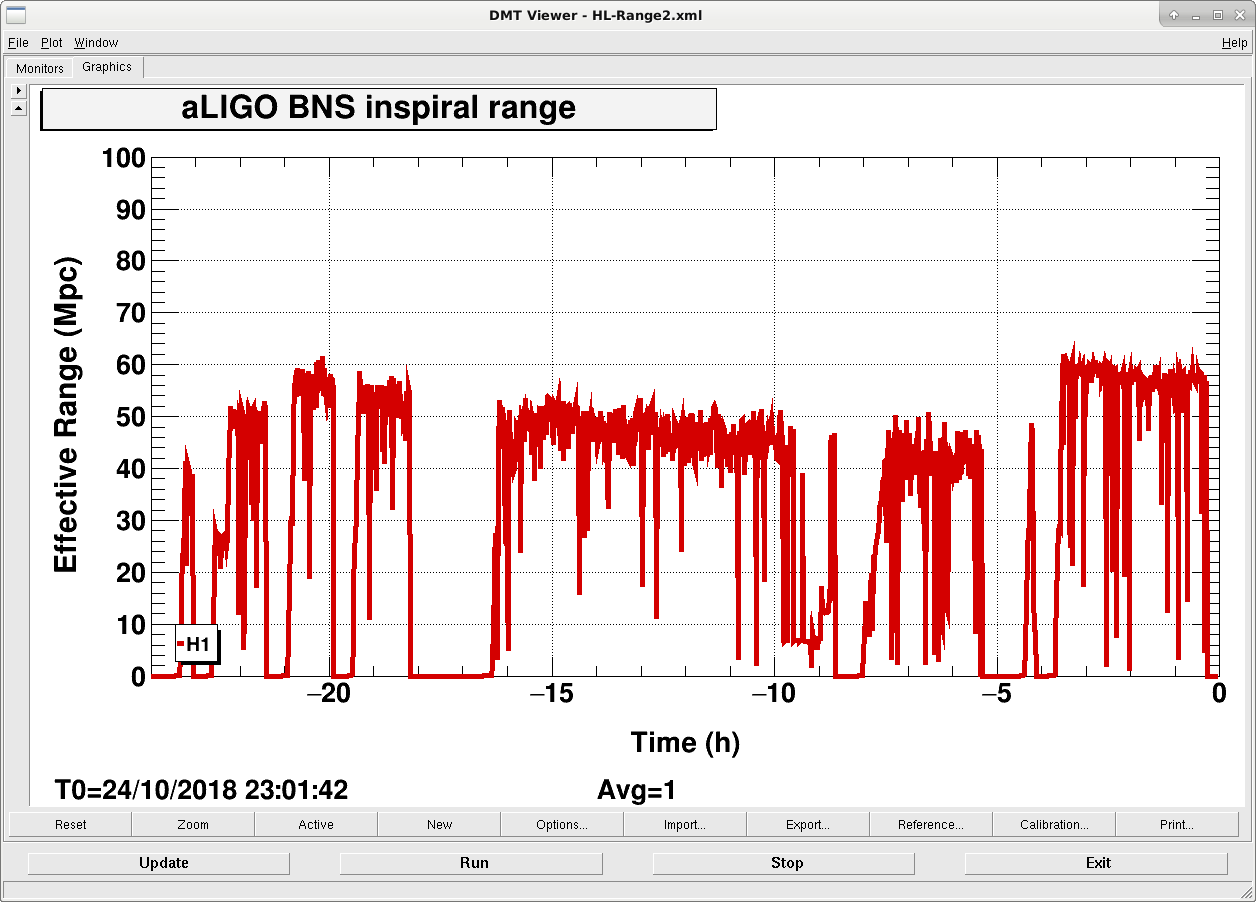
Two differences between last night and this morning is the initial alignment has been redone, and the BNS range which decreases over the duration of a lock. Second attachment shows H1 BNS range. The BLRMS plot from last night was taken at T-16, the BLRMS plot from this morning starts around T-4.
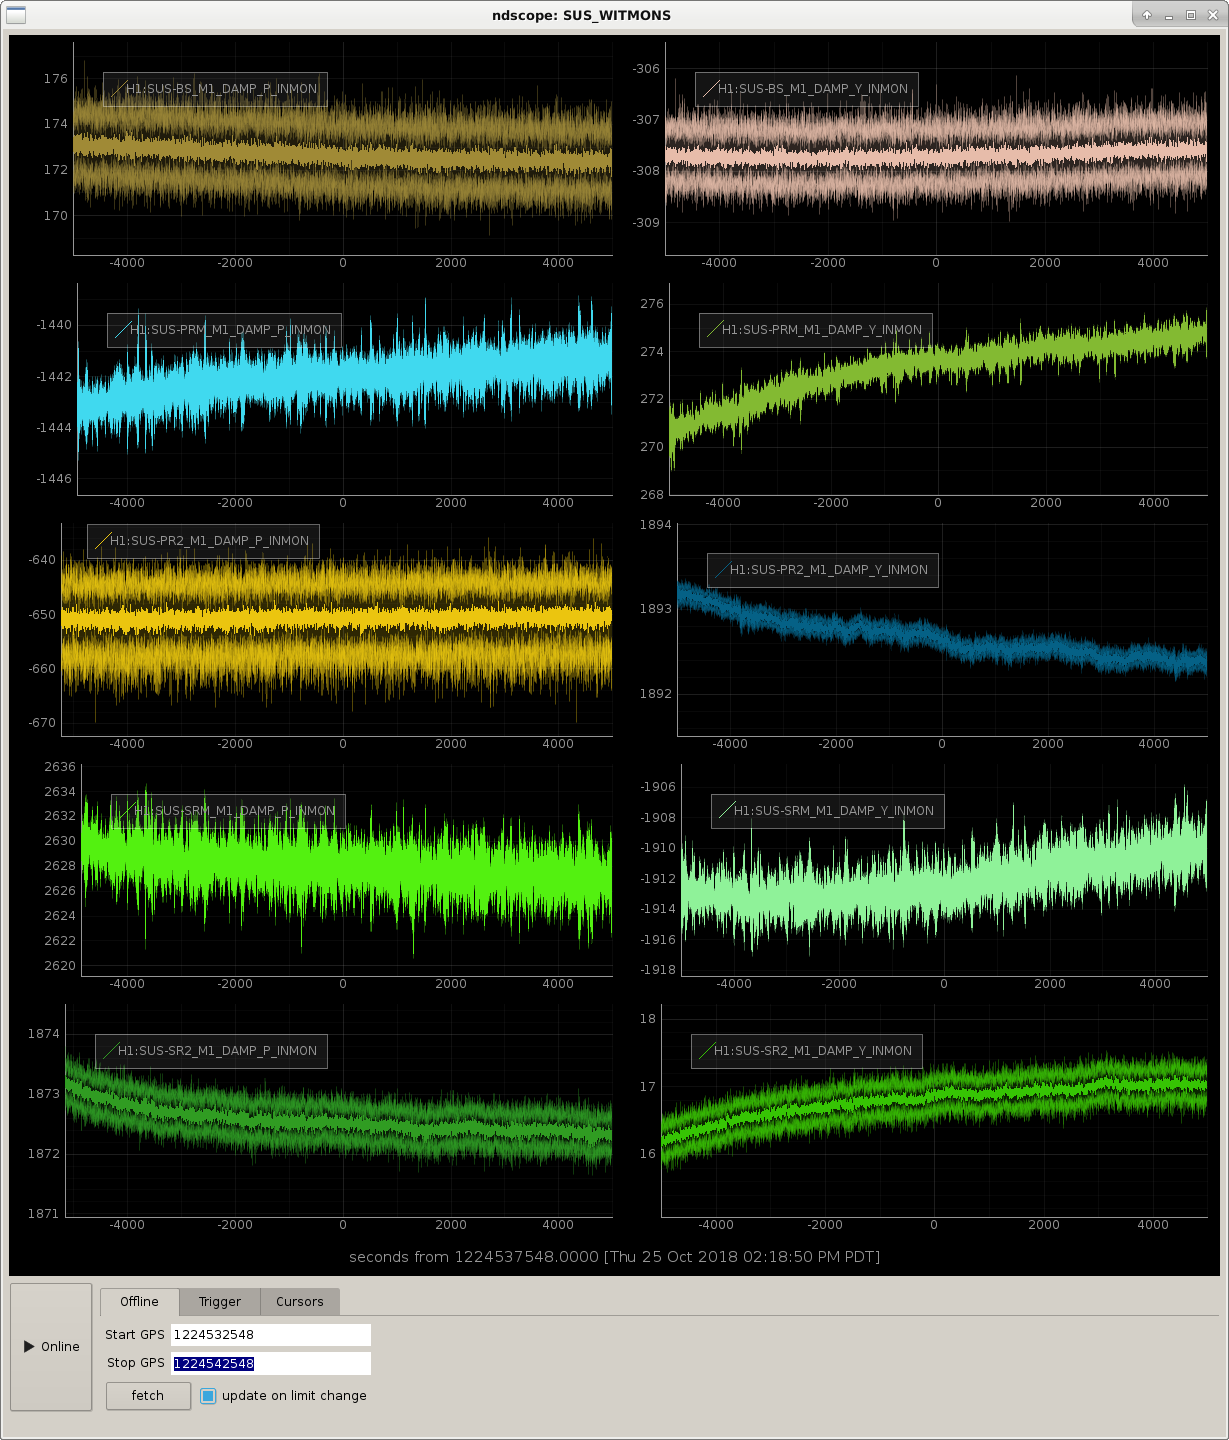
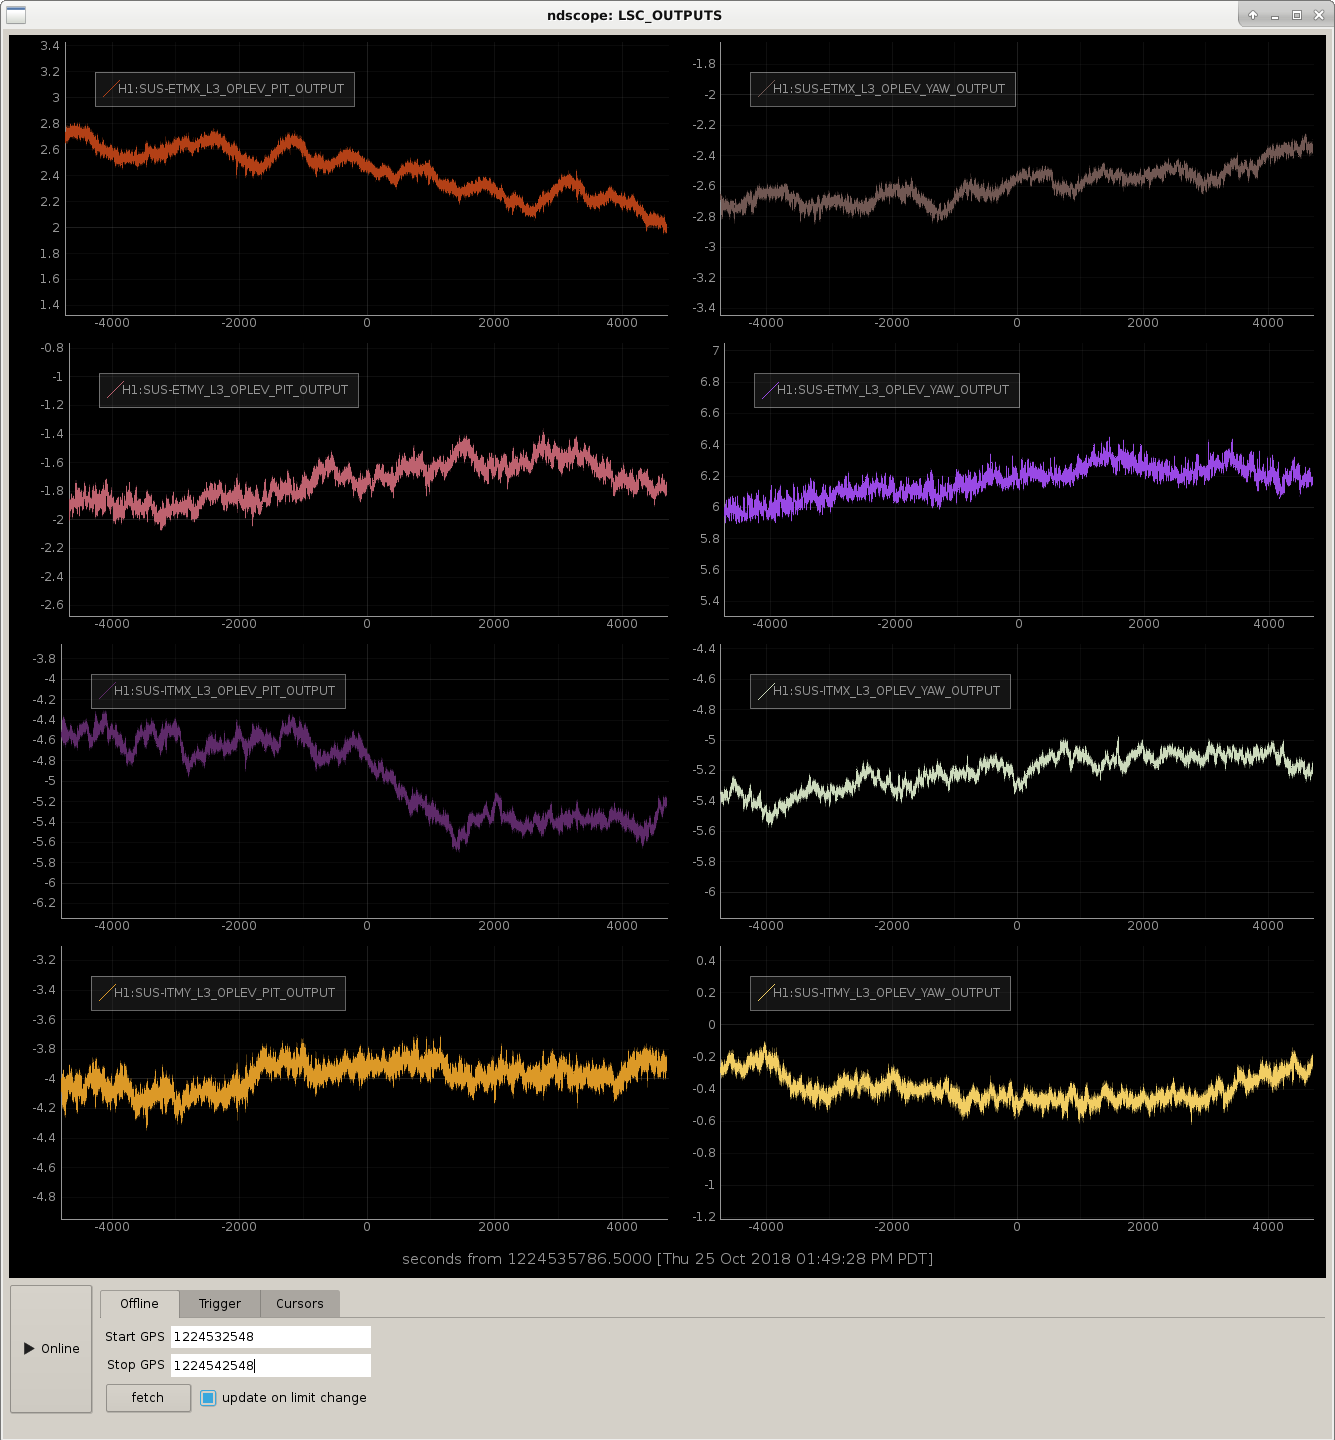
Out of interest I also looked at the suspension witness monitors (3rd attachment) and test mass op levs (4th attachment) over the duration of this morning's the lock. In these plots pitch is on the left and yaw is on the right. PR2 PIT stands out as being extra noisy, and SRM and PRM drift the furtherest over the duration of the lock.