Hang, TVo
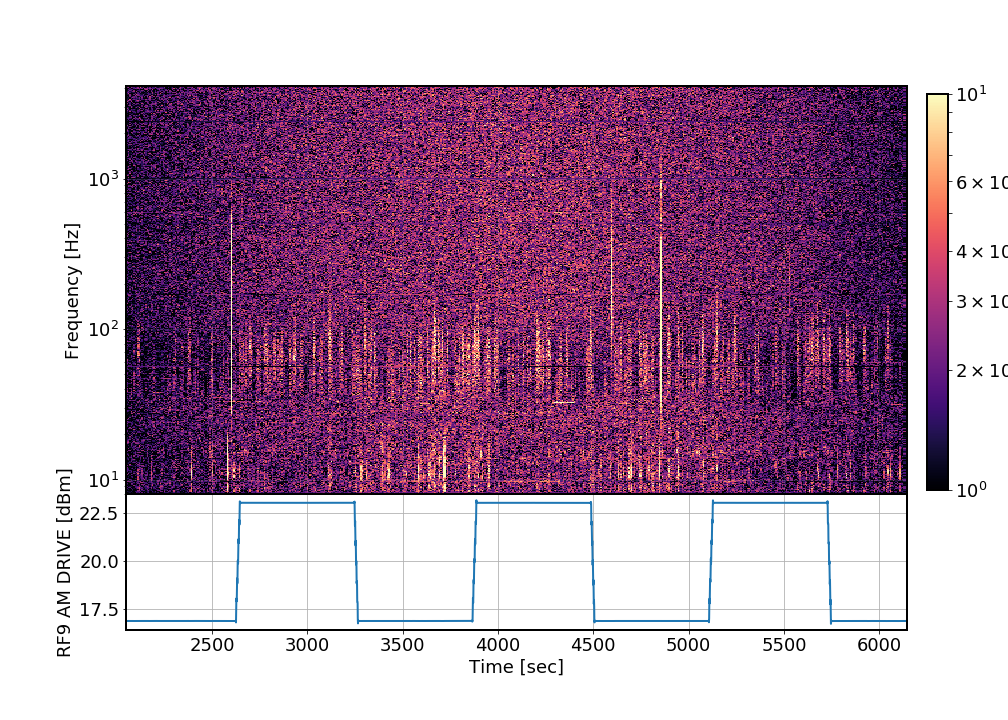
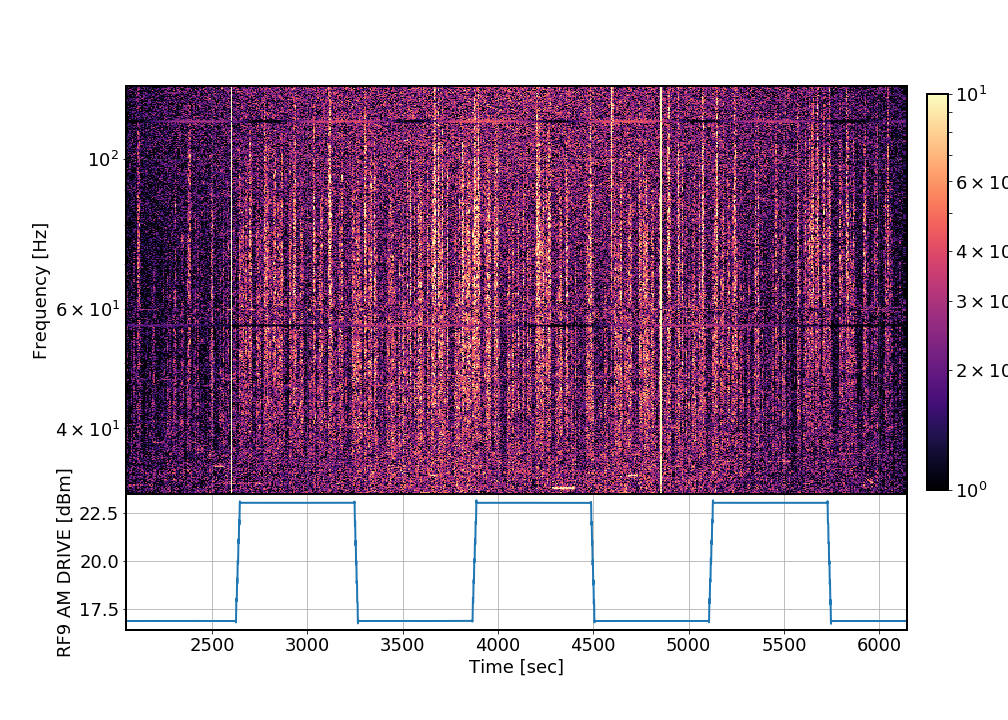
Hang had most of the tools written up to run the spectrograms using jupyter notebook so i helped tune the notch filtering to get the normalized spectrogram of CAL-DELTAL_EXTERNAL_DQ
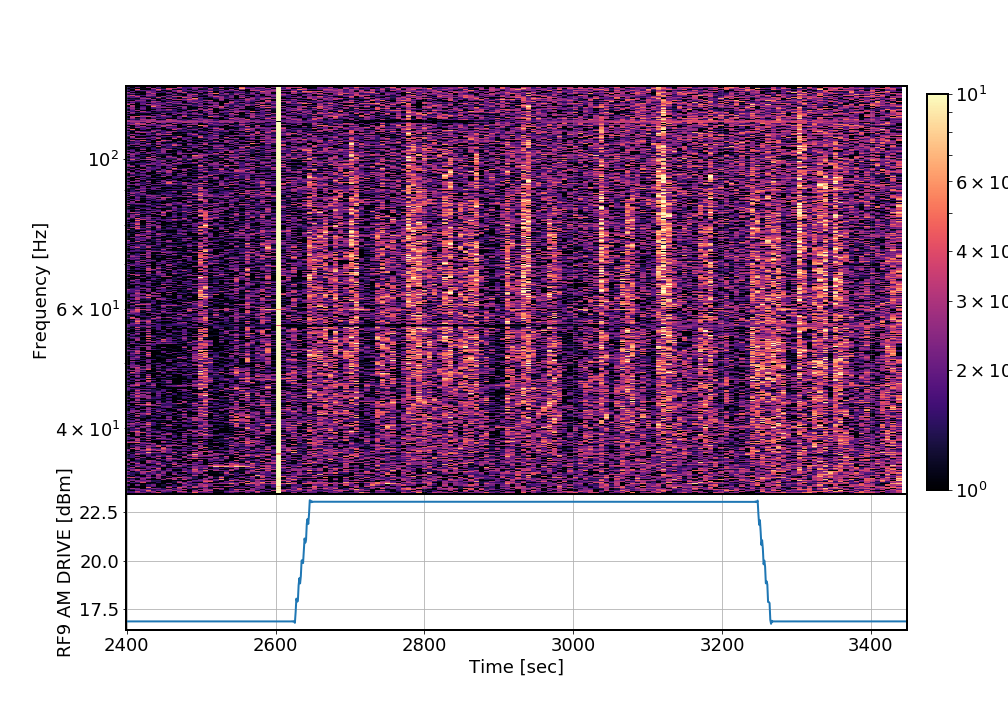
The first plot shows broadband DARM, and the second plot shows a zoomed in version from 30 to 200 Hz. By eye, there's not an obvious correlation between the amplitude square wave of DB9 modulation depth to DARM, except there's some extra noise at the 57-58 Hz region which might come from the Hartmann sensor sync frequency. The third plot shows a zoomed-in time version during one of the glitchy times, there's an obvious broadband spike but there is also a long lasting one at the 57-58 Hz that lasts for a few minutes.
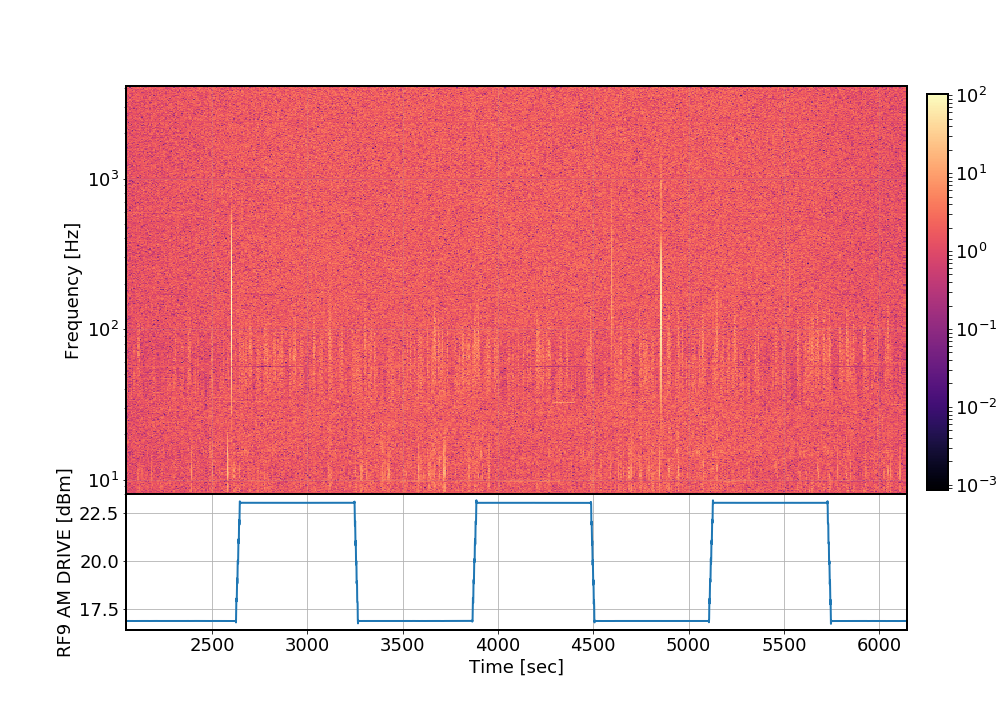
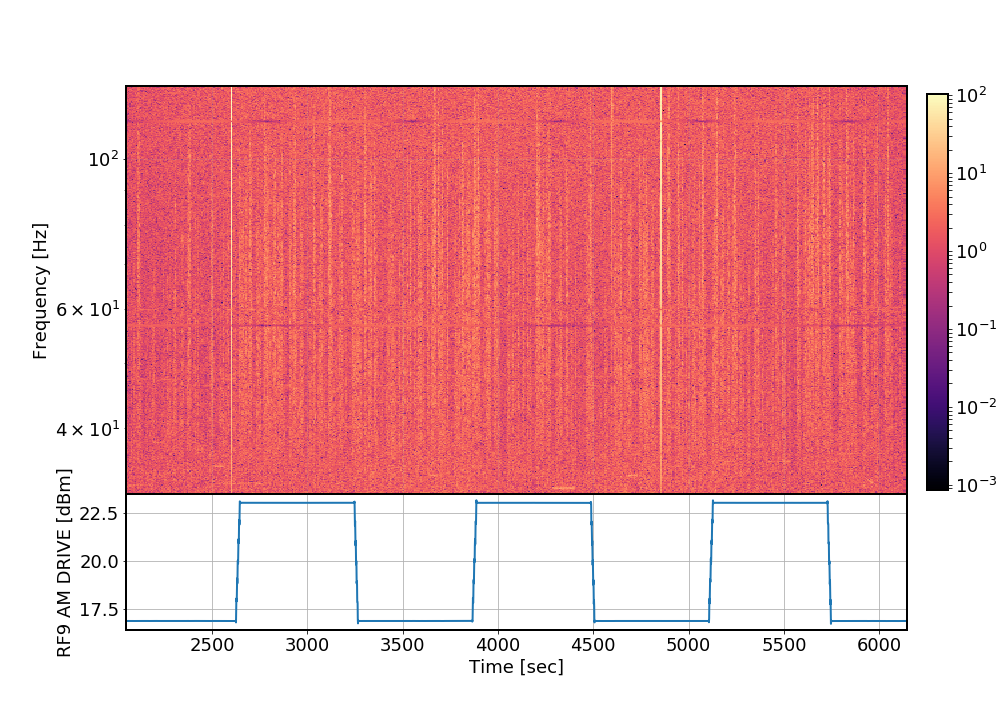
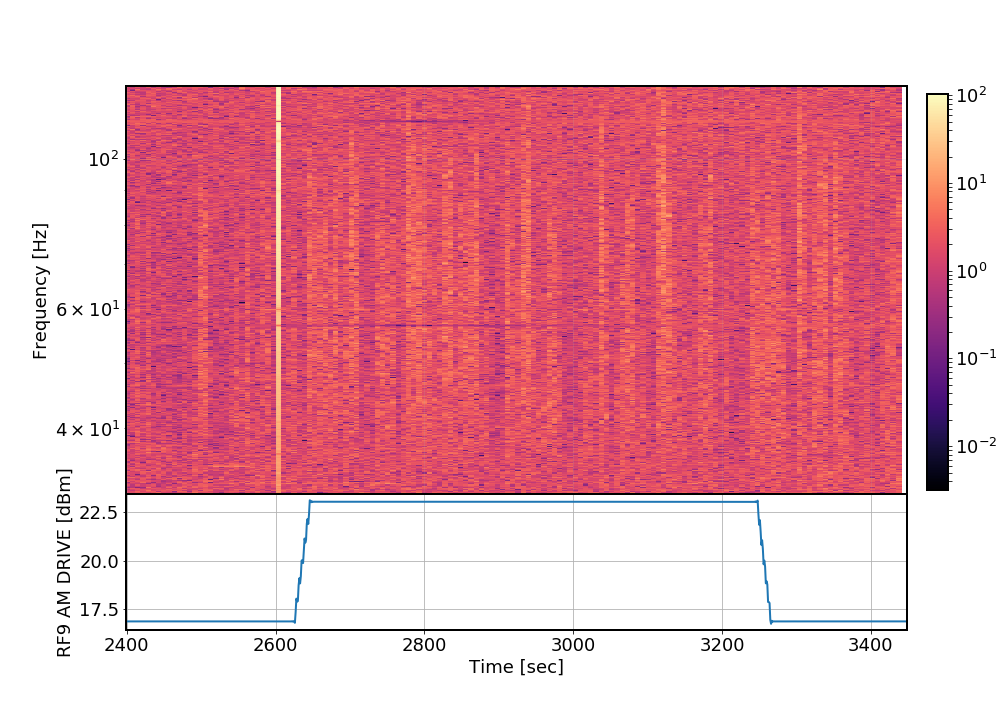
Rana suggested that the color bar previously was hiding some artifacts that are more apparent with better plotting, attached are the same graphs but making the colors in a tighter window.