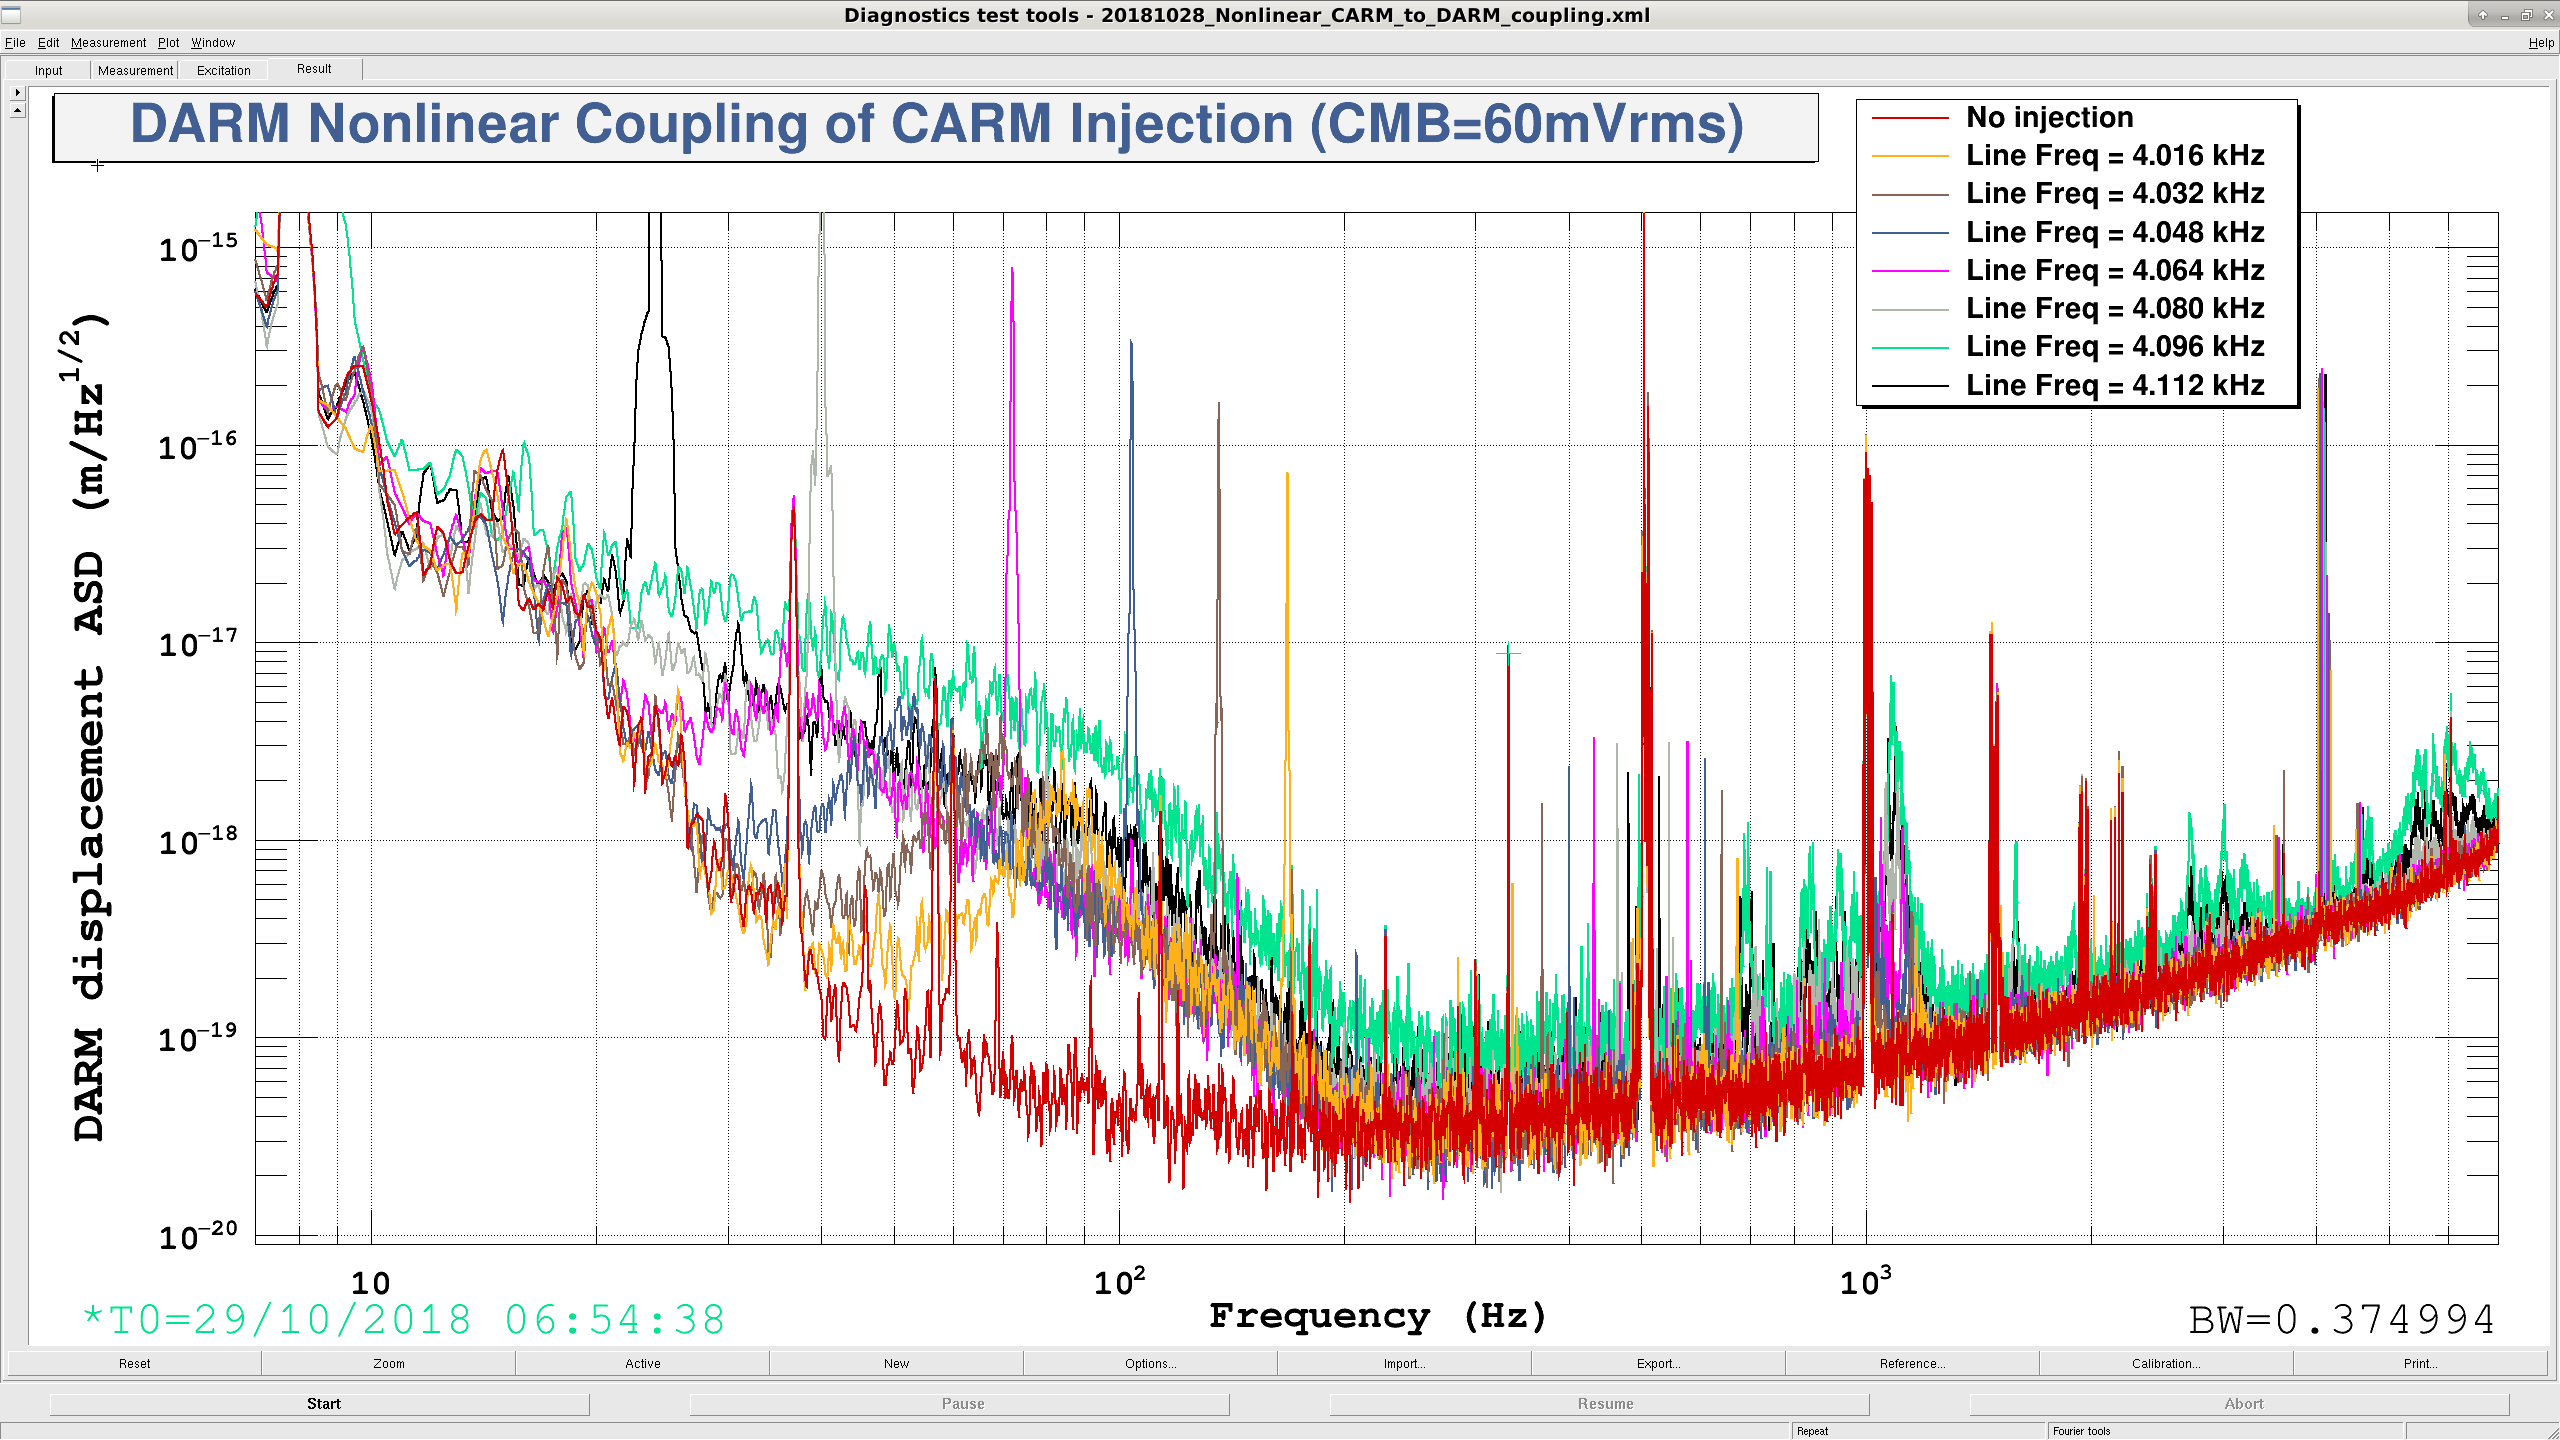
Today I found that excess noise in CARM around 4.096 kHz (actually 4.100 kHz) is downconverted to DC noise in DARM. While taking CARM OLG measurements, I've noticed that we always see a jump in the DARM noise at low frequency. I always assumed it was a glitch having to do with turning on/off the SR785 excitation, today I decided to track it down. Turns out it's not the on/off switch, it was when the swept sine passed through a specific frequency band. I took a bunch of swept sines from 100kHz to 90 kHz, etc... until I got to 10 kHz to 1 kHz, where I saw the DARM noise jump again. I went out to the floor and injected a line into the Common Mode Board at 1 mVrms while moving the frequency from 10 kHz down to 1 kHz. I noticed nothing on this first pass. So I input 60 mVrms and went back in frequency and found the jump when I got to 4.016 kHz. It was a stationary, broadband hump in DARM at around 80 Hz. I moved the sine wave frequency slowly, getting spectra at every jump of 16 Hz. The DARM hump moved down in frequency until I reached 4.096 kHz, when it started moving up again. (Pic 1). The coupling became much stronger when the line was directly on 4.096 kHz. I could control the coupling amplitude by increasing the sine wave amplitude (Pic 2). As I moved down in frequency, I could also see a strong reflection of the line at|Inj Freq - 4.096 kHz| + 8 Hz(so if my line was at 4.112 kHz, which is 16 Hz away from 4.096 kHz, I'd see a line 24 Hz). The PCAL line is on at 8 Hz, so I thought I was probably seeing it again in reflection. Turns out that's not the case, see Pic 3 where I turned off the PCAL line with the line freq at 4.112 kHz 4.096 kHz is 2^12, so this has to be an ADC electronics issue. There seems to be a corner at around 100 Hz, which could be consistent with some whitening filter corner. I looked at the CARM spectrum at the same time as I increased the sine wave amplitude, there was no change (Pic 2), so this is probably a DARM loop issue. DTT template was too huge for upload, it exists at/ligo/home/craig.cahillane/Git/IFO/FrequencyNoise/20181028_Nonlinear_CARM_to_DARM_coupling.xml------------------------------------------------------------------------------------------------------------------------------------------------------------------ Something wasn't hanging together with these reflections, so I injected the line at a few different frequencies and recorded the difference with 4.096 kHz and the reflection peak frequency:Inj Freq [kHz] Diff with 4.096 kHz [Hz] Refl Peak Freq [Hz] ------------------------------------------------------------------ 4.064 32 72 4.080 16 40 4.112 -16 24 4.128 -32 56These results are more consistent with a frequency reflection about exactly 4.100 kHz. (???) Maybe not a digital electronics issue.... ------------------------------------------------------------------------------------------------------------------------------------------------------------------ I tried driving DARM1_EXC at 1e-6 excitation at 4.112 kHz but lost lock. There was no noticeable change in the DARM spectrum when driving at low amplitudes. Gonna be really hard to drive DARM at this frequency, should probably get an hour or so of integration with a drive of 1e-7 or so. ------------------------------------------------------------------------------------------------------------------------------------------------------------------ Note: I was trying to control the SR785 remotely to take some spectra, and accidentally blasted 5 Vpk into the common mode servo board EXC A (make sure to always set your units with GPIB source amplitude changes, even if you already set your units by hand to be mVrms, because SR785 always assumes units are Vpk, which is way too big for us and we lost lock immediately). We've gotten back to NOMINAL_LOW_NOISE, so nothing too bad must have happened...


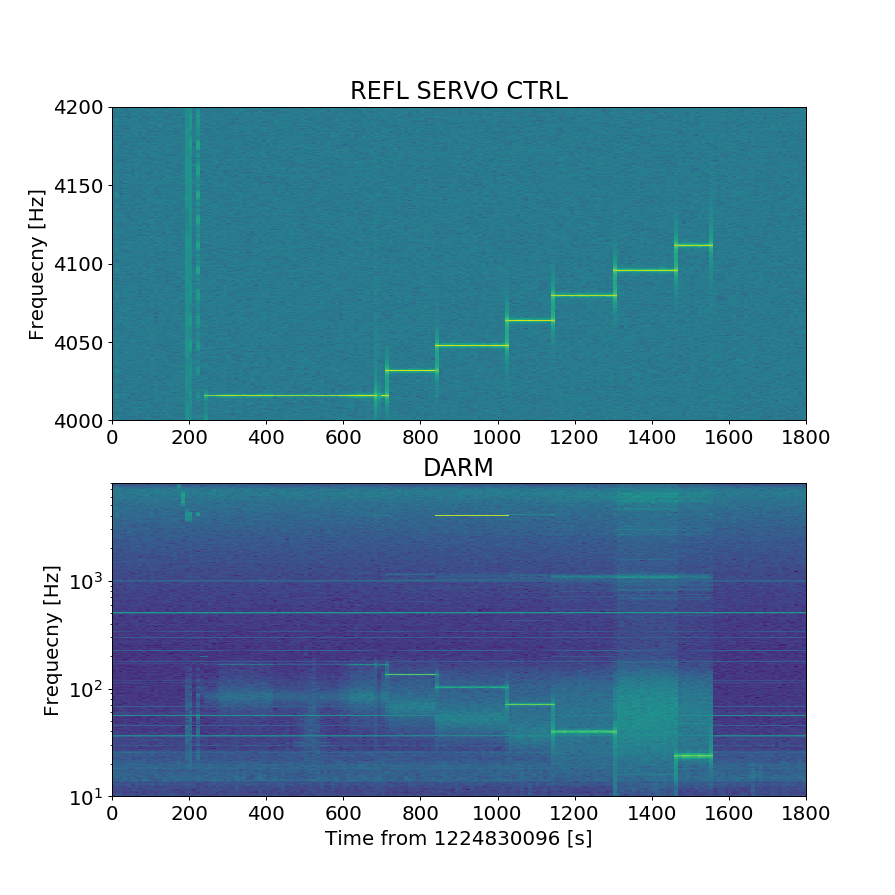
Here's a look at Craig's injections as a spectrogram. Injection times can be inferred from the plot below.
There is more going on here
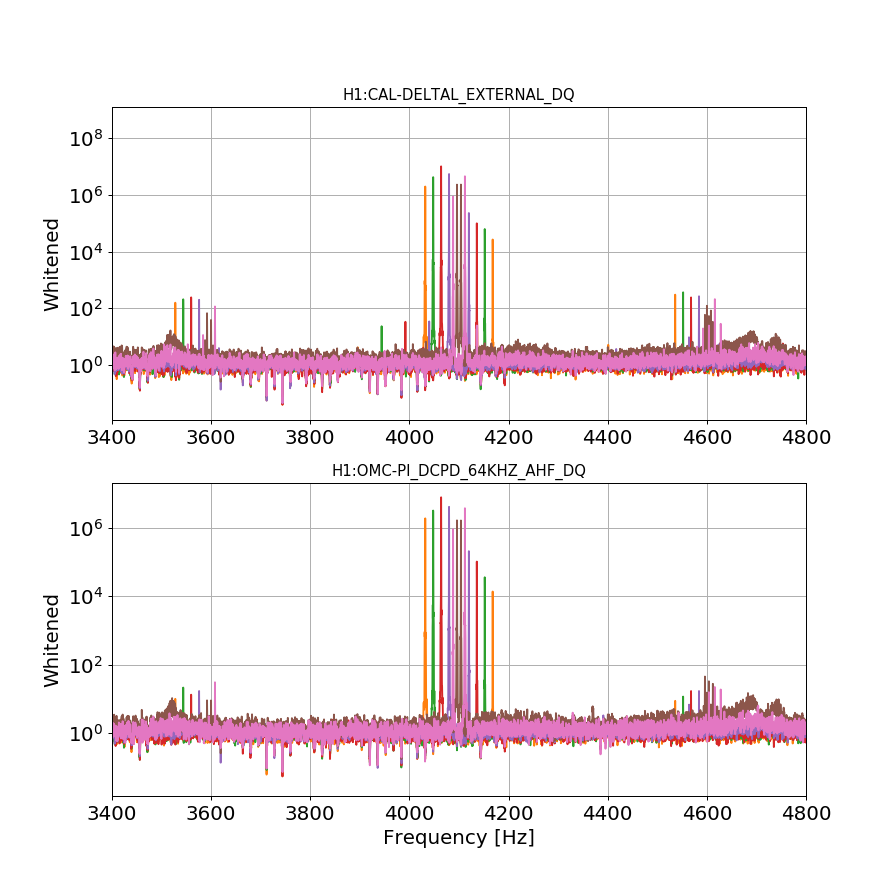
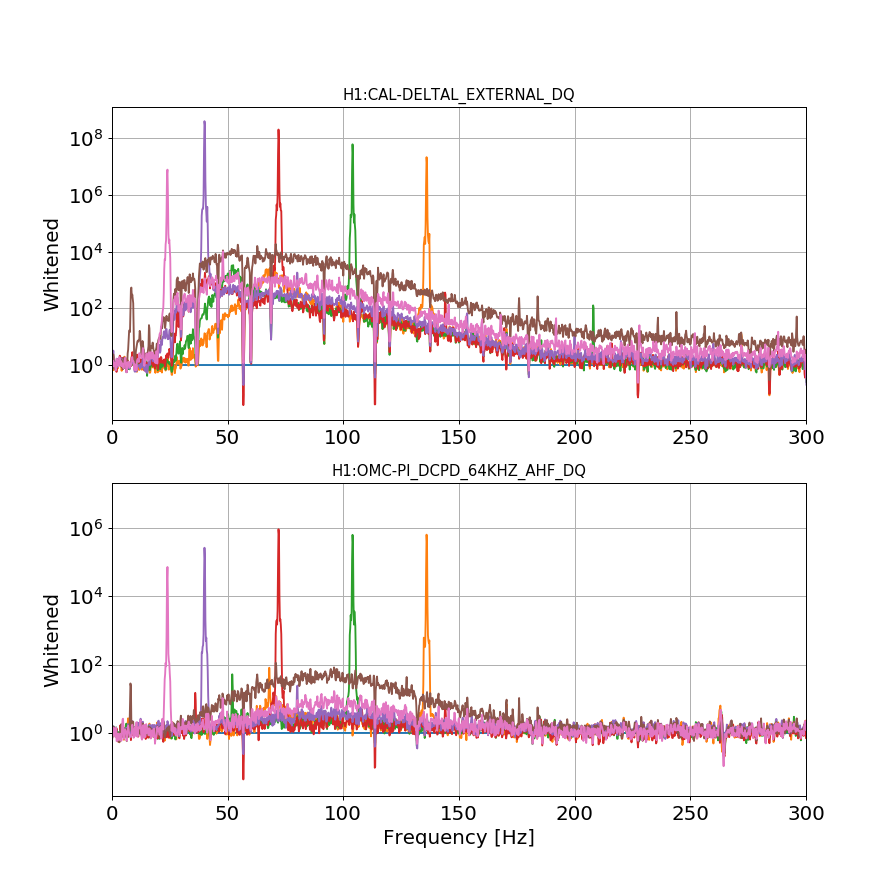
- The line in DARM is mirrored at exactly 4100.0 Hz, as pointed out by Craig (those lines have similar amplitudes in CAL_DELTAL and OMC_DCPD_A, I did not check OMC_DCPD_B since I wanted to look at high frequency too)
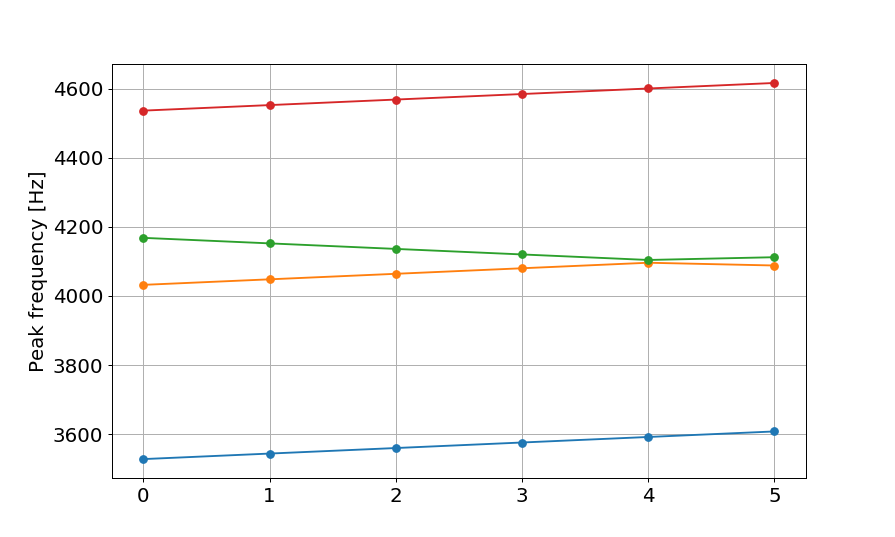
- But also there are more lines created around 3.6 Khz and 4.6 kHz, see figures 1 (whitened spectra) and figure 2 (frequency of peak as a function of the time segment). Those lines are spaced by 1008.4 Hz, and move all up in frequency in the same way as the injection, so they are not mirrored around 4100 Hz. Those lines are more prominent in CAL_DELTAL than in OMC_DCPD_A. We should check if they are in OMC_DCPD_B
- There also moving lines created around 504.1 Hz, moving symmetrically toward the line (figures 3 and 4, same plotting as above)
- The main noise bump below 300 Hz is much larger in CAL_DELTAL than in OMC_DCPD_A (figure 5), and there are also lines at frequencies below 300 Hz
- There's a double bump around 1080 Hz (figure 6)
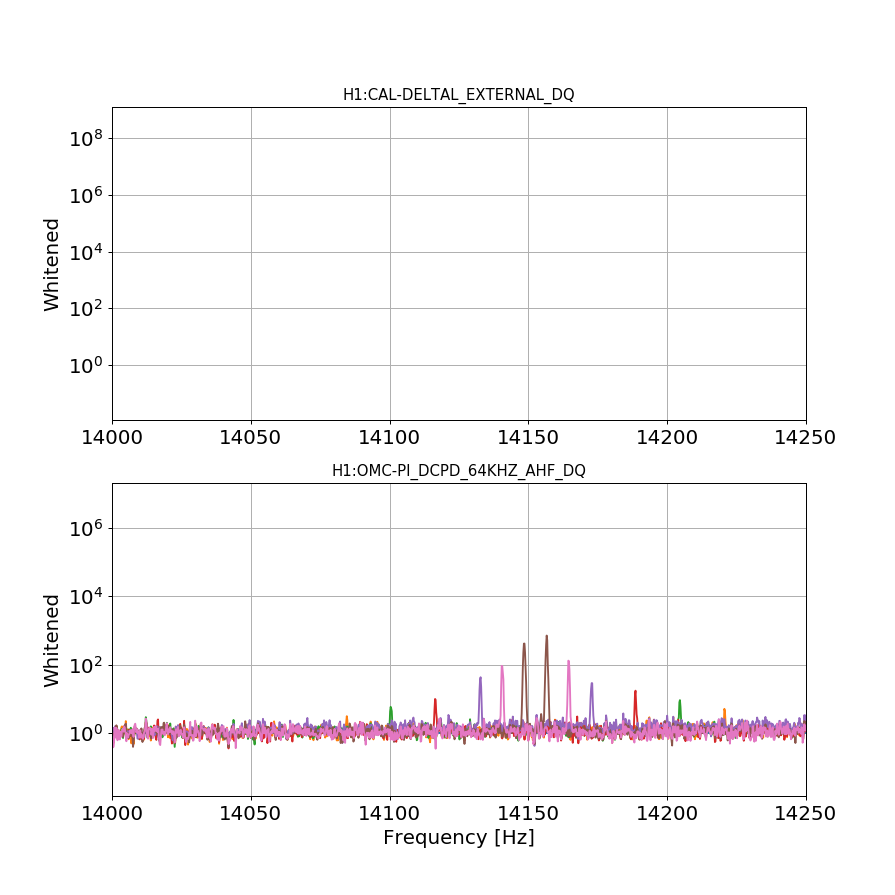
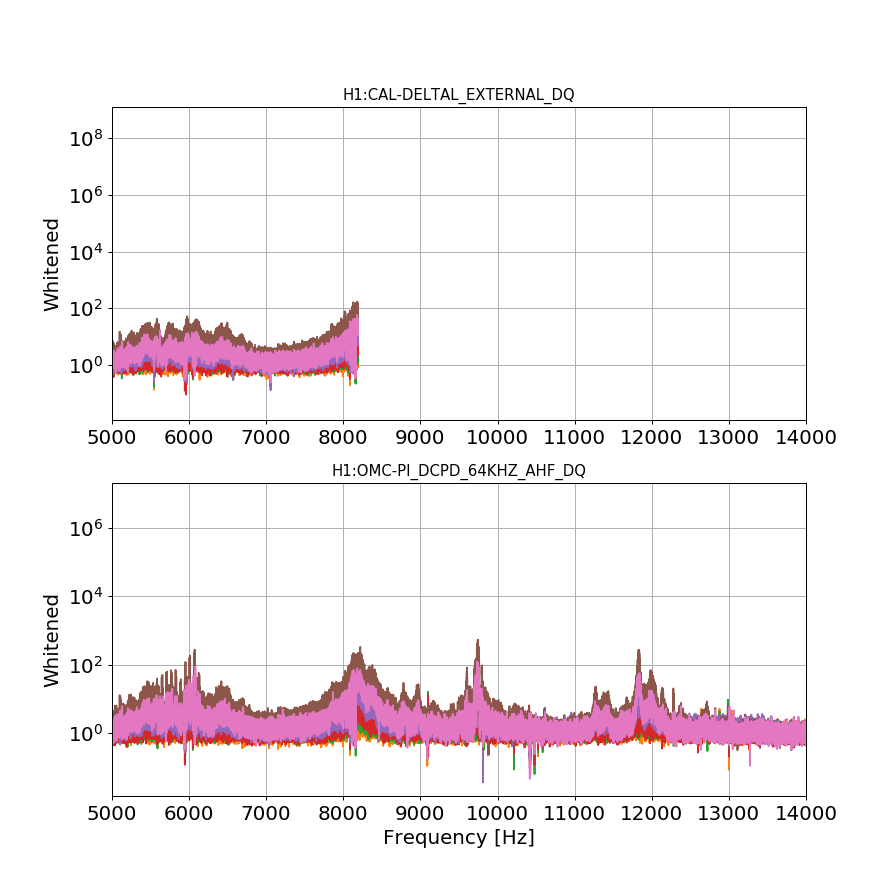
- In OMC_DCPD_A we can see more lines at HF around 14152 Hz (figure 7), and more bumps at high frequencies (figure 8)
EDIT: OMC_DCPD_A and OMC_DCPD_B seems to see the same lines and noise. There is a difference therefore between H1:OMC-DCPD_A_DQ and H1:OMC-PI_DCPD_64KHZ_AHF_DQ


4.100kHz is the OMC dither.
Summary:
There seem to be two different up/down conversion paths here. Look at the bottom of the attached.
One path makes a broad bump at fd-finj where fd and finj are the frequency of OMC dither and CM injection respectively. The effect seems to be small and doesn't matter that much.
The other makes a peak at 2*(fd-finj). This is because of the following mechanism.
CM(finj) shows up in OMC transmission at finj -> OMC length demodulates at fd to down-convert to fd-finj
-> OMC length servo imprints fd-finj in OMC length -> therefore it shows up in OMC transmission as 2*(fd-finj).
We need a real estimate of the frequency noise to see if this is a problem.
I'll wait for a proper analysis by Craig.
Preparation:
DCPD SUM propto [P0+dP(finj)]*[L0+dL(fd)+df(finj)*RT/FSR]^2 --- Eq1
where P0, dP, L0, dL, df, RT and FSR represent power of the light coming from IFO, small power modulation generated in the IFO (not OMC) by the CM injection, OMC length, OMC length dither, frequency noise hitting the OMC in Hz/sqrt(Hz), round trip length of the OMC and FSR of the OMC. propto is used as "proportional to".
In the attached, finj was smaller than fd in all of the traces (e.g. 4064Hz for the green). In DCPD at DC (bottom), you can see that there are broad bumps at fd-finj as well as huge peaks at 2*(fd-finj).
In the top panel, large peaks to the left of 4100Hz are direct finj terms:
Direct peaks at finj = A*[dP(finj)*avg(L0^2)+2*P0*rms(L0)*df(finj)*RT/FSR]. --- Eq2
(Averaging and RMS are made over the entire frequency band. I ignored avg(dL^2) and avg(df^2) for convenience, but when you do the quantitative calculation you need to substitute avg(L0^2) with avg(L0^2+dL^2+(df*RT/FSR)^2).)
Direct down conversion not likely a problem:
Direct down conversion terms in EQ1 are
2*dL(fd)*[dP(finj)*L0+P0*df(finj)*RT/FSR] at fd-finj --- Eq3
If the second term is dominant I expect to see a clear peak corresponding to this in the bottom plot at fd-finj because P0 has a large true DC value. Instead we have broad bump. So the direct down conversion mechanism is likely from the first term where L0 is zero at DC . In other words, this is an amplitude noise coming from IFO, not frequency noise hitting OMC.
Anyway, from the top plot it's clear the CM injection is almost 4 orders of magnitude larger than the background frequency noise at the measurement frequency bin. It could be even larger but we cannot know as we're just looking at DCPD, not true frequency noise. If you simply lower bumps by 4 orders of magnitude, it would be an order or two smaller than no injection trace (black). Therefore, unless these are proportional to injection^n where n is a constant that is smaller than 1/2 or something, this is probably not a problem.
(Update: Since the bump in OMC length L0 seems to have the width of 100Hz or so, let's compare the injection power with the background frequency noise power at 4100+-100Hz. In this plot there are about 2000 frequency bins, and the injection peak is ~1E4 larger than the background at least, so RMS to RMS the injection is at least 1E4/sqrt(2000)~200 larger than the background frequency noise in this band. The real frequency noise floor could be even lower.
If you lower the bumps by a factor of 200, they are below the non-injection spectrum by at least a factor of 2 or so.)
But that should be experimentally determined. I'll wait for Craig's more detailed analysis.
It would be useful to change dither strength dL(fd) to see how the bump scales. Note that the change in dL also causes change in rms(L0+dL).
Path including OMC length servo causing 2*(fd-finj):
Eq2 is demodulated at fd by the OMC length loop and down converted to OMC length at fd-finj (middle two plots).
OMCL error propto [dP(finj)*avg(L0^2)+2*P0*rms(L0)*df(finj)*RT/FSR] at fd-finj. --- Eq4
(Update: This happens even if dL(fd)=0 because this is purely in software demodulation.)
OMC length loop imprints this into the physical length of OMC, i.e.
L0 propto [dP(finj)*avg(L0^2)+2*P0*rms(L0)*df(finj)*RT/FSR] * G/(1+G) at fd-finj ---Eq5
where G is the OLTF of the OMC length loop at |fd-finj|, UGF at 6Hz and the shape is about 1/f from a few Hz to 100Hz.
Finally, plugging Eq5 back to Eq1, L0^2 term will bring the peak to 2*(fd-finj).
DCPD propto A*P0*[[dP(finj)*avg(L0^2)+2*P0*rms(L0)*df(finj)*RT/FSR] * G/(1+G)]^2 at 2*(fd-finj). ---Eq6
This is suppressed by DARM loop by injecting this into physical DARM.
The fact that the peaks in the bottom plot goes down as the frequency goes up (despite larger DARM loop suppression at lower frequency) seems to make sense qualitatively.
Anyway, this seems to be a linear coupling with side lobes. Lowering the peaks in DCPD at fd-finj (bottom) by four orders of magnitude, the peaks seem to come above the no injection curve. So here we need a real estimate of the frequency noise. Again will wait for Craig.
We could simply change OMC length gain (thus G) to see if this matters, as the UGF is about 6Hz and anything above UGF in Eq6 is scaled by [G/(1+G)]^2 in Eq6.
Other peaks:
There are huge mirror peaks in DCPD at fd+(fd-finj)=finj+2*(fd-finj), e.g. for green trace of finj=4064, huge mirror peak is at finj+2*(fd-finj)=4064+2*36=4136Hz.
This should be P0*L0(fd-finj)*dL(fd) term in Eq1, i.e. a cross term of the dither itself and the fd-finj component in L0 (imprinted by OMC length loop). Another term, P0(2fd-2finj)*L0*df(finj) which is the cross term of the frequency noise df(finj) and the 2(fd-finj) component in P0 (imprinted by DARM loop), should not make a clear peak as it is also proportional to the OMC length L0 which should be zero at zero frequency.
I don't understand why there are smaller but definitive peaks at finj-2*(fd-finj). The same P0(2fd-2finj)*L0*df(finj) term will produce something but not a distinct peak. But I stop here.

Quick plot showing the 2 *|f_inj - f_omc| reflection peak amplitudes in DARM for each injection frequency around 4.100 kHz (shown in plot 1 of the original post).
Approximately follows a 1/f^2 dependence.

Quick plot of CARM peak injection amplitude at 4.200 kHz, (exactly 100 Hz away from the OMC dither) vs DARM peak intensity, with a focus on first order |f_inj - f_dither| broadband noise.

We can see two different mechanisms of frequency noise coupling to DARM. The first (the broadband noise) is a linear dependence on amplitude that dominates with low excitations, the other (a large spike) has an amplitude cubed dependence.

The first, linearly-rising broadband noise is consistent with Keita's intensity noise prediction.  We have no real proof yet that it's intensity noise other than Keita's finely honed noise hunting instincts.
-------------------------------------------------------------------------------------------------------------------------------------------

I was confused by this plot, as Keita's analysis does not have any obvious frequency-noise-cubed dependencies that work out to give us a response at |f_inj - f_dither|.  It turns out we have to include some higher order stuff to get the freq-noise-cubed terms, none of which is relevant for our noise levels.

-------------------------------------------------------------------------------------------------------------------------------------------
I also included an uncalibrated CARM error spectrum to give an idea of the relevant noise levels in CARM right now, assuming we aren't sensing noise limited at 4 kHz.

CARM Noise at the injection point at 4 kHz: ~ 2 uV/rtHz, or ~20 uV in a 100 Hz bandwidth around 4.1 kHz.

When compared with the lowest injection amplitudes of 3 mVp = 2 mV, we're about a factor of 10 away from seeing direct broadband noise in DARM from CARM.

-------------------------------------------------------------------------------------------------------------------------------------------

Koji OMC parameters


