This is the follow-up analysis of the measurements described in 44881. The method is quite simple: I demodulated the LSC signals (DARM, MICH, SRCL and PRCL) at 20Hz and 200Hz, using the excitation line in SRCL_OUT to set the I and Q phases (I extracted absolute phases of the two lines by band-passing the SRCL_OUT signal and fitting a sinusoid to a short period. Then I generate I and Q demodulation signals as numerical sines and cosines). The demodulated signals (I and Q for both 20Hz and 200Hz) are then decimated to 16 Hz and low passed at 4 Hz.
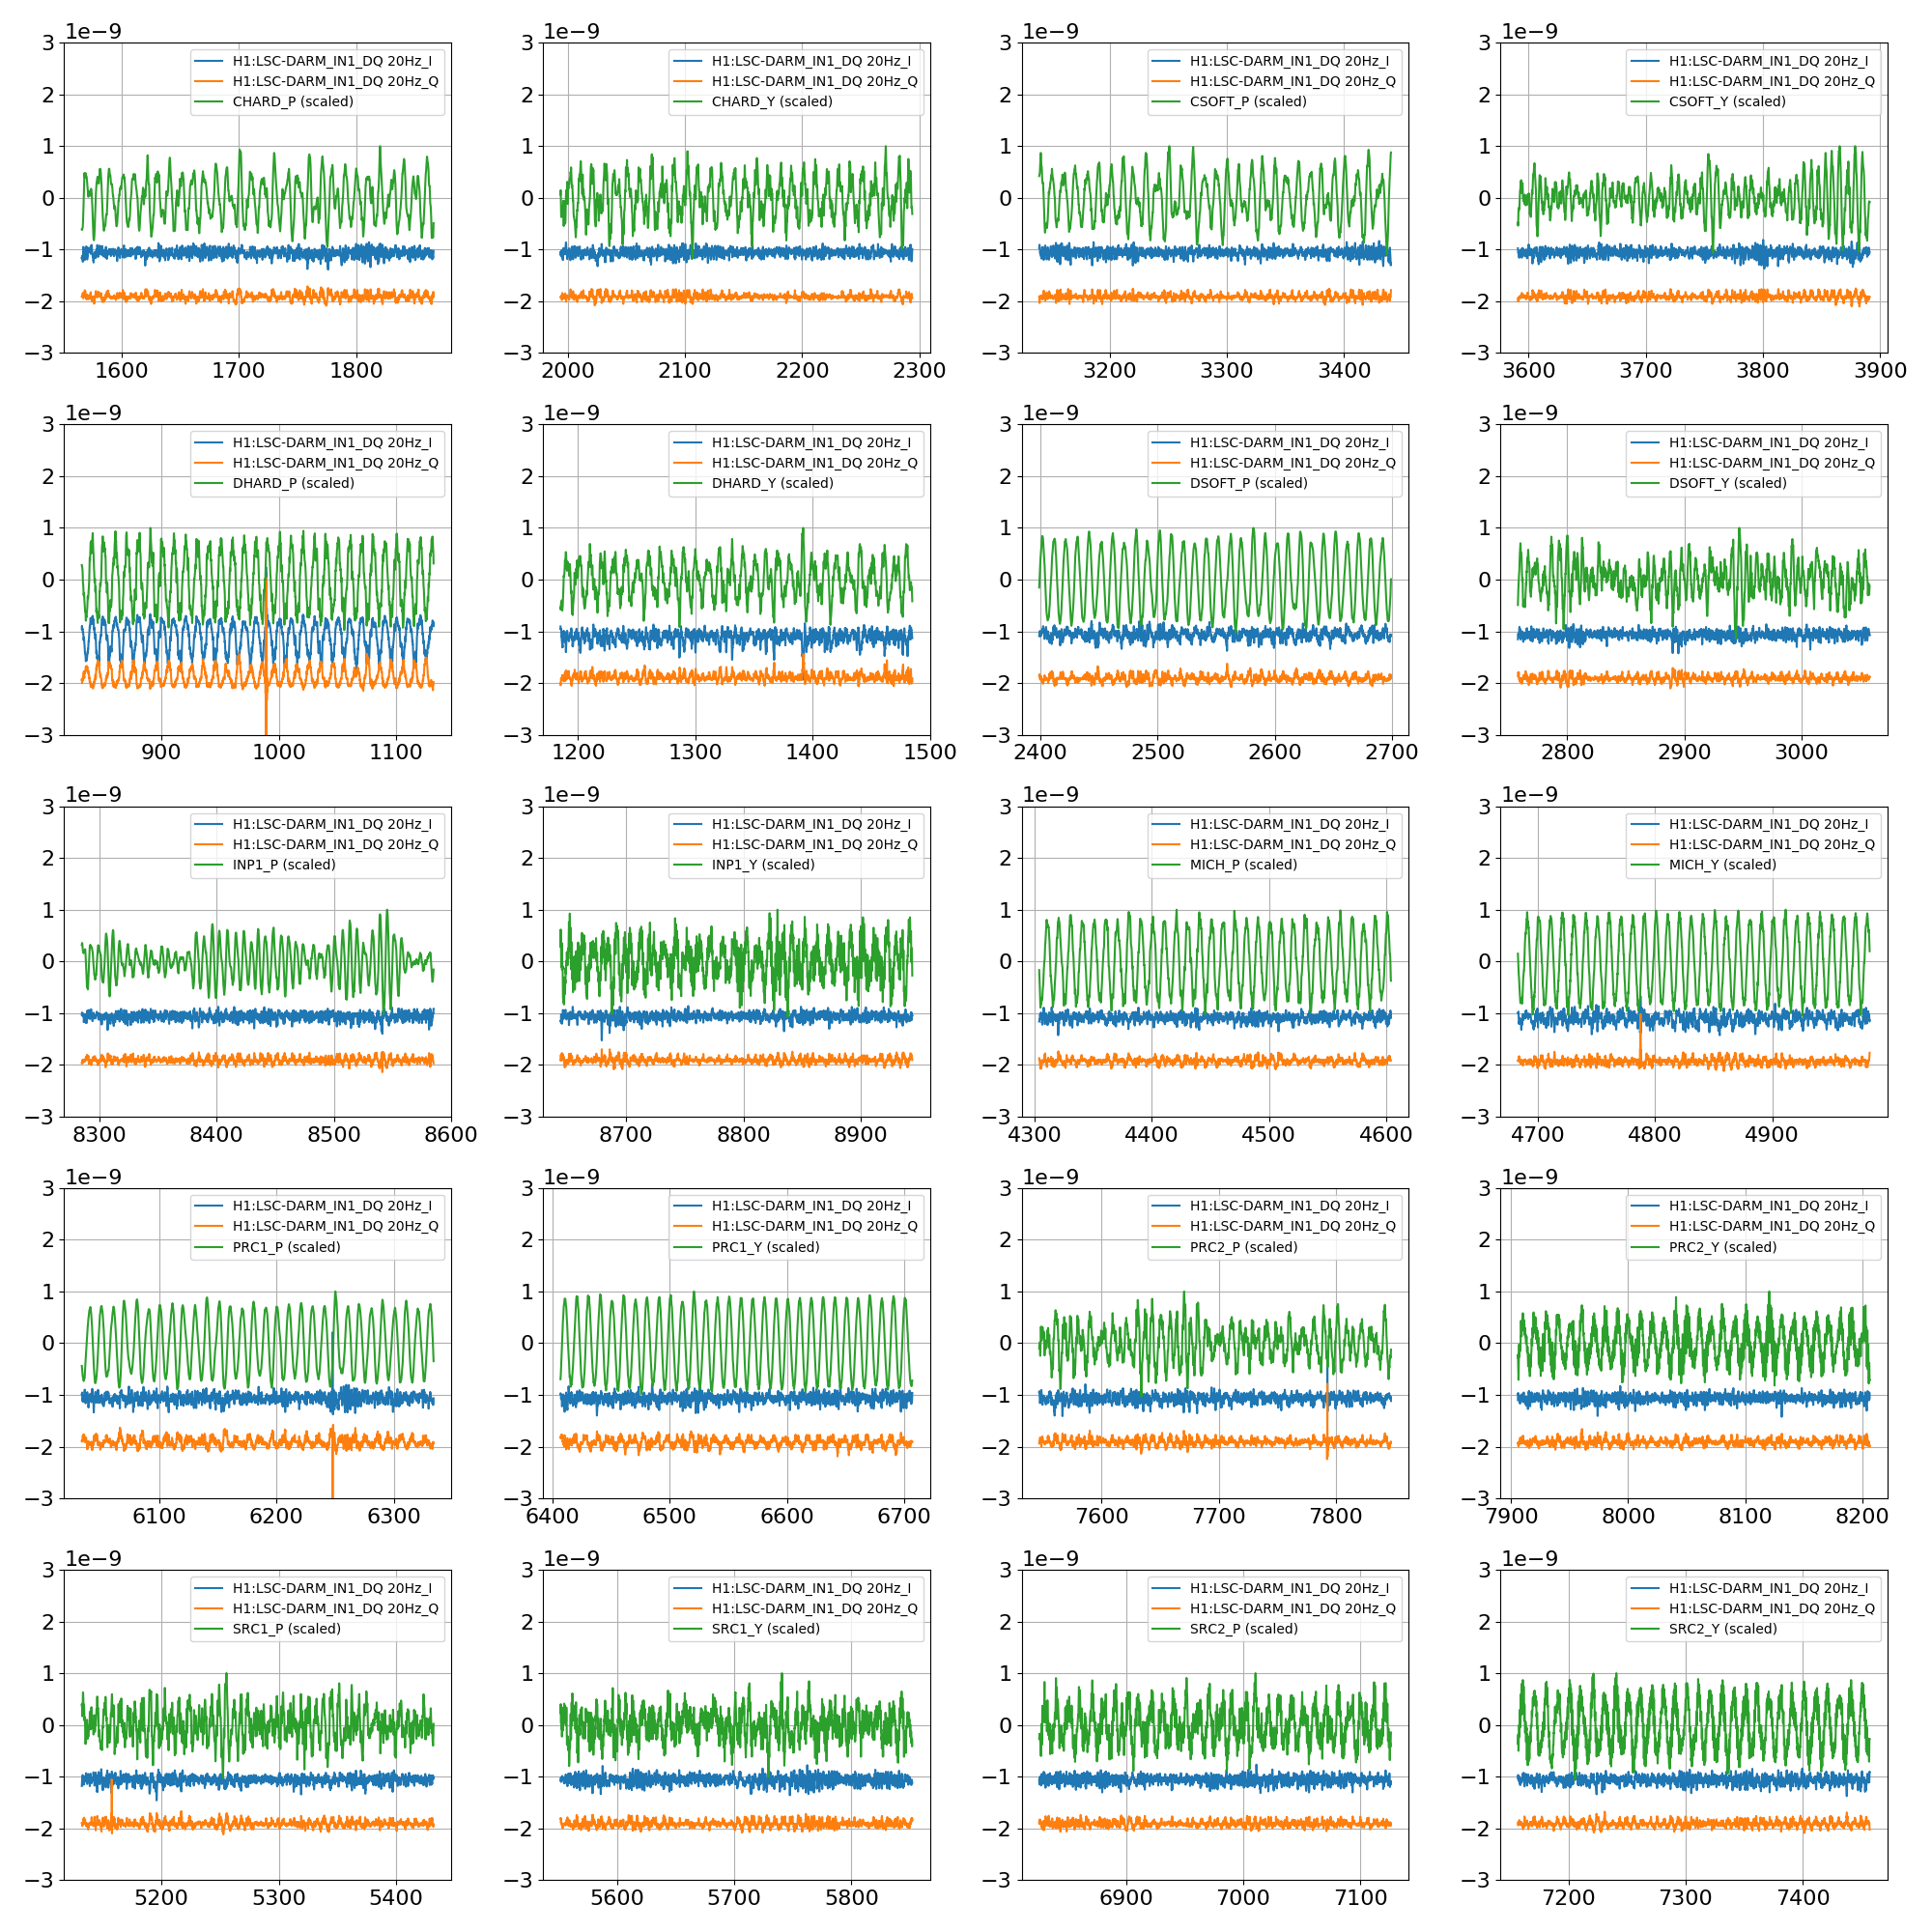
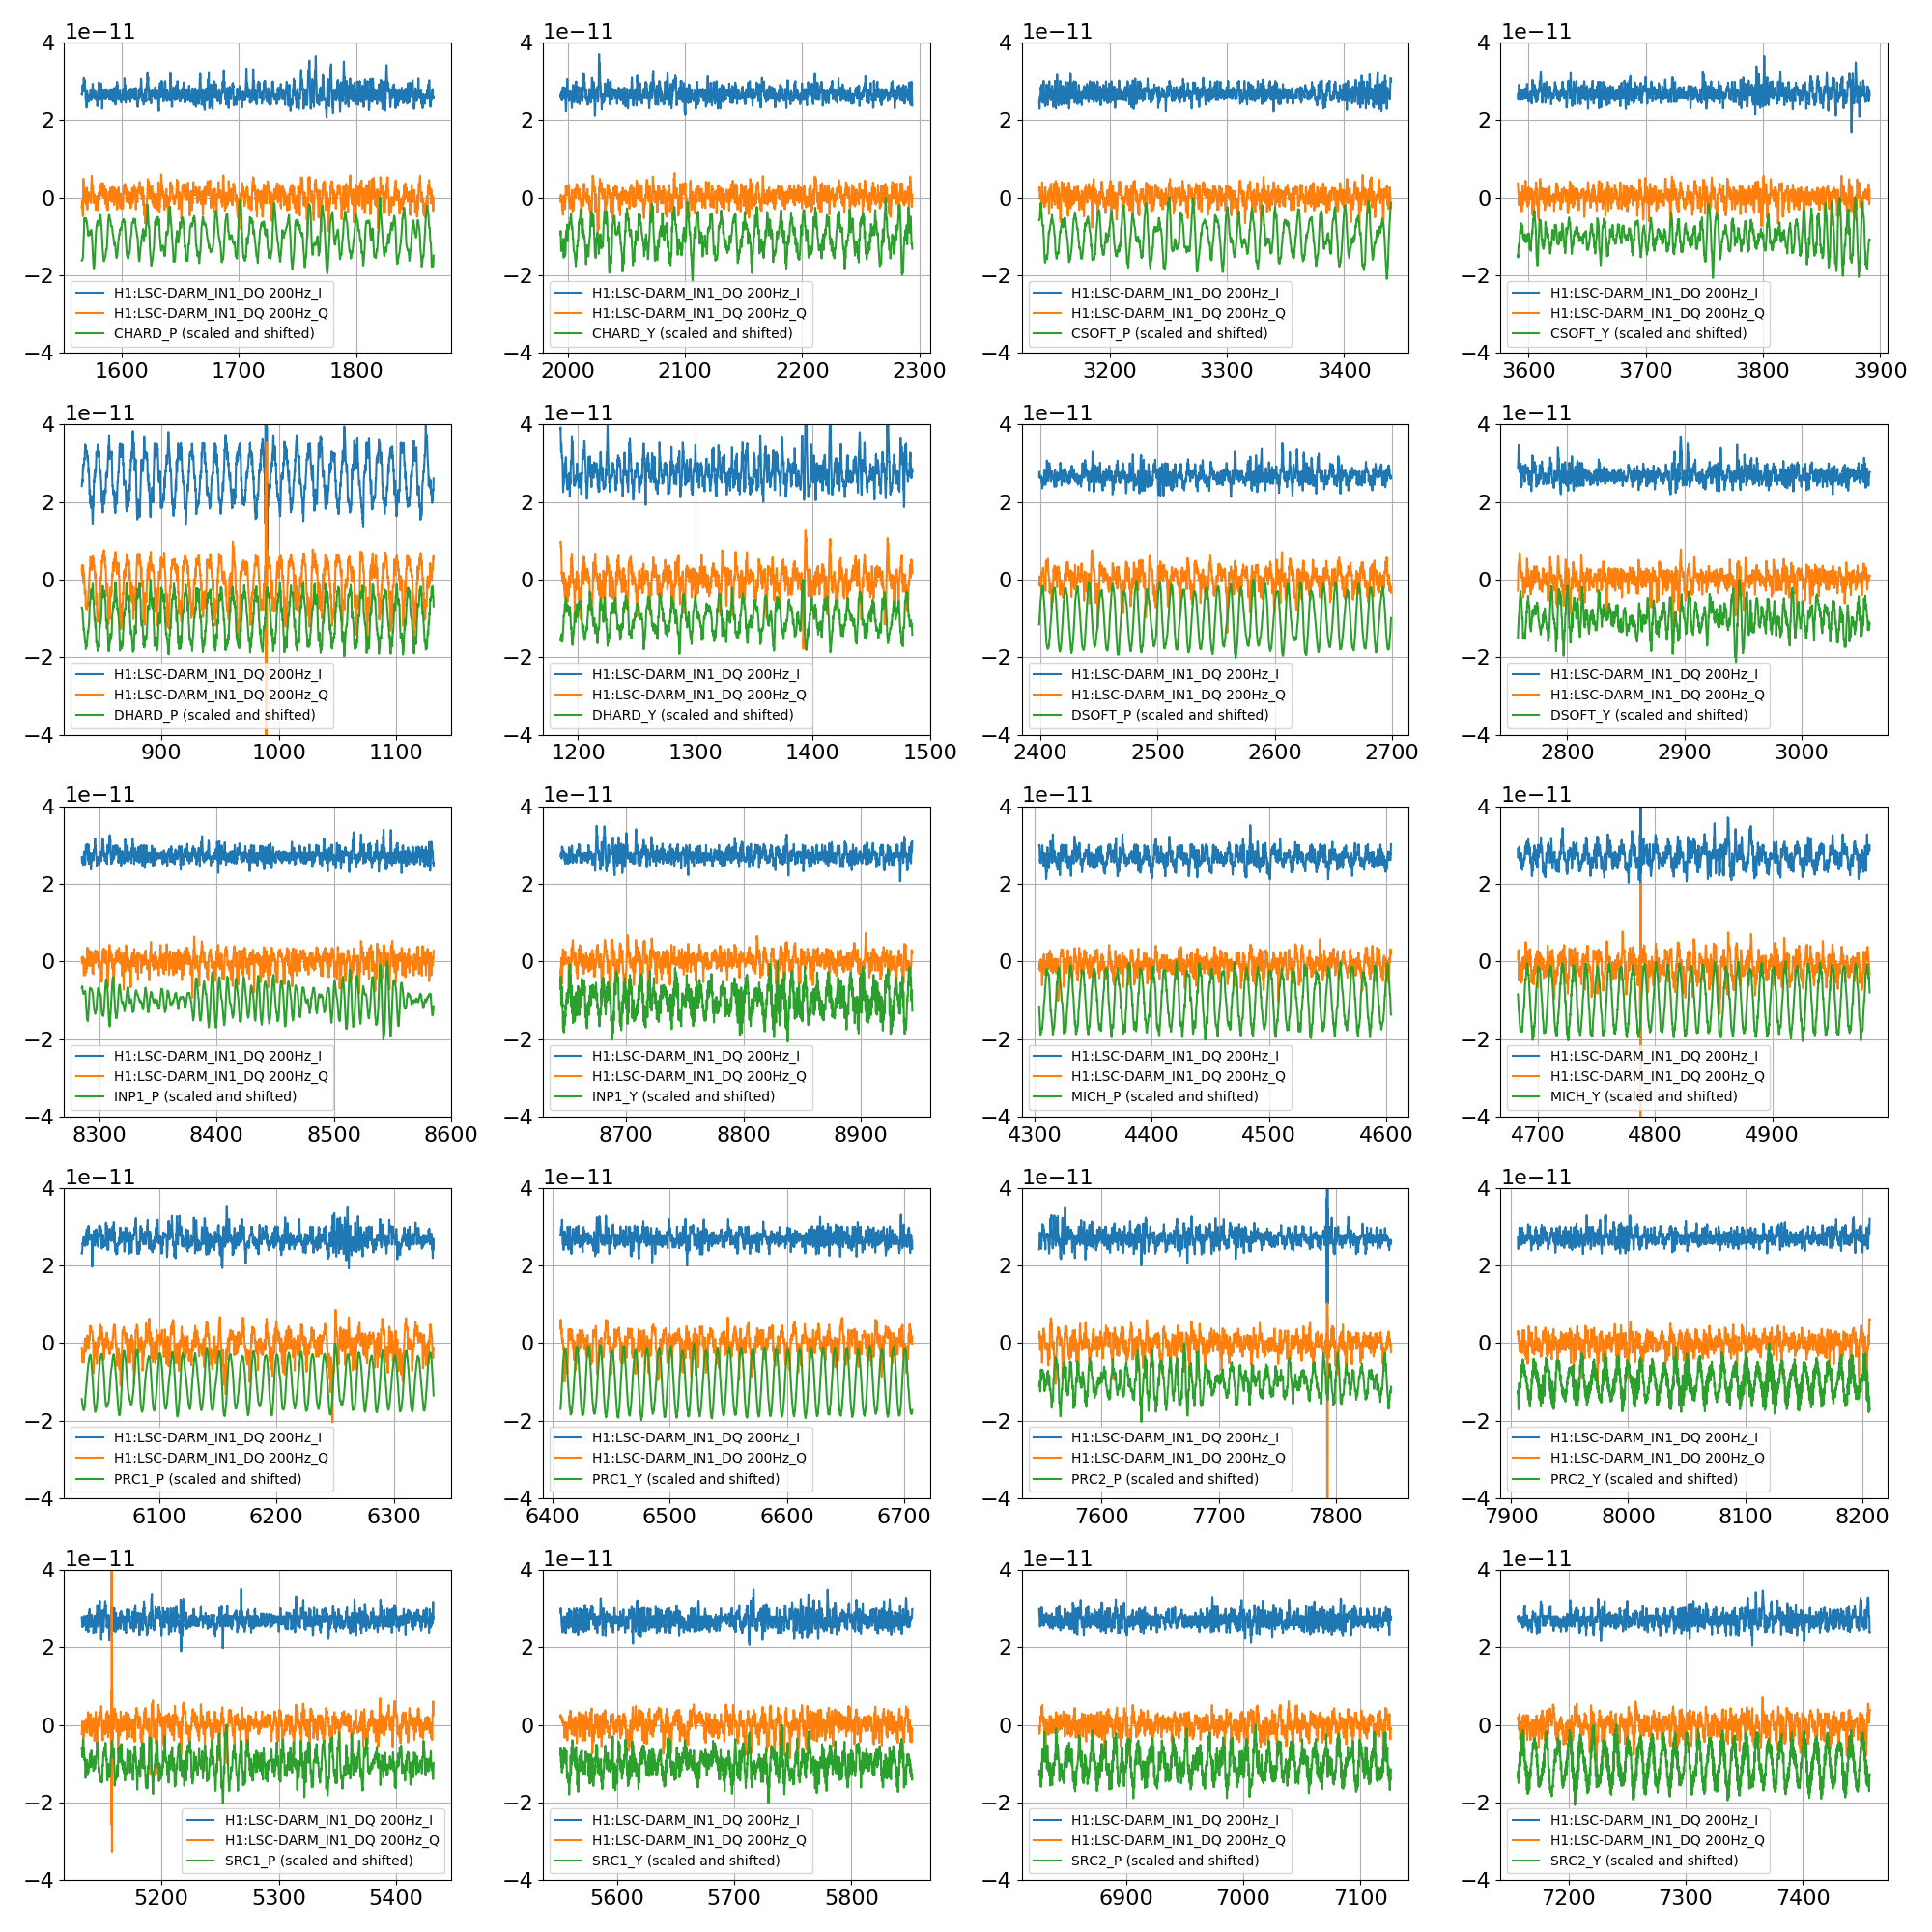
The two plots below shows the most interesting results, which is how the SRCL to DARM coupling is modulated byt the angular motions. In each panel, I show the demodulated I and Q signals (basically the DARM/SRCL transfer function at either 20 or 200 Hz) and a scaled and shifted version of the ASC input signal corresponding to where the 100 mHz excitation was injected at that time. Left plot is the DARM_IN1 signal demodulated at 20 Hz, the right plot is the DARM_IN1 signal demodulated at 200 Hz.
Note that the excitation amplitude is not calibrated, so we can't do a urad to urad comparison (yet). But in all cases the excitation was larger than the typical motion of the d.o.f. at low frequency, and of comparable size.
In summary
- at 20 Hz the largest modulation comes from DHARD_P. Other non negligible contributions come from PRC1_P and PRC1_Y
- at 200 Hz the largest contribution comes again from DHARD_P. PRC1_P and PRC1_Y are still contributing, but now I can see also a DHARD_Y and DSOFT_P modulation.
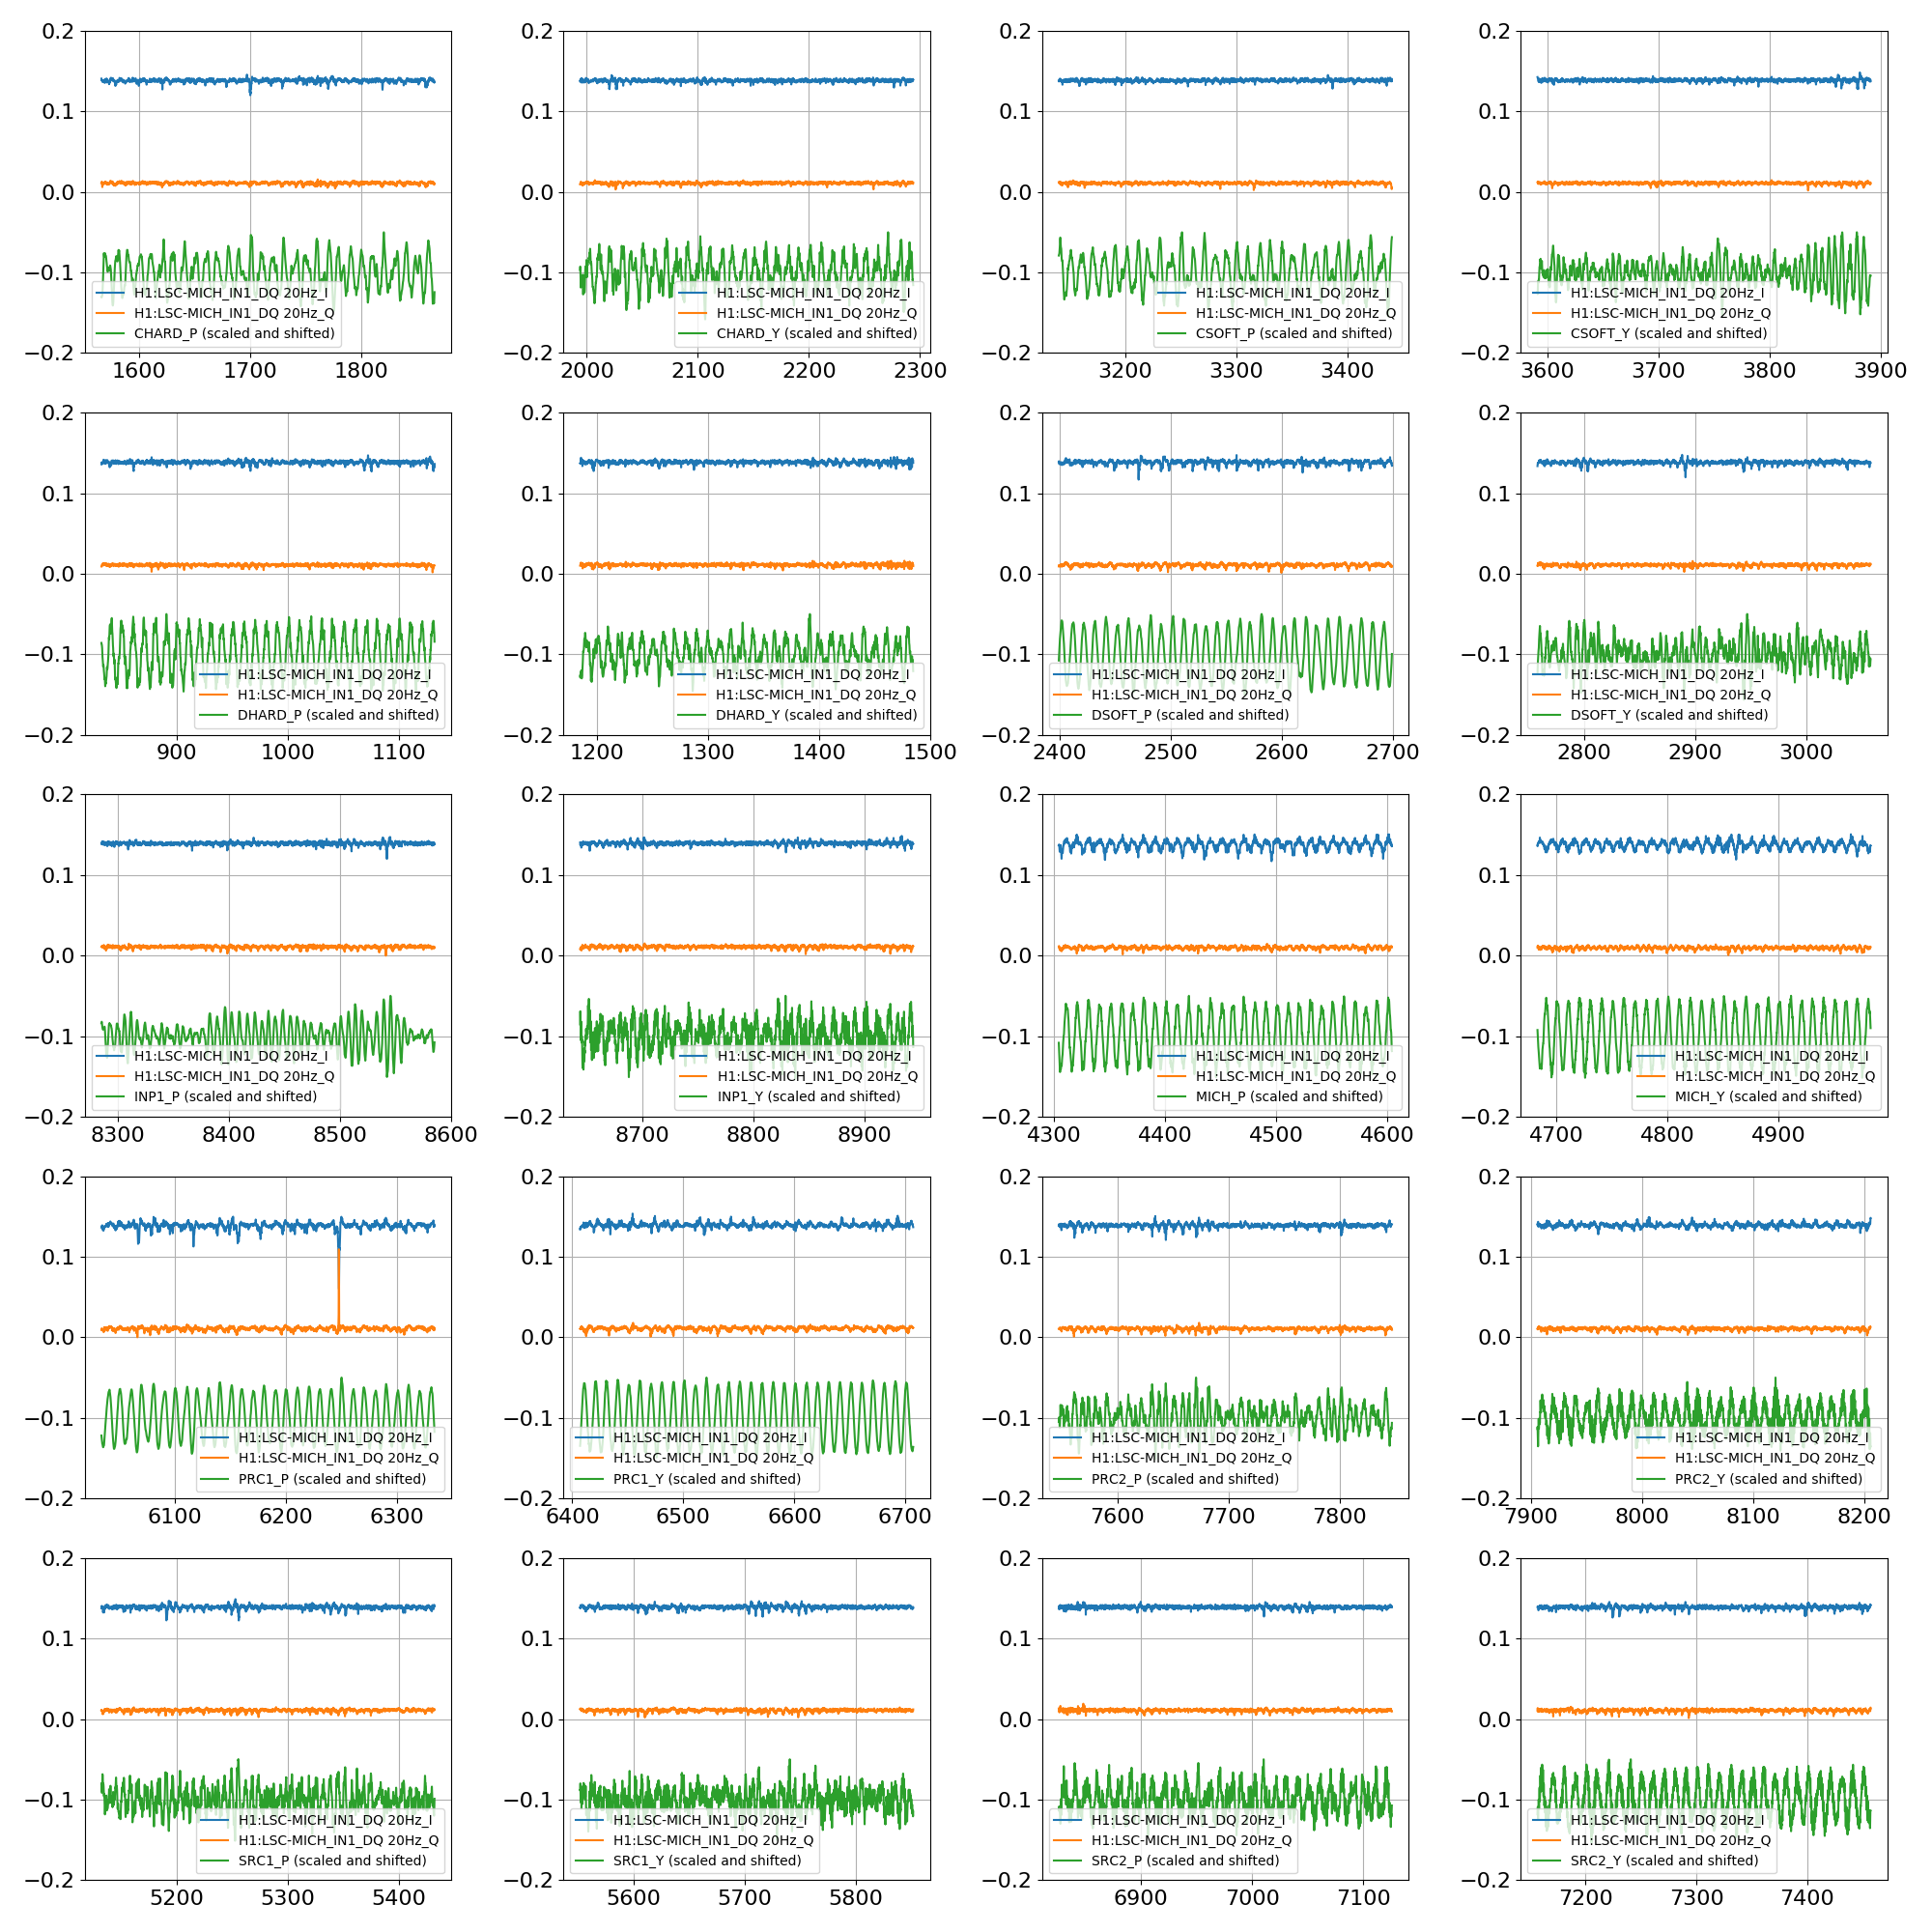
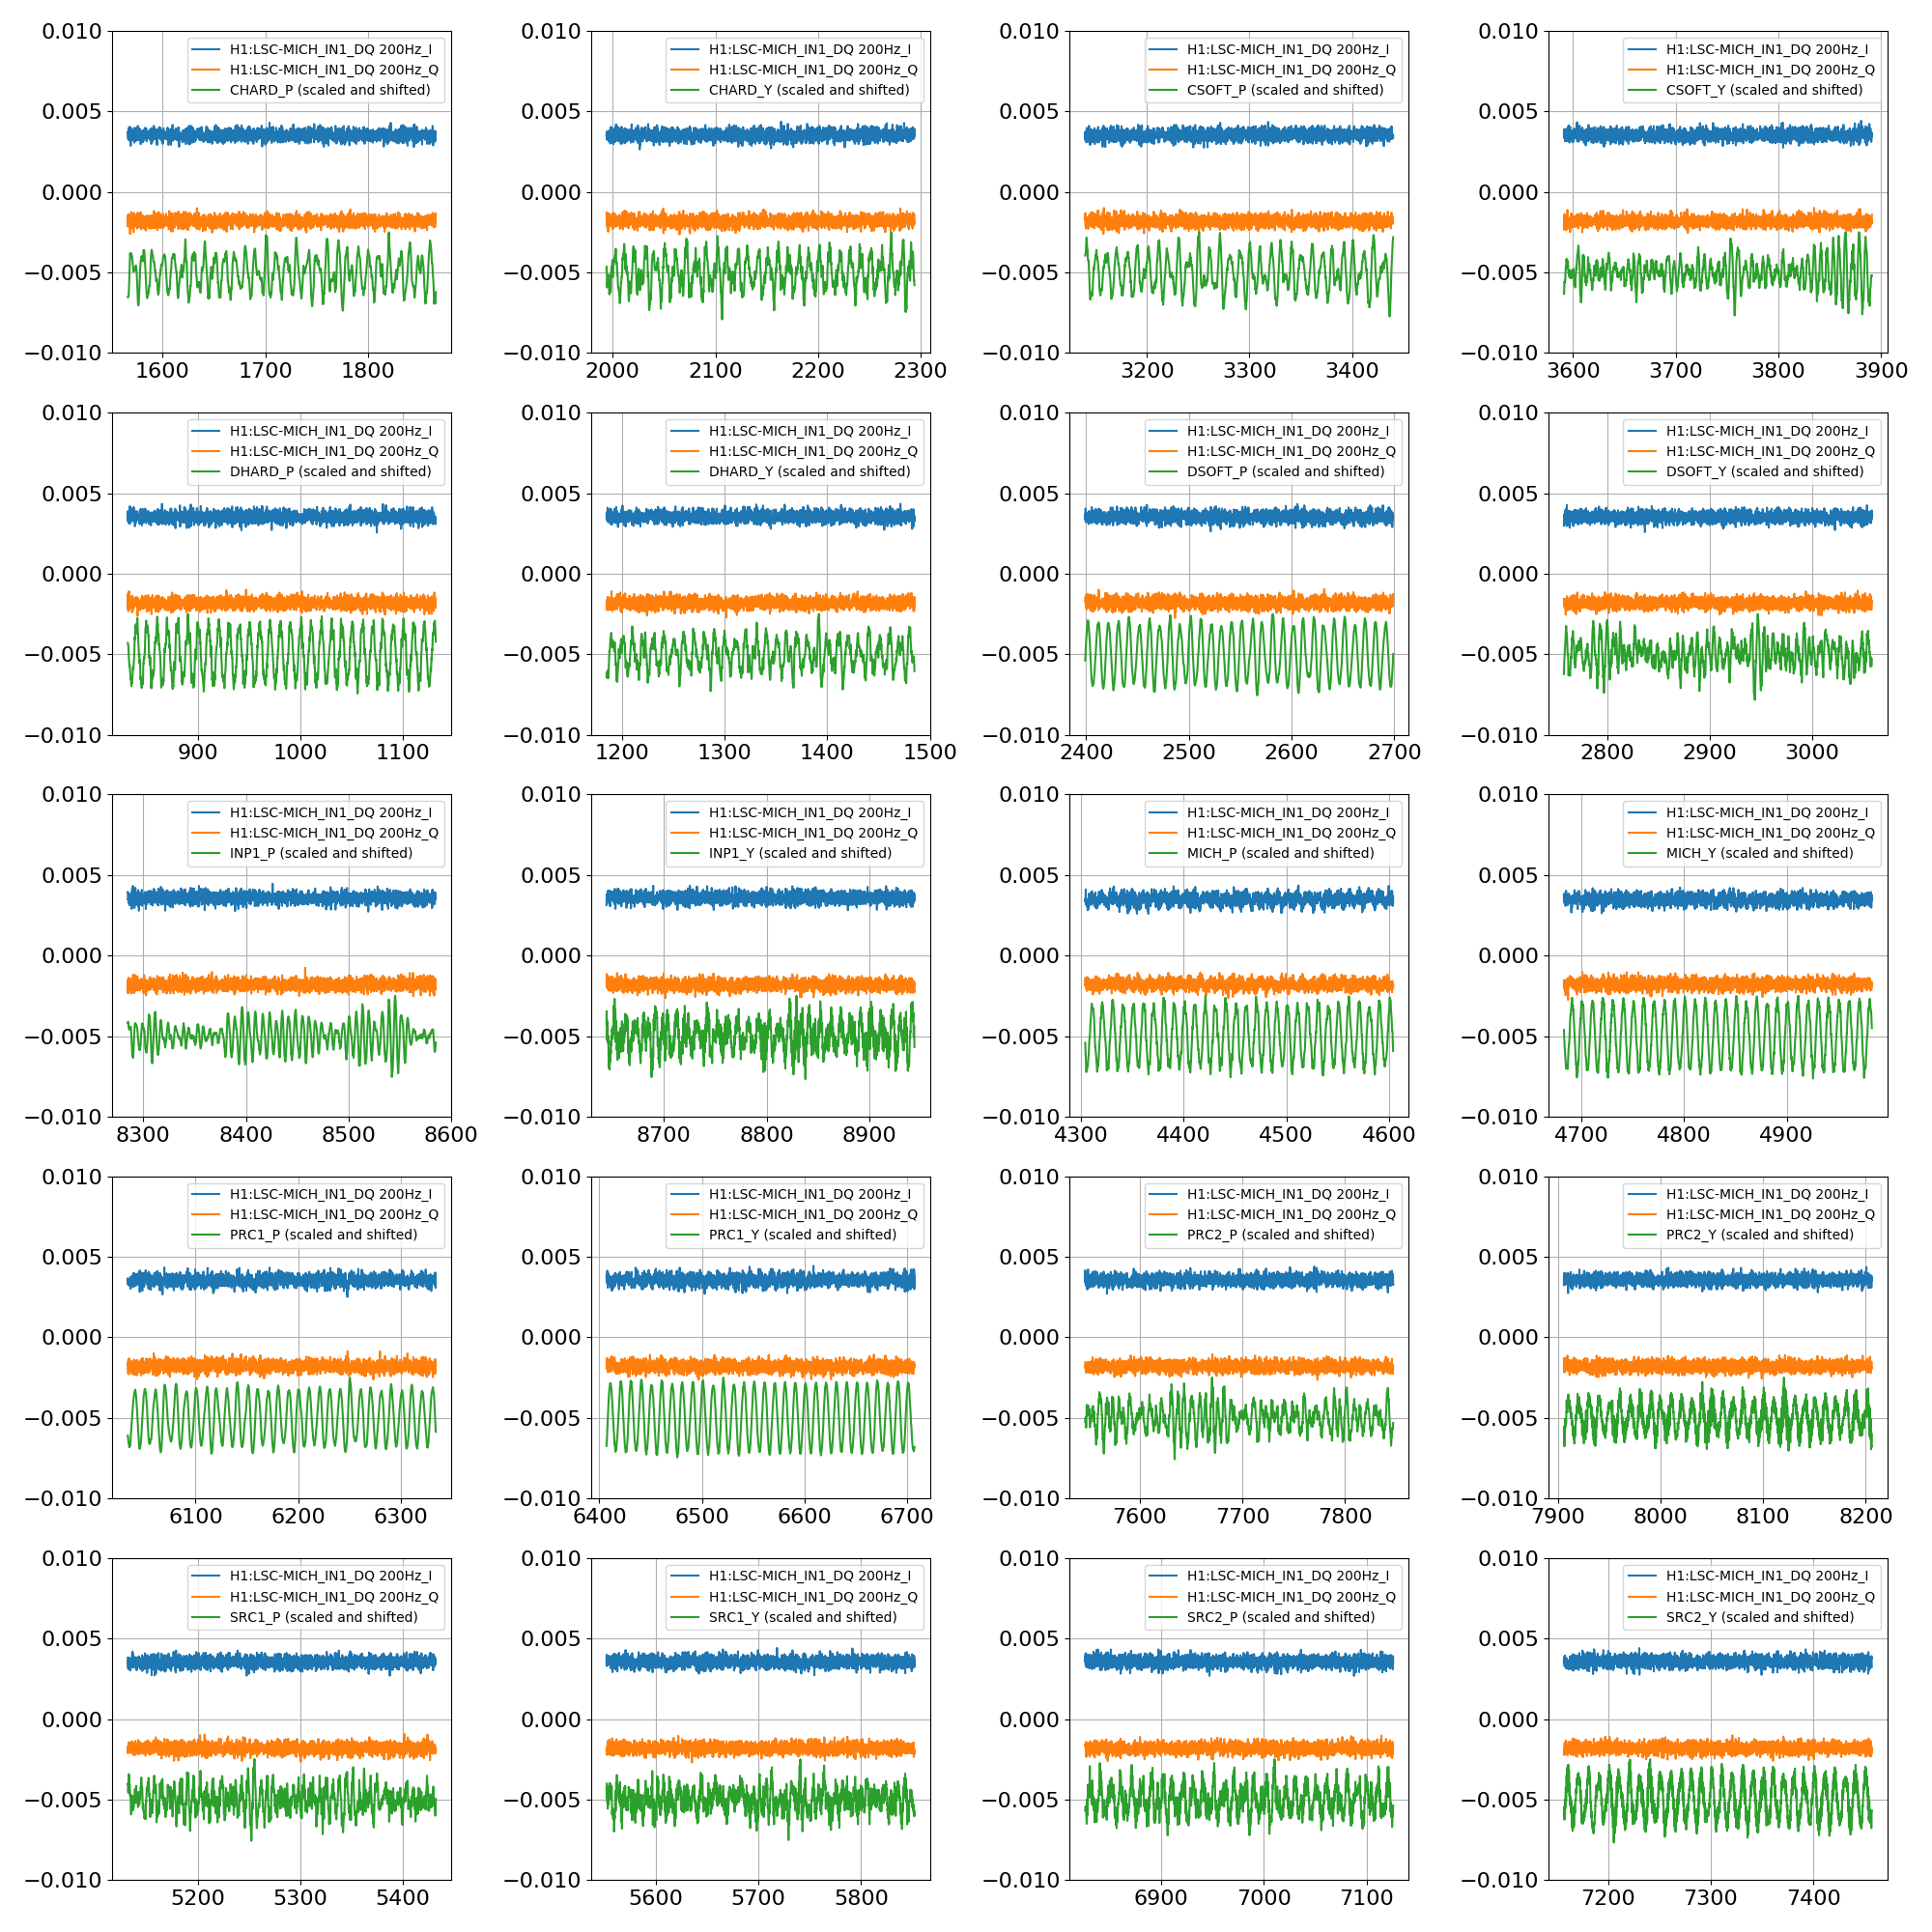
The other plots attached below show the demodulated signals in PRCL_IN, MICH_IN and SRCL_IN:
- SRCL to SRCL (basically the open loop gain of SRCL) is quite stable
- SRCL to MICH also shows small modulation
- SRCL to PRCL instead shows a lot of modulation, by almost all angular signals.
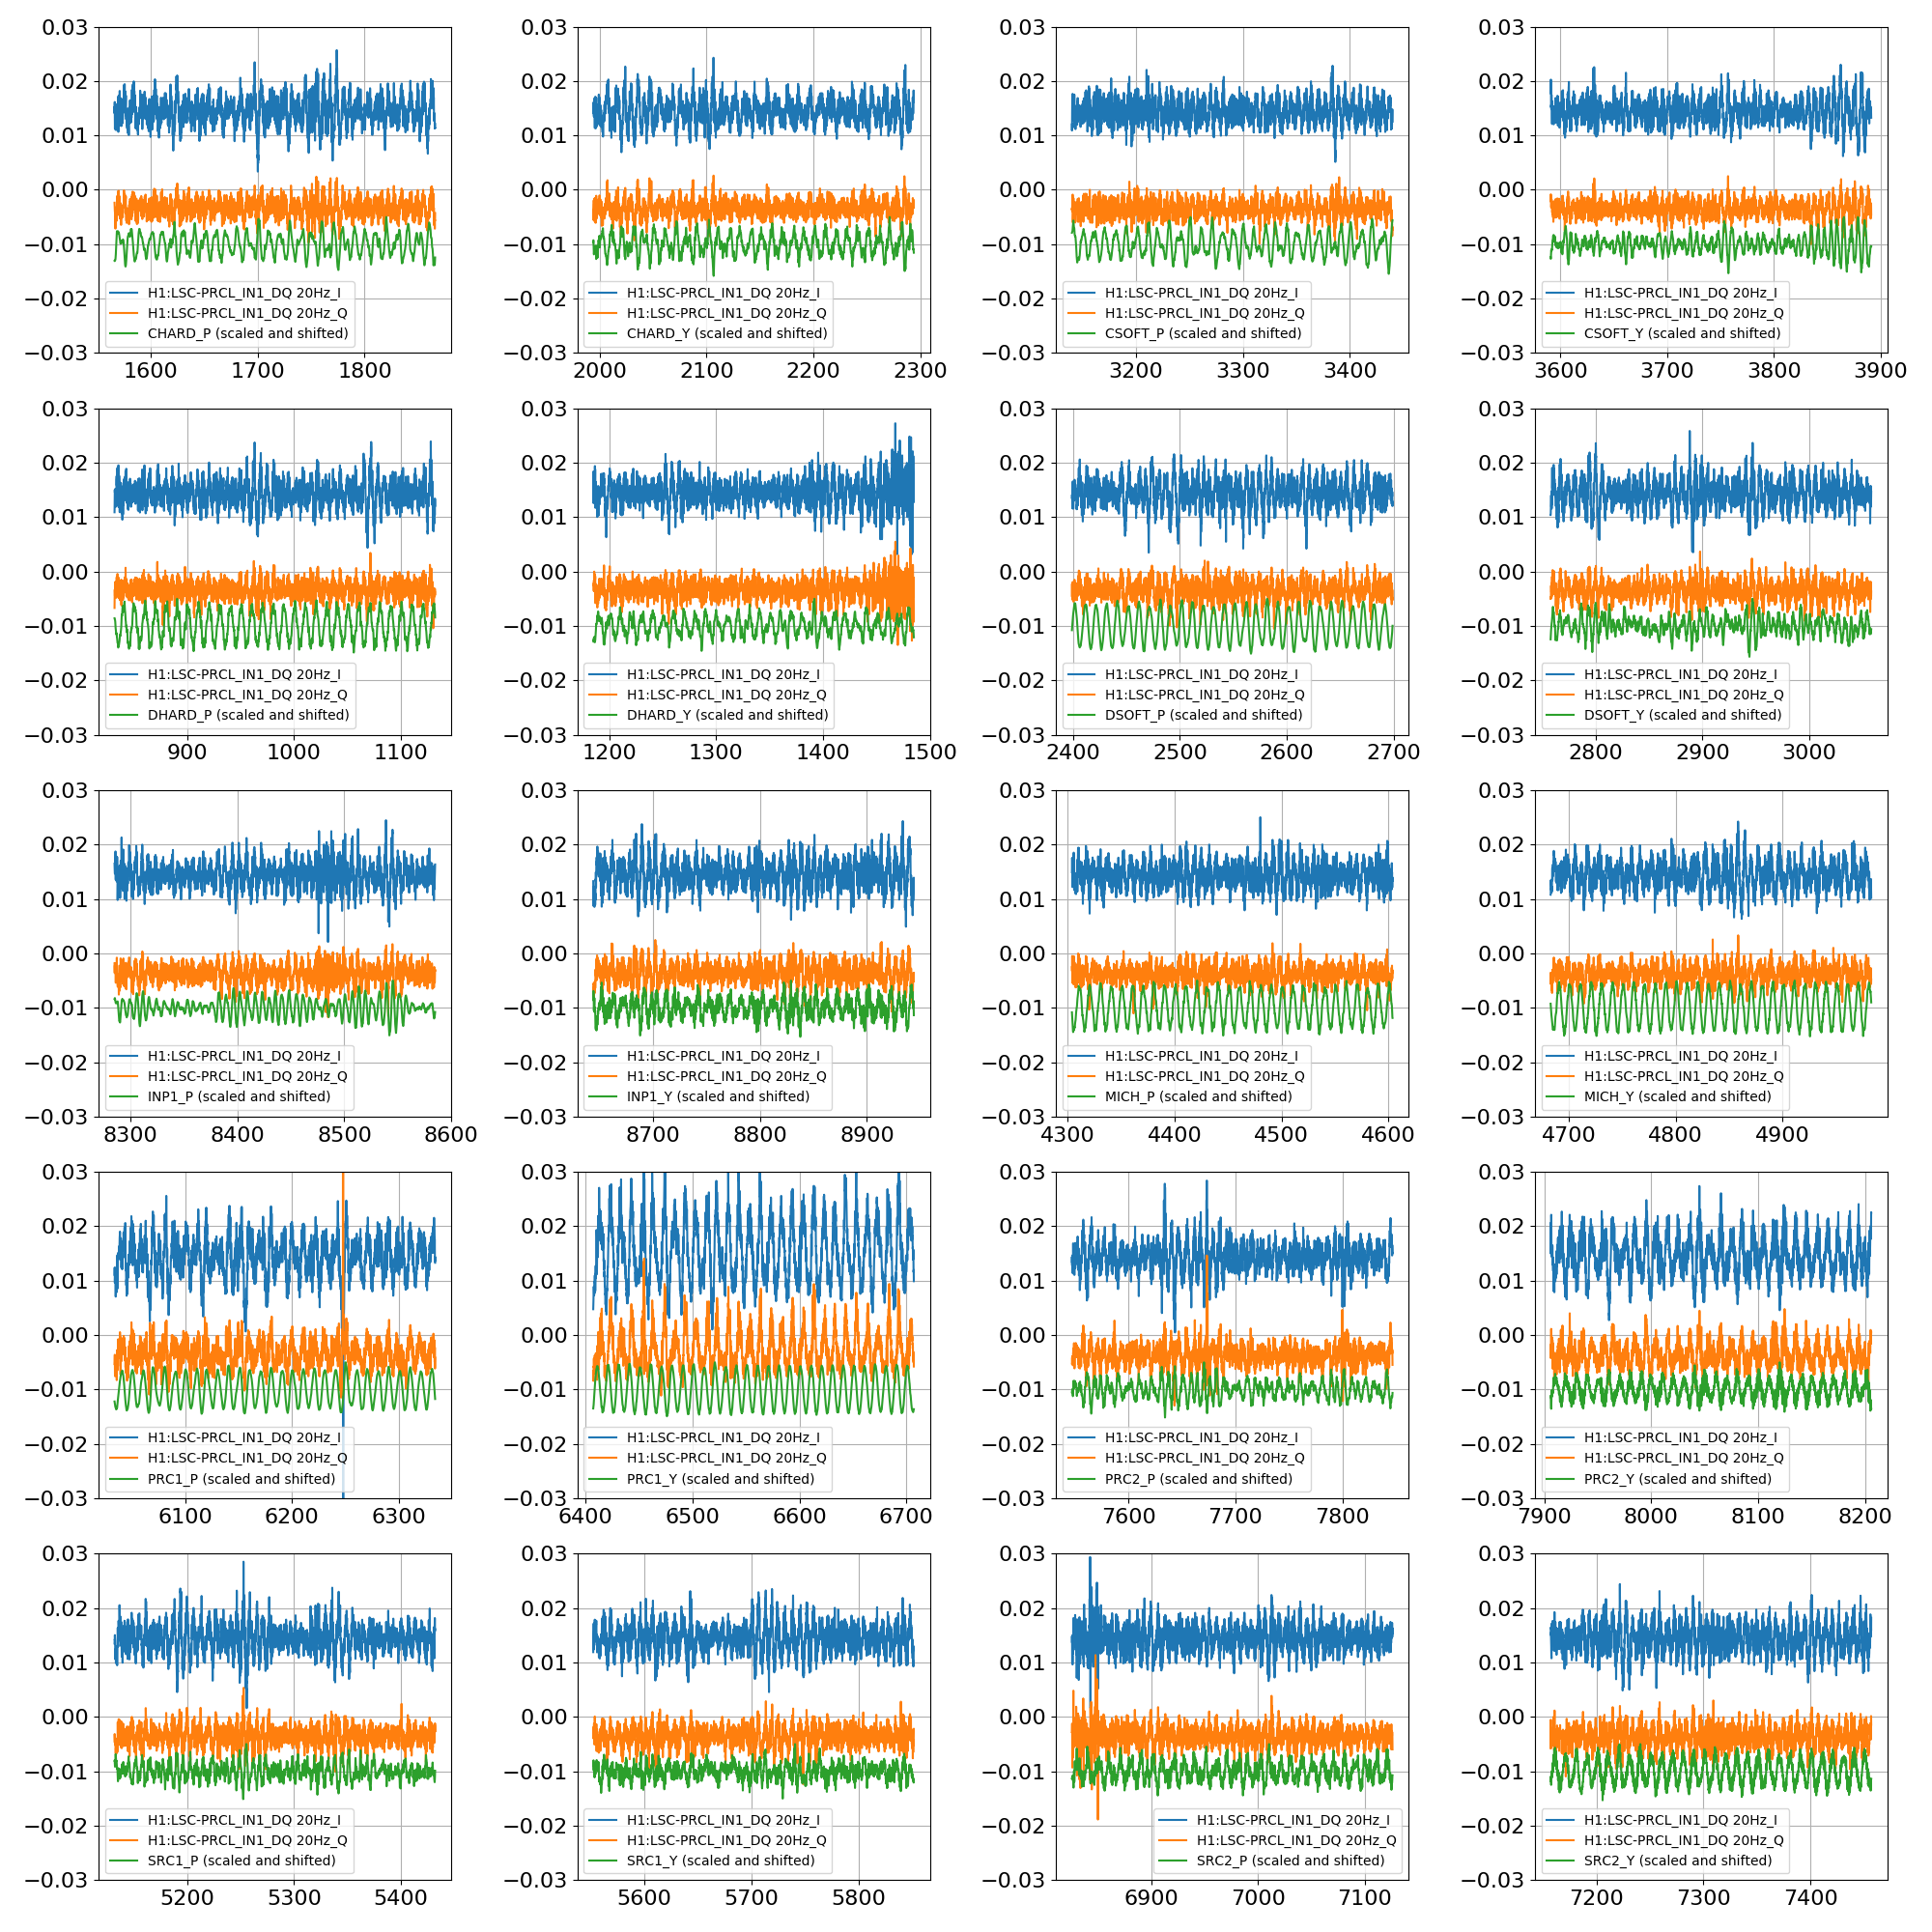
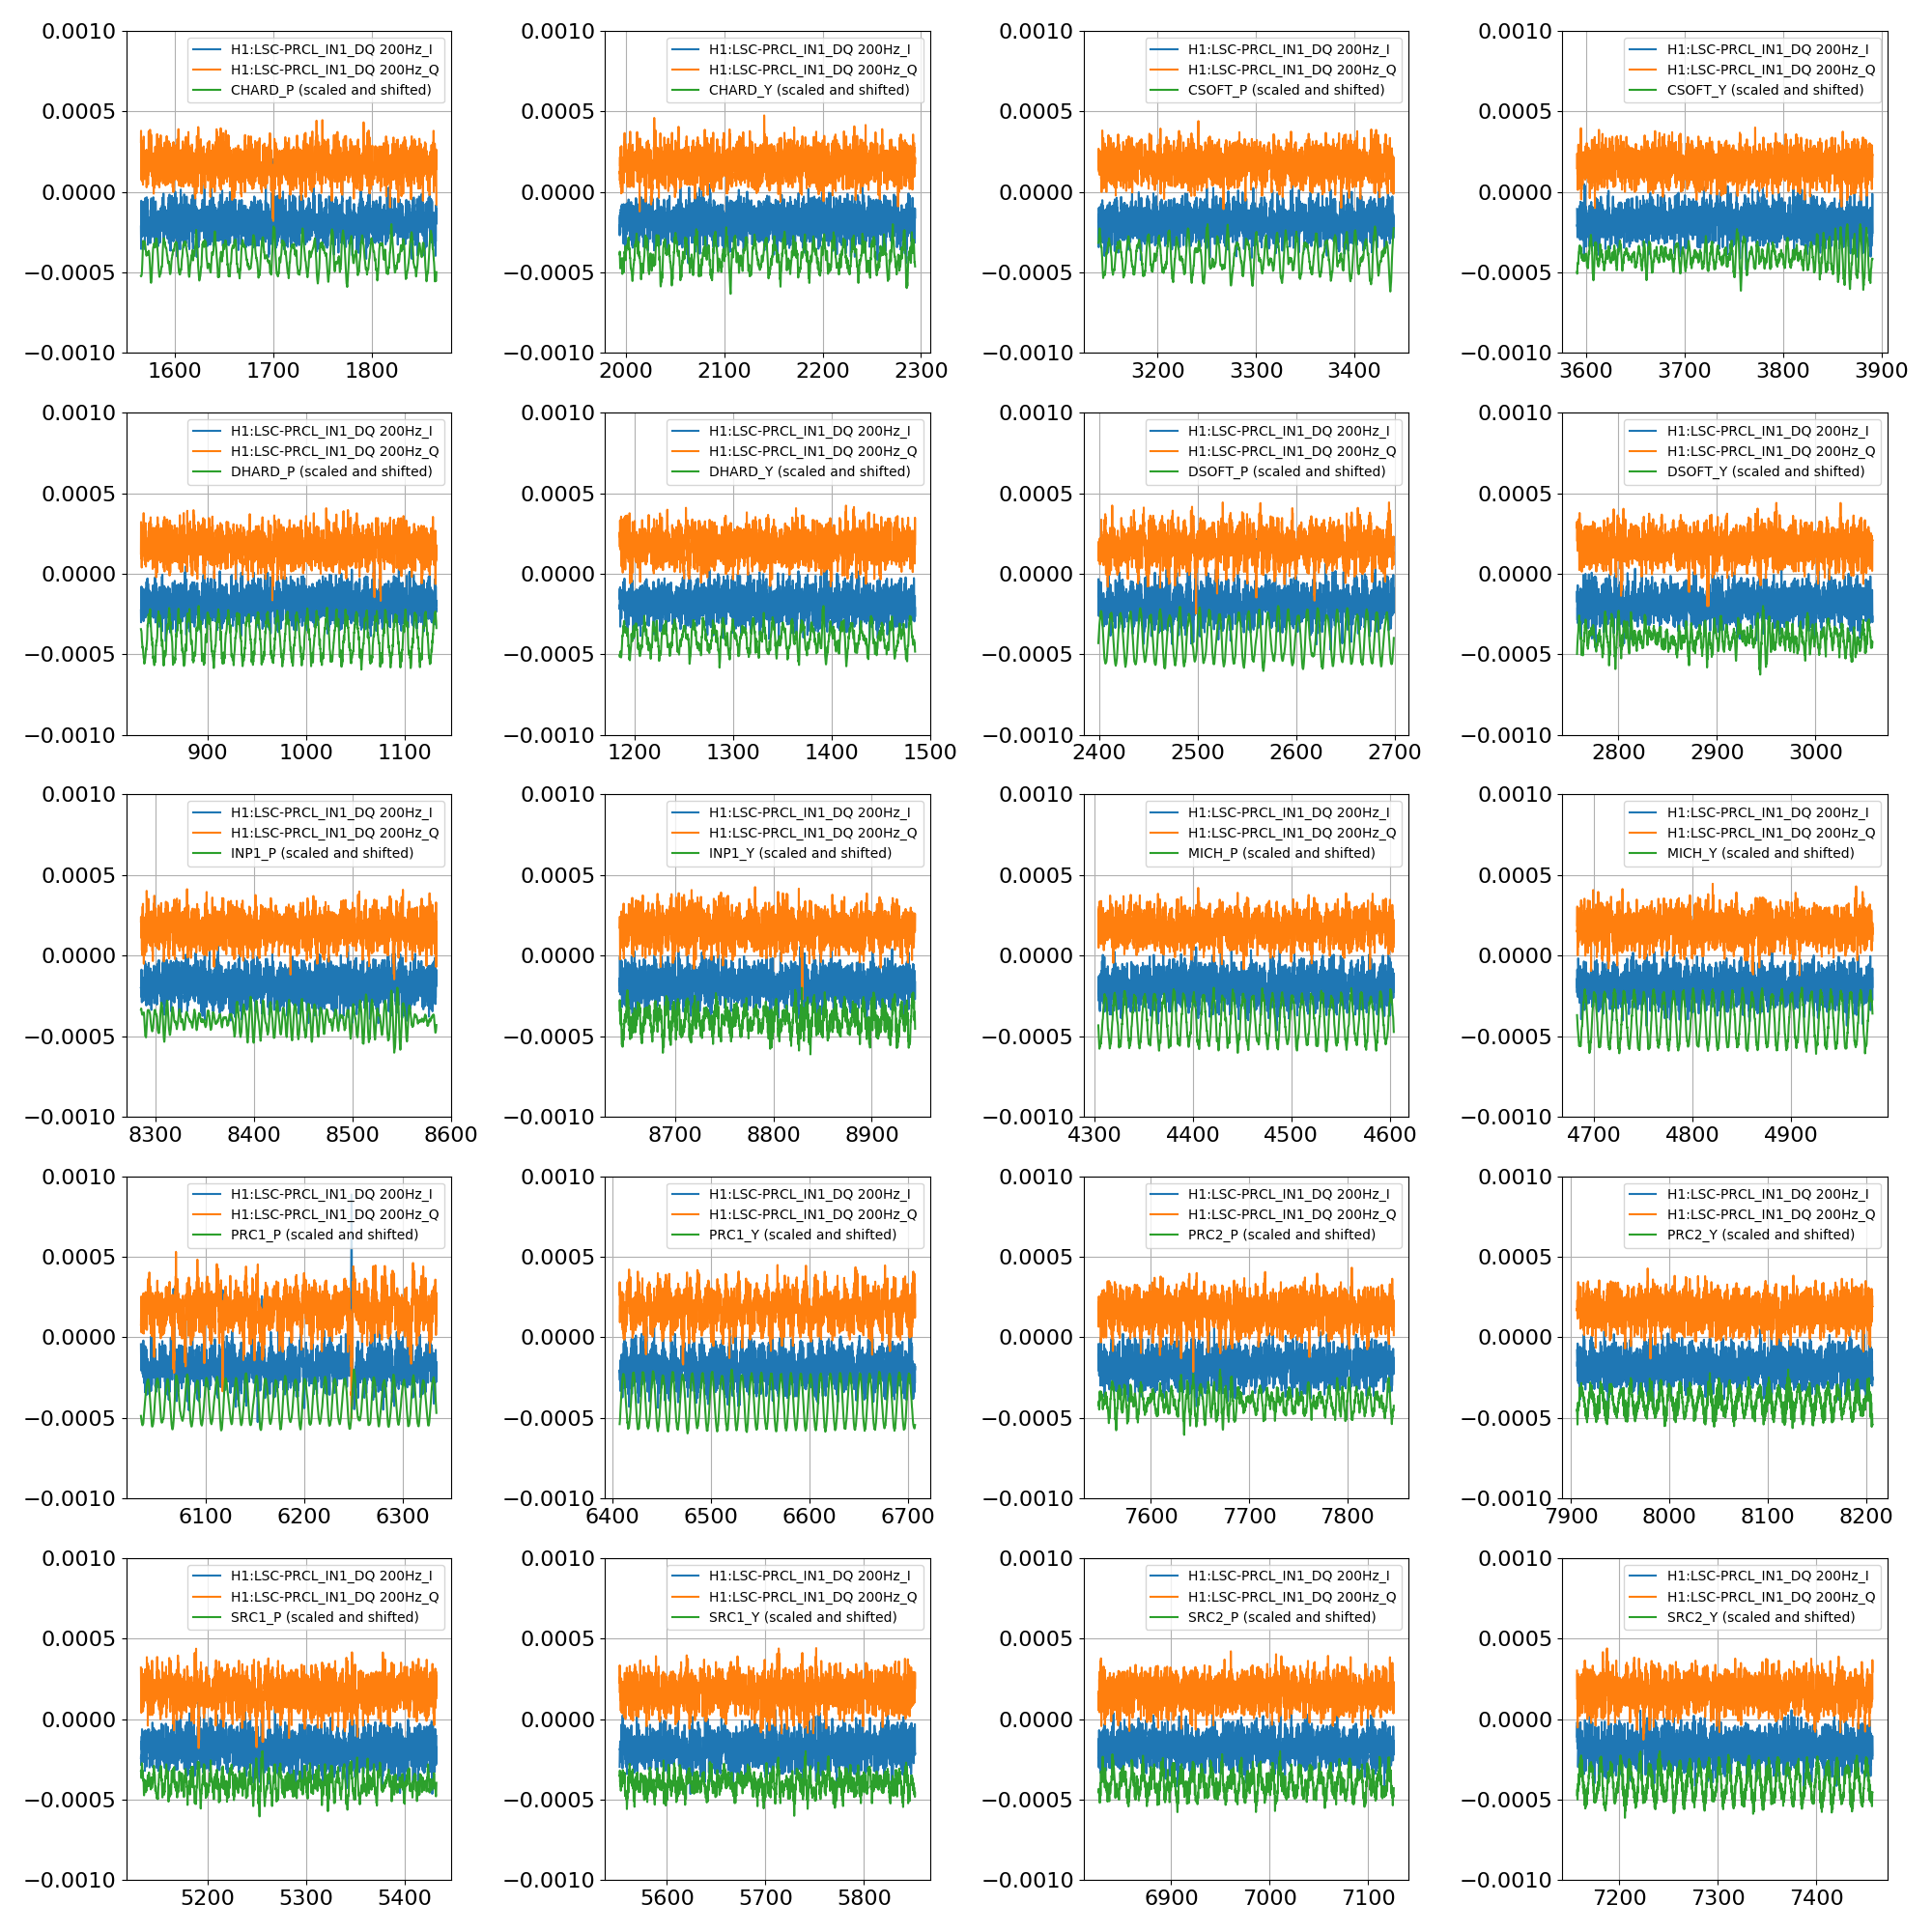
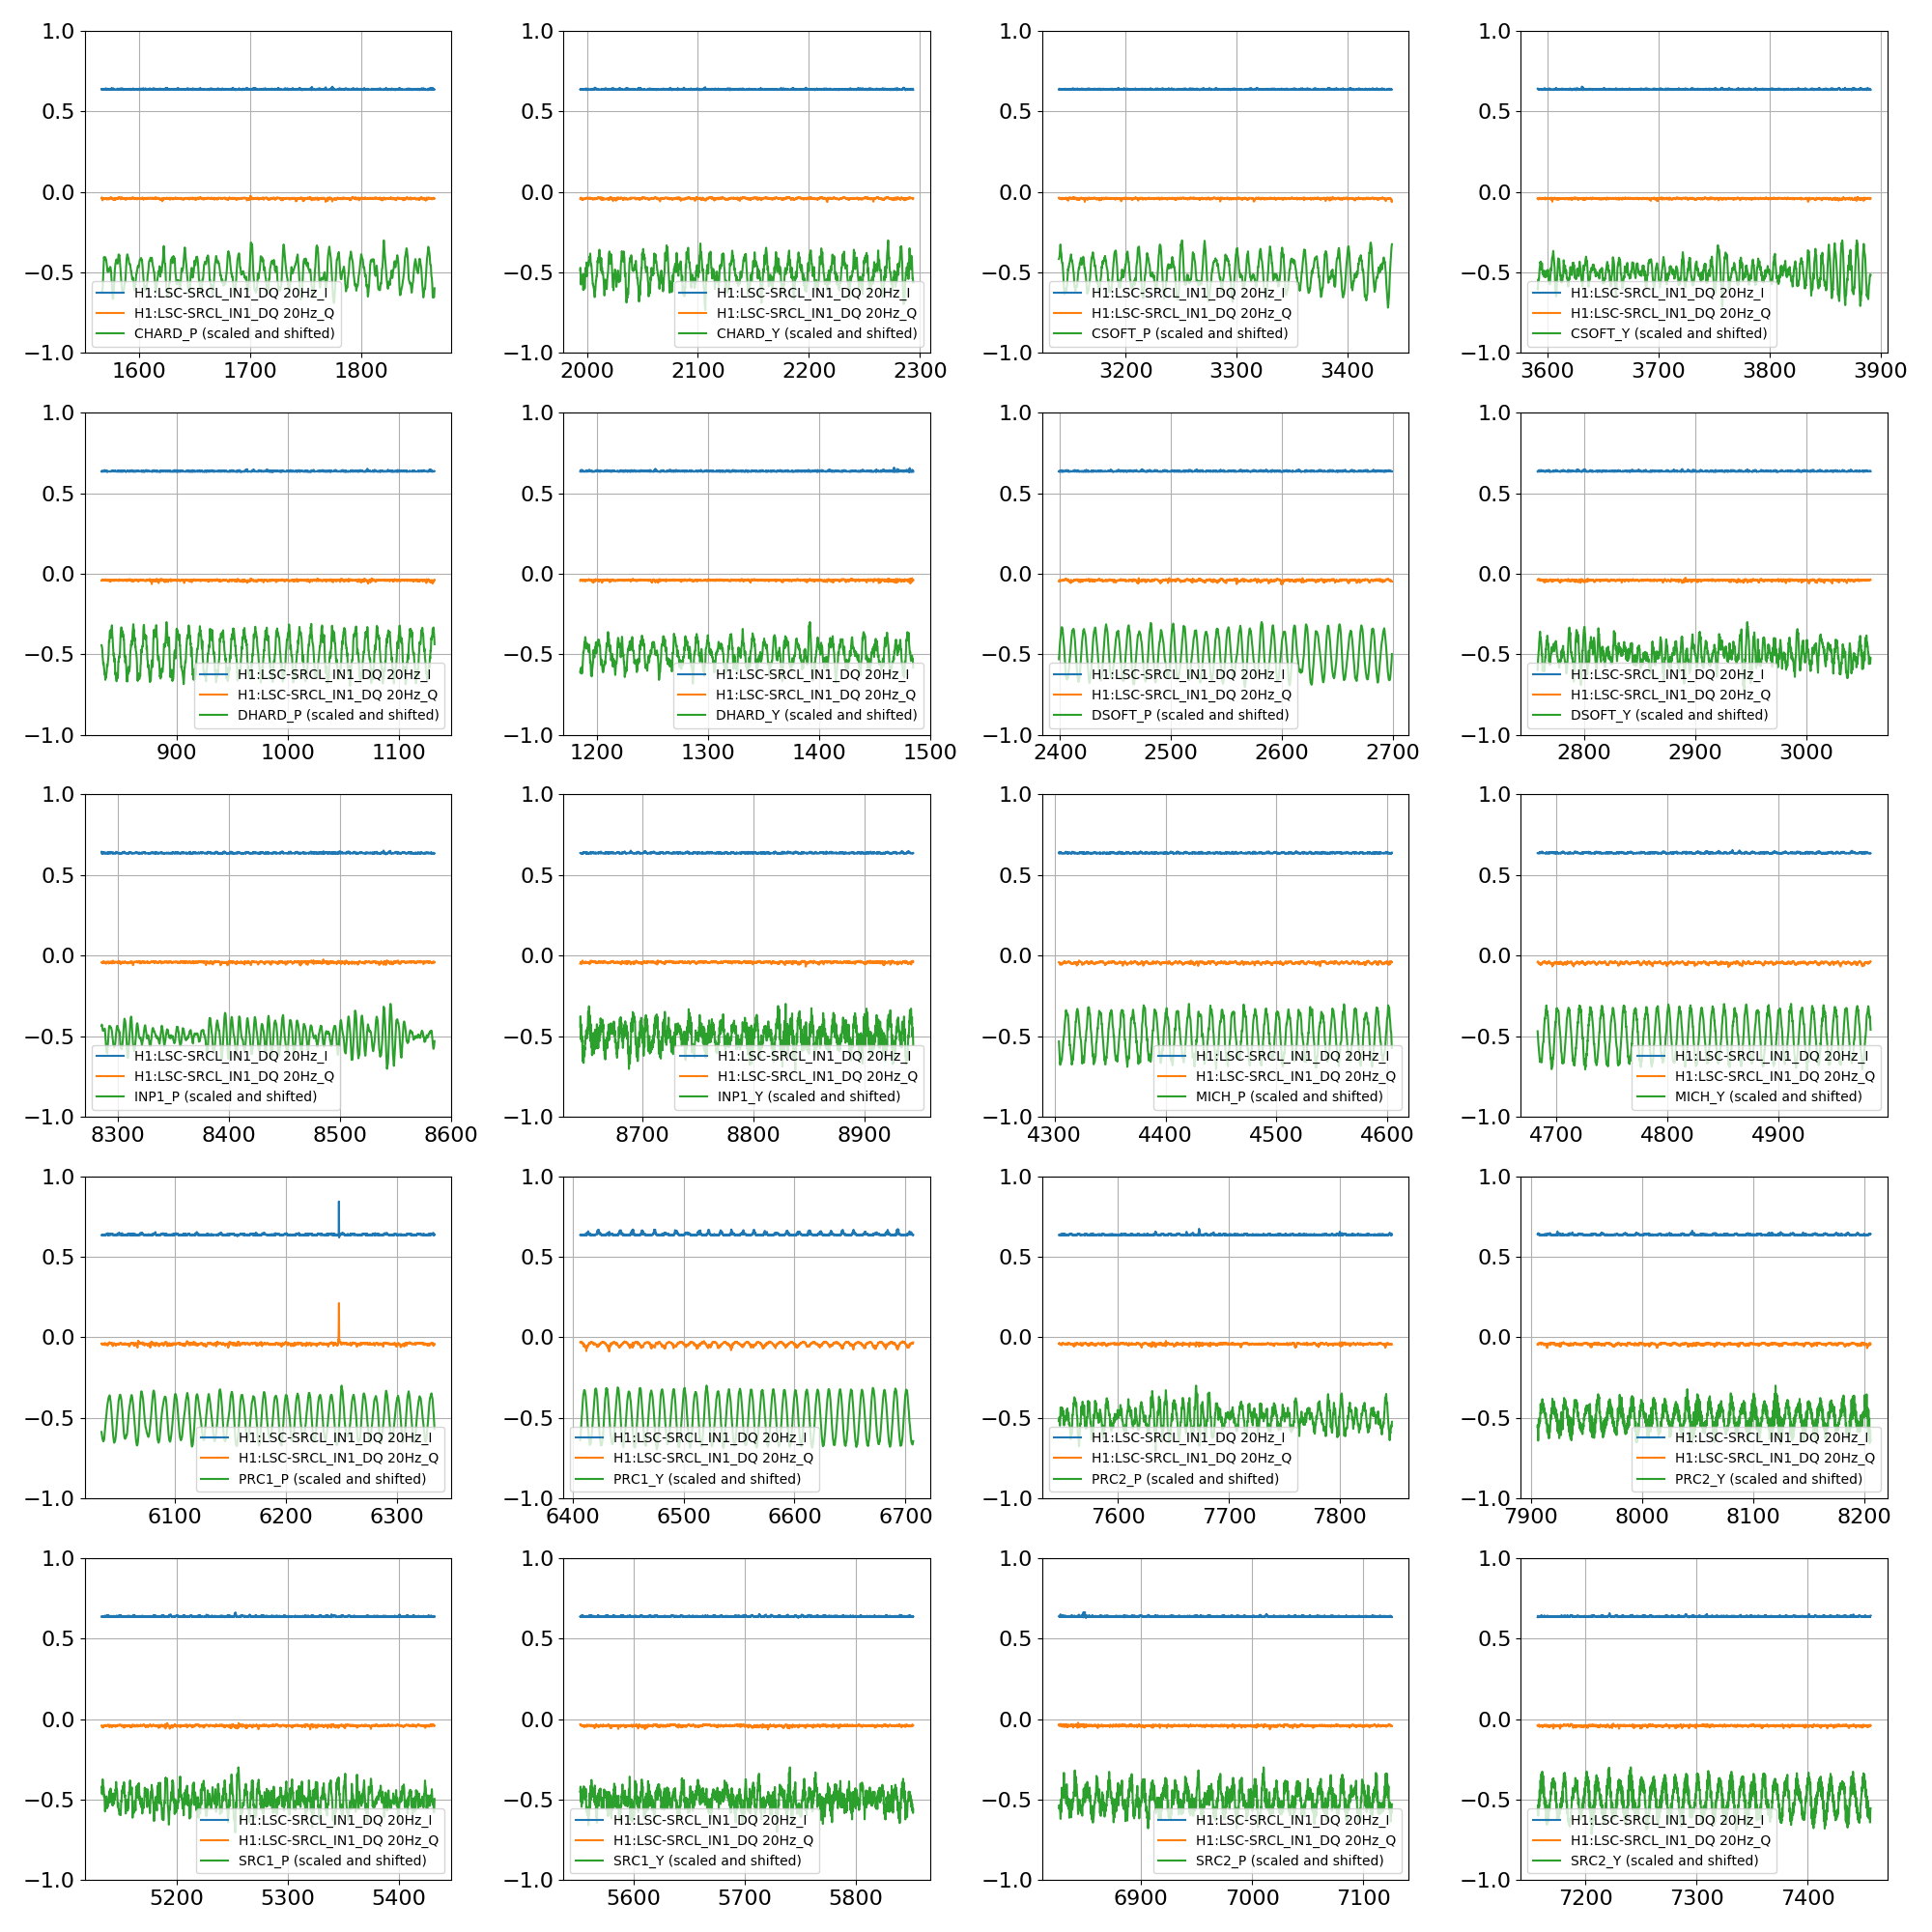
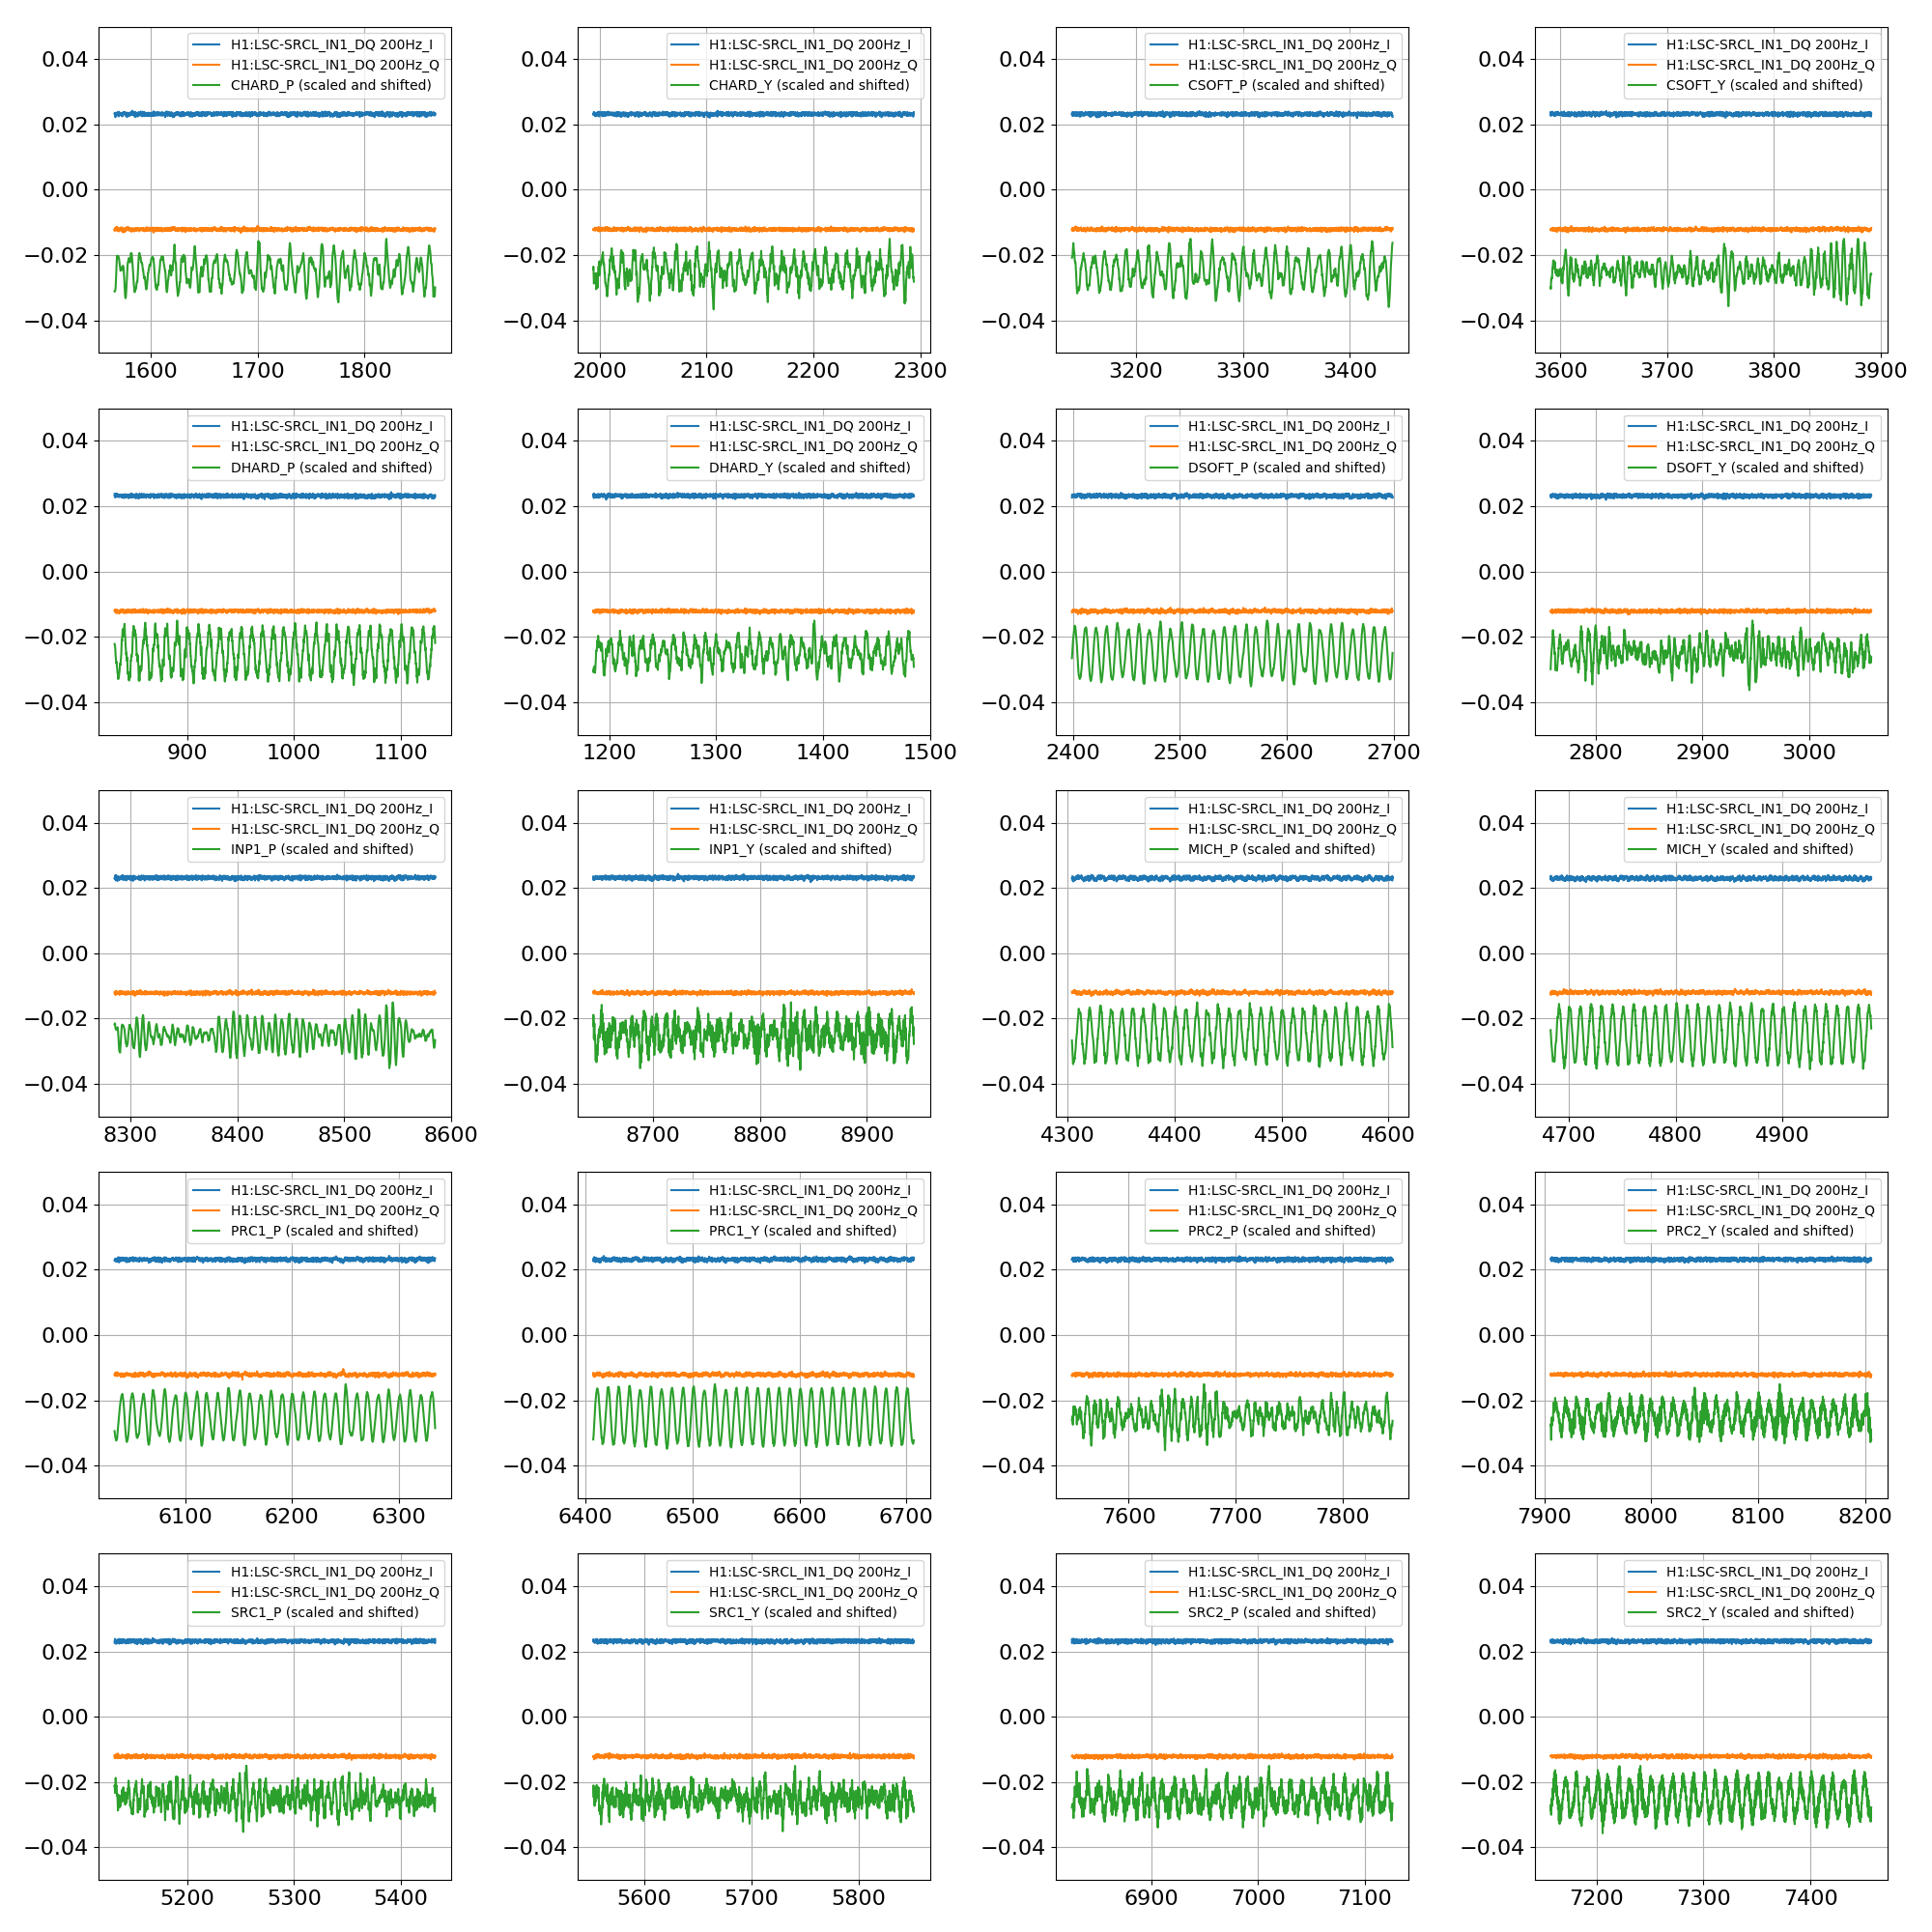
The code is attached as a ipynb

that's good to see. I think its consistent with what we see in the Summary Pages' Rayleigh grams:
On Saturday night, when the microseism was high (~1 um/s) the Rayleigh stat in the 40-100 Hz band shows a lot of red (many non Gaussian outliers).
On Sunday, when the microseism was down to ~0.5 um/s, the Rayleigh gram is mostly white (Gaussian) in this band.

