Sheila, Georgia
We ran a similar to test to what Sheila did last week to check for HAM1 coupling to DARM, but this time on the HAM3 ISI. The coupling of HAM3 ISI motion to the length degrees of freedom is significant, and is possibly the limiting noise source for PRCL around 30-40 Hz. We're not sure yet whether this coupling is due to clipping or backscatter or something else.
---
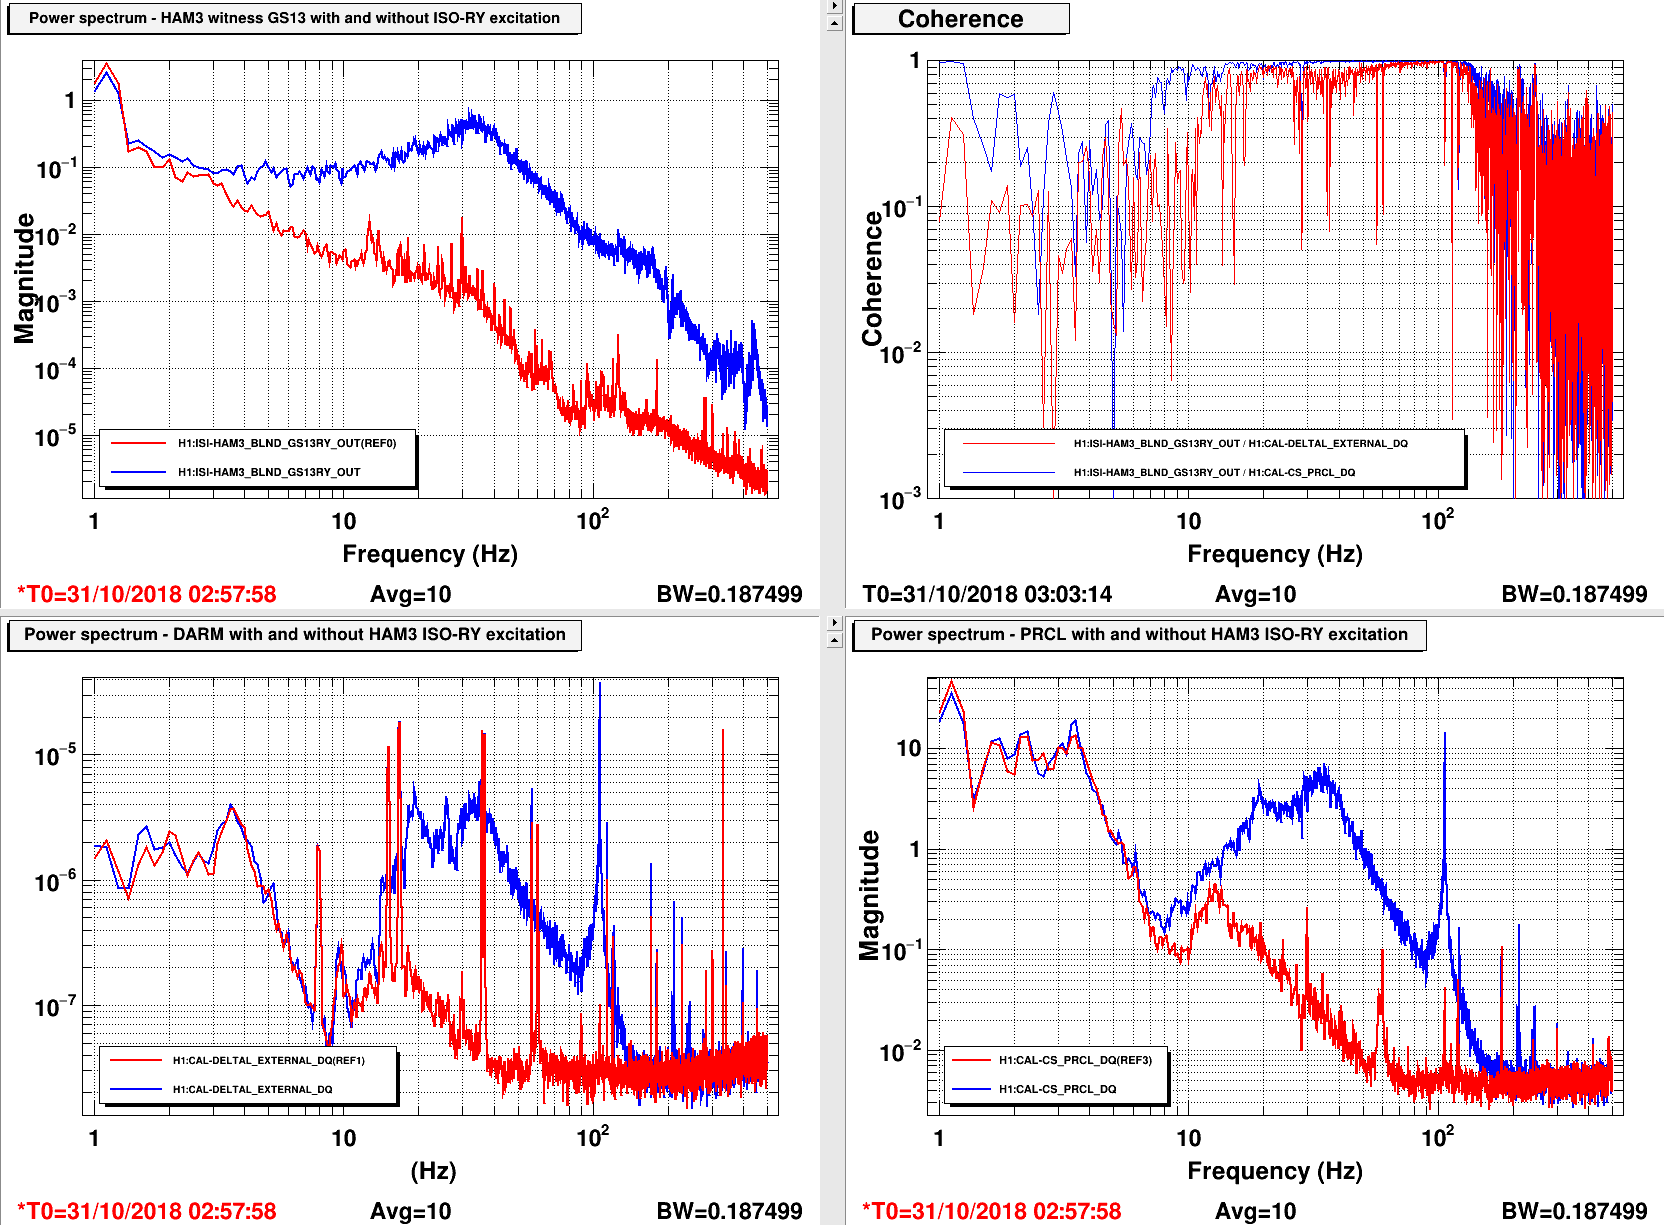
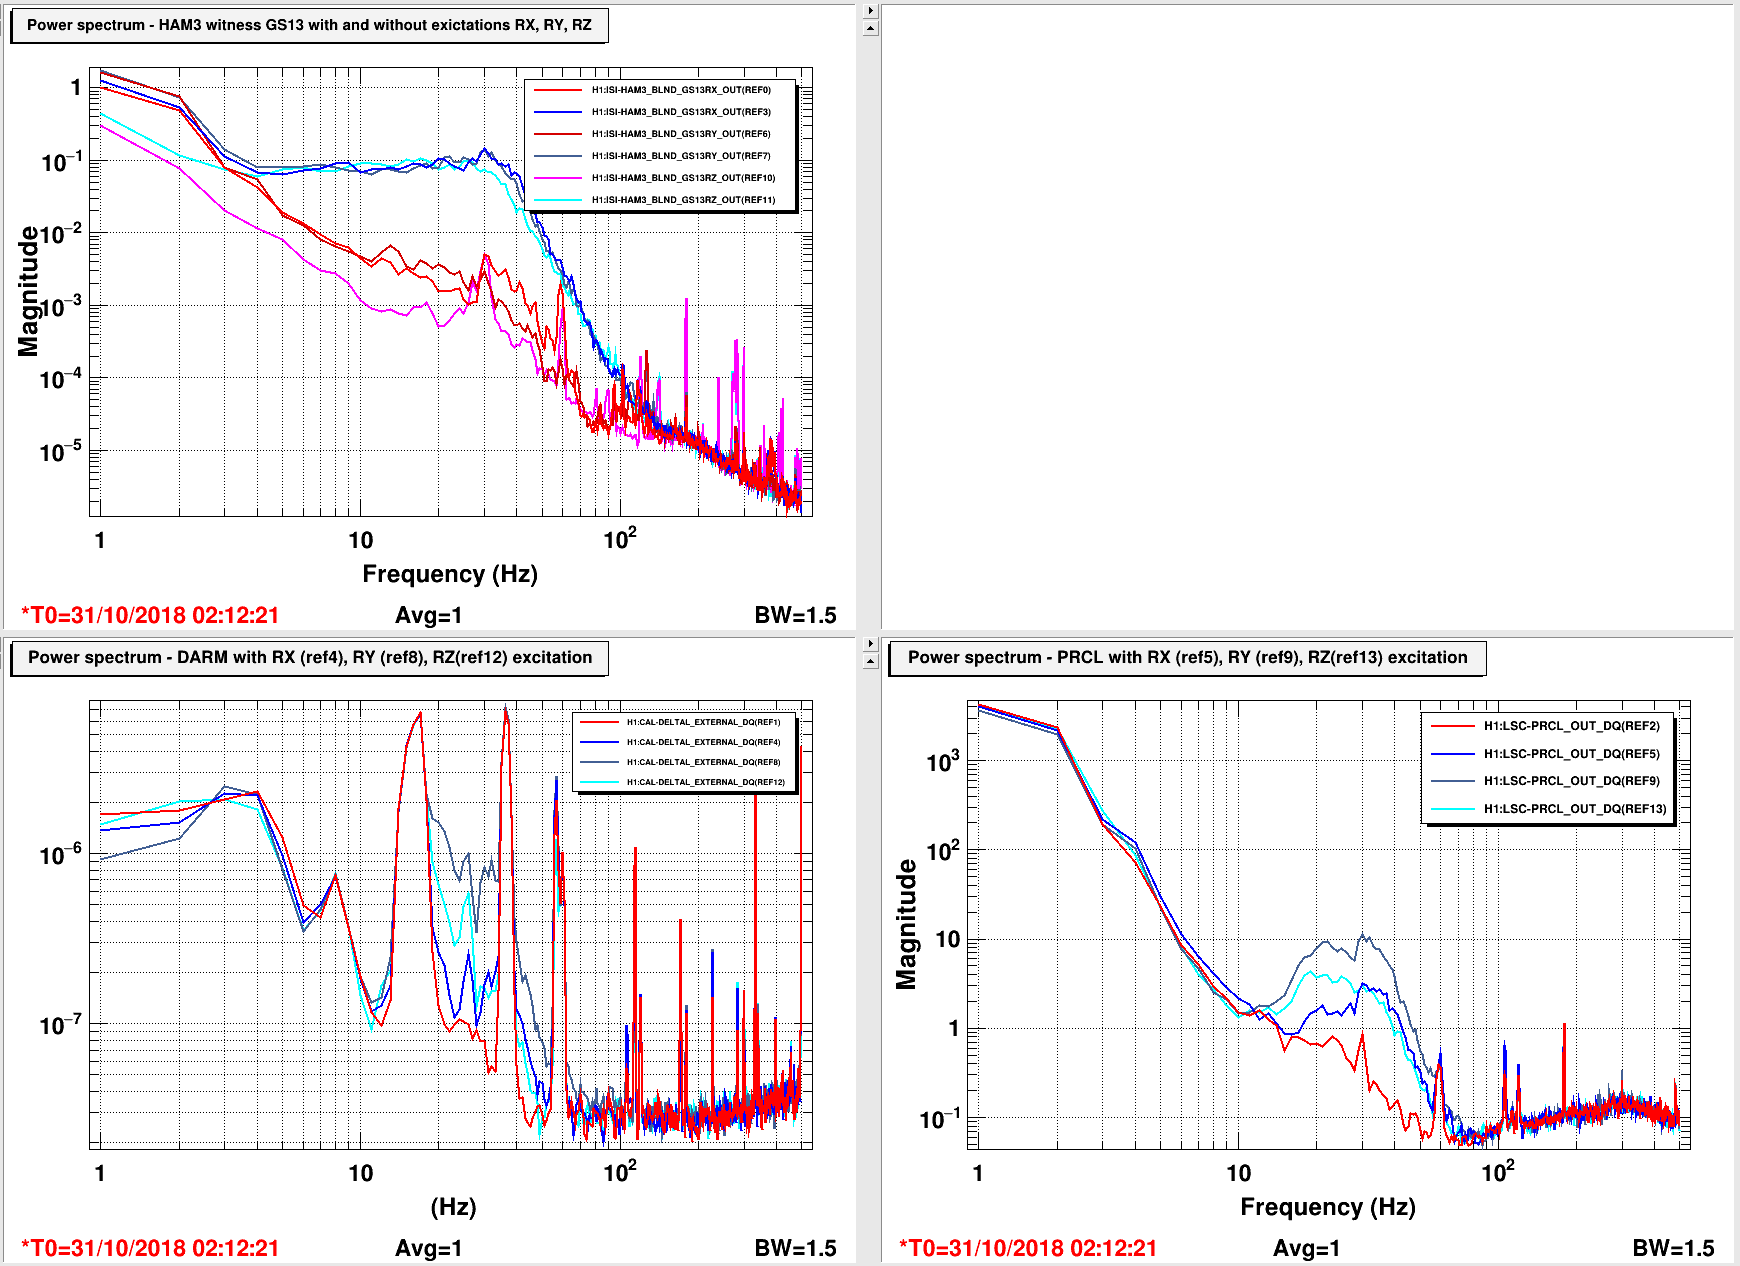
We ran a band-limited white noise excitation to the RX RY and RZ degrees of freedom at the ST1-ISO stage of the ISI. The excitations had ~2 orders of magnitude clearance over the ambient noise of the GS13 blend signal, which we used as a witness sensor. The coupling was seen when driving RX RY and RZ, but most strongly for RY. The driven noise was seen in MICH, PRCL, SRCL, and DARM.
The first attachment shows RY GS13 signal with and without the excitation (top left), showing the magnitude and frequency of the excitation; DARM noise (bottom left); PRCL noise (bottom right); and coherence between DARM and the GS13 signal, and PRCL and the GS13 signal (top right). I'm not 100% sure, but I think the peak just above 100Hz was unrelated to the excitation.
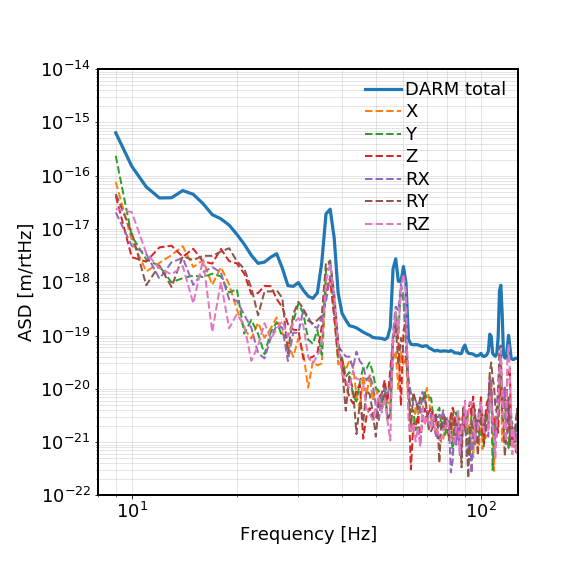
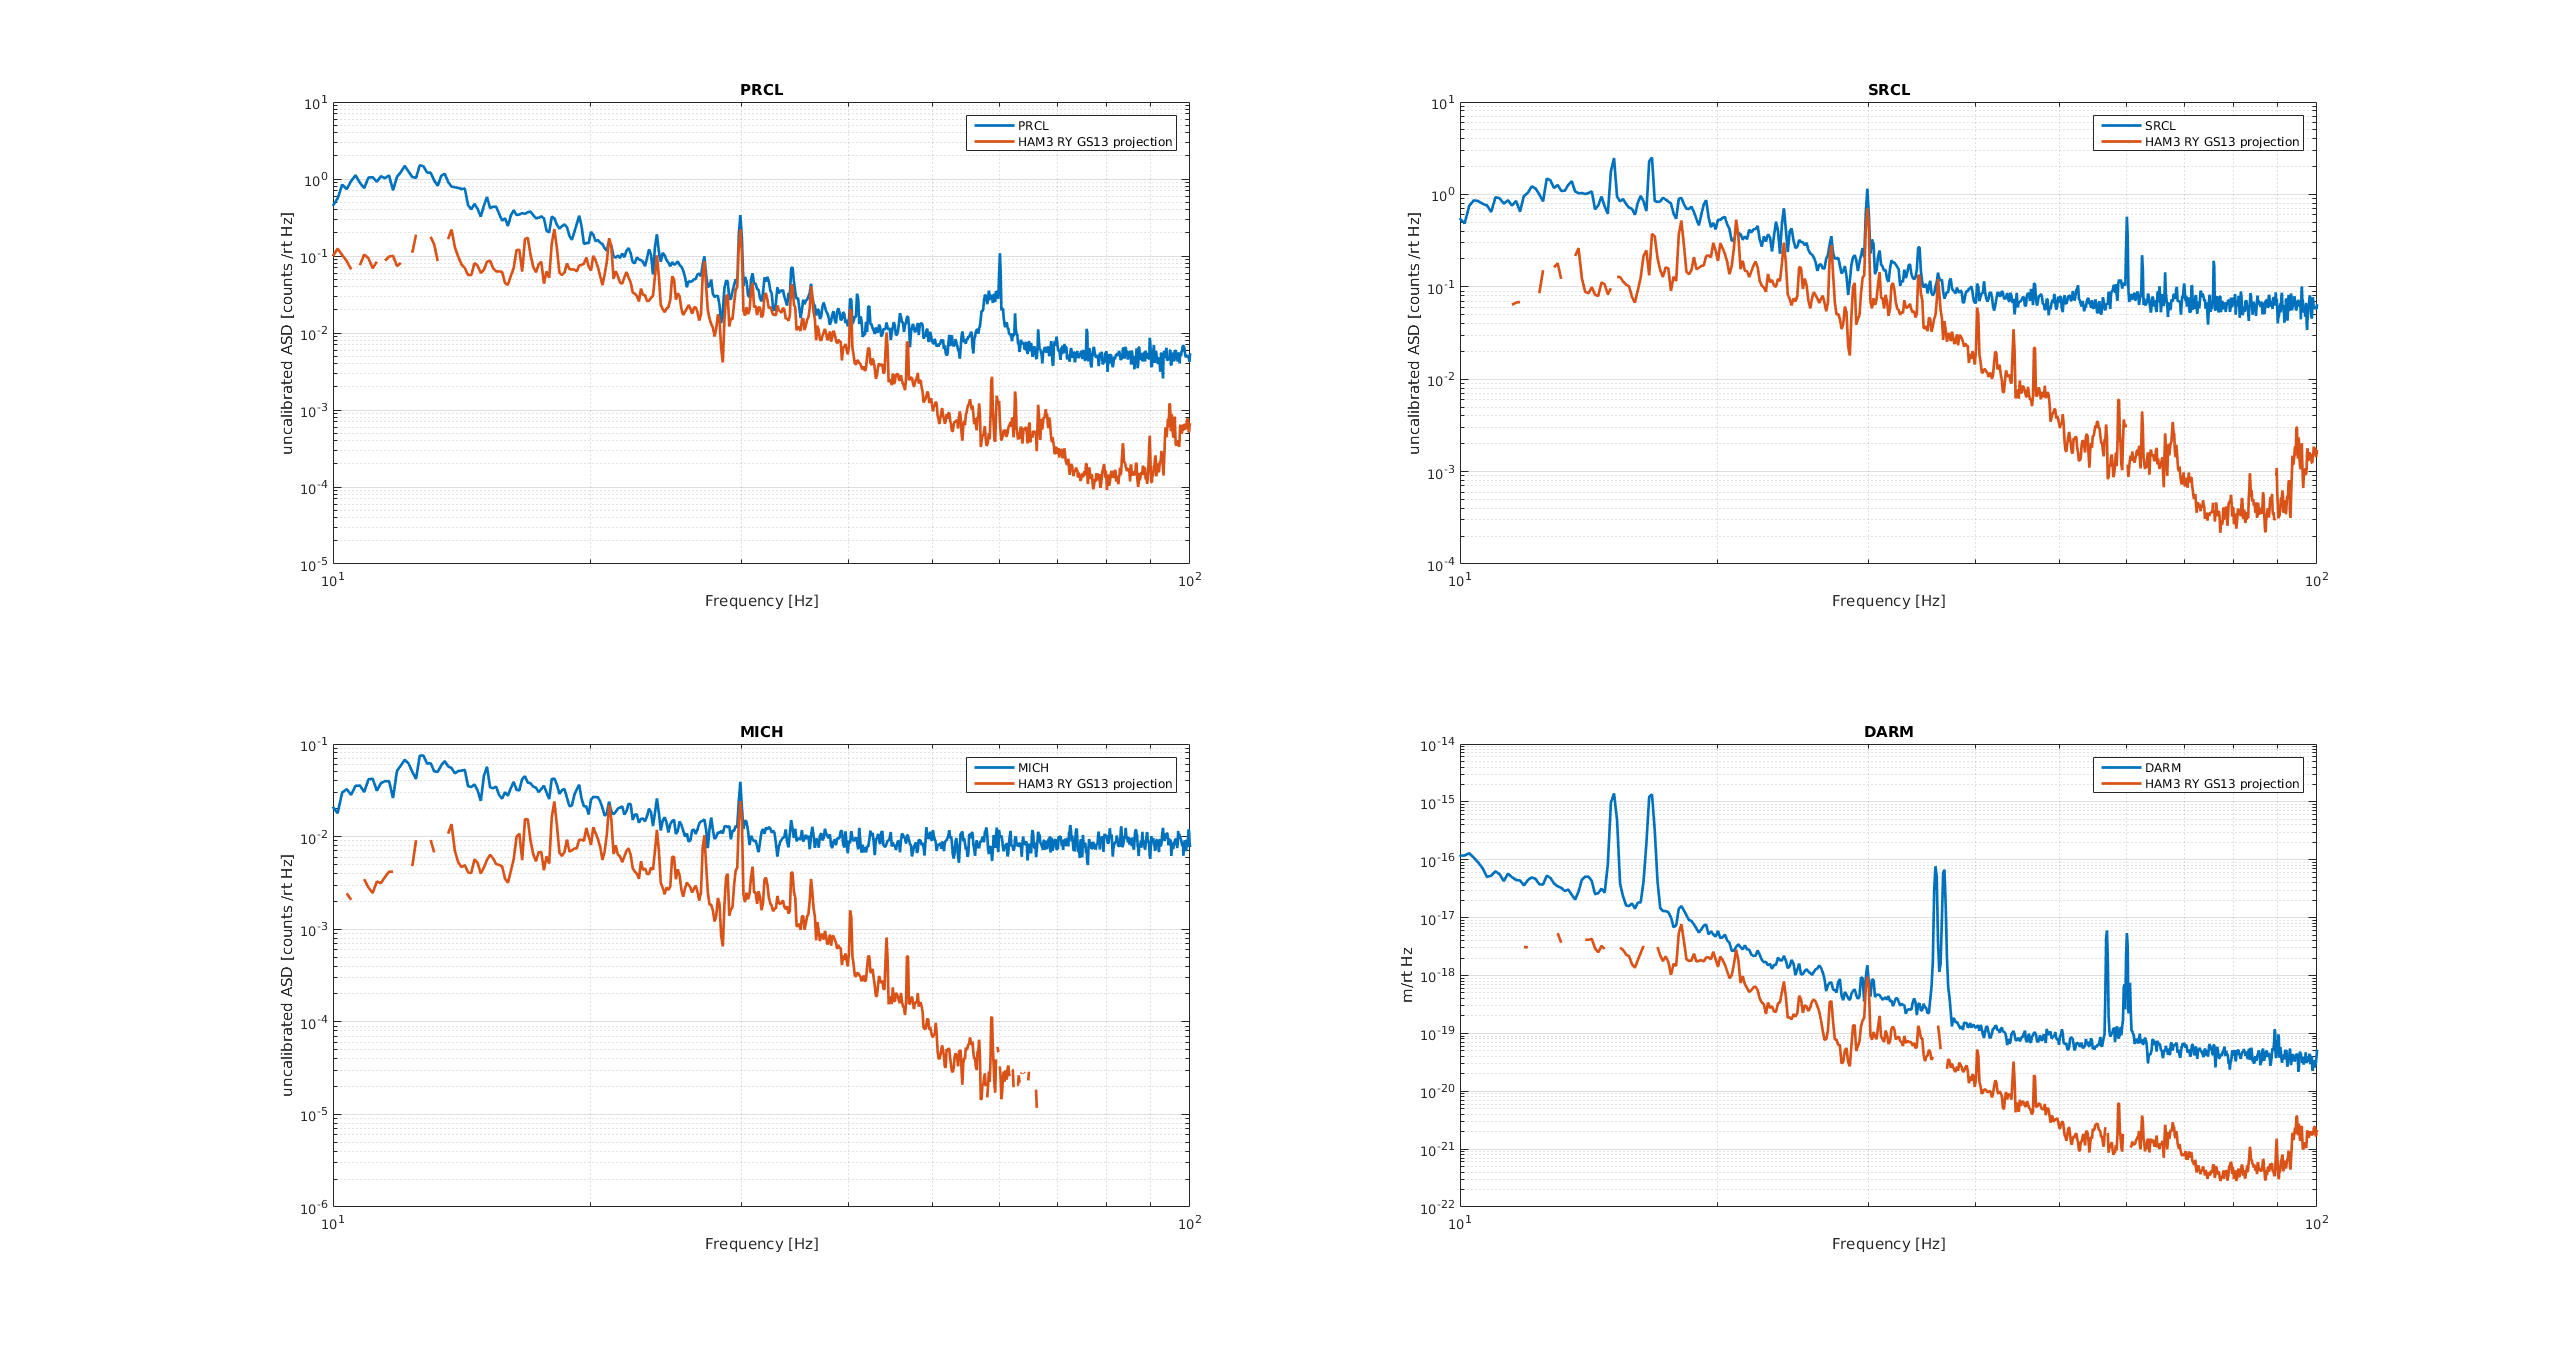
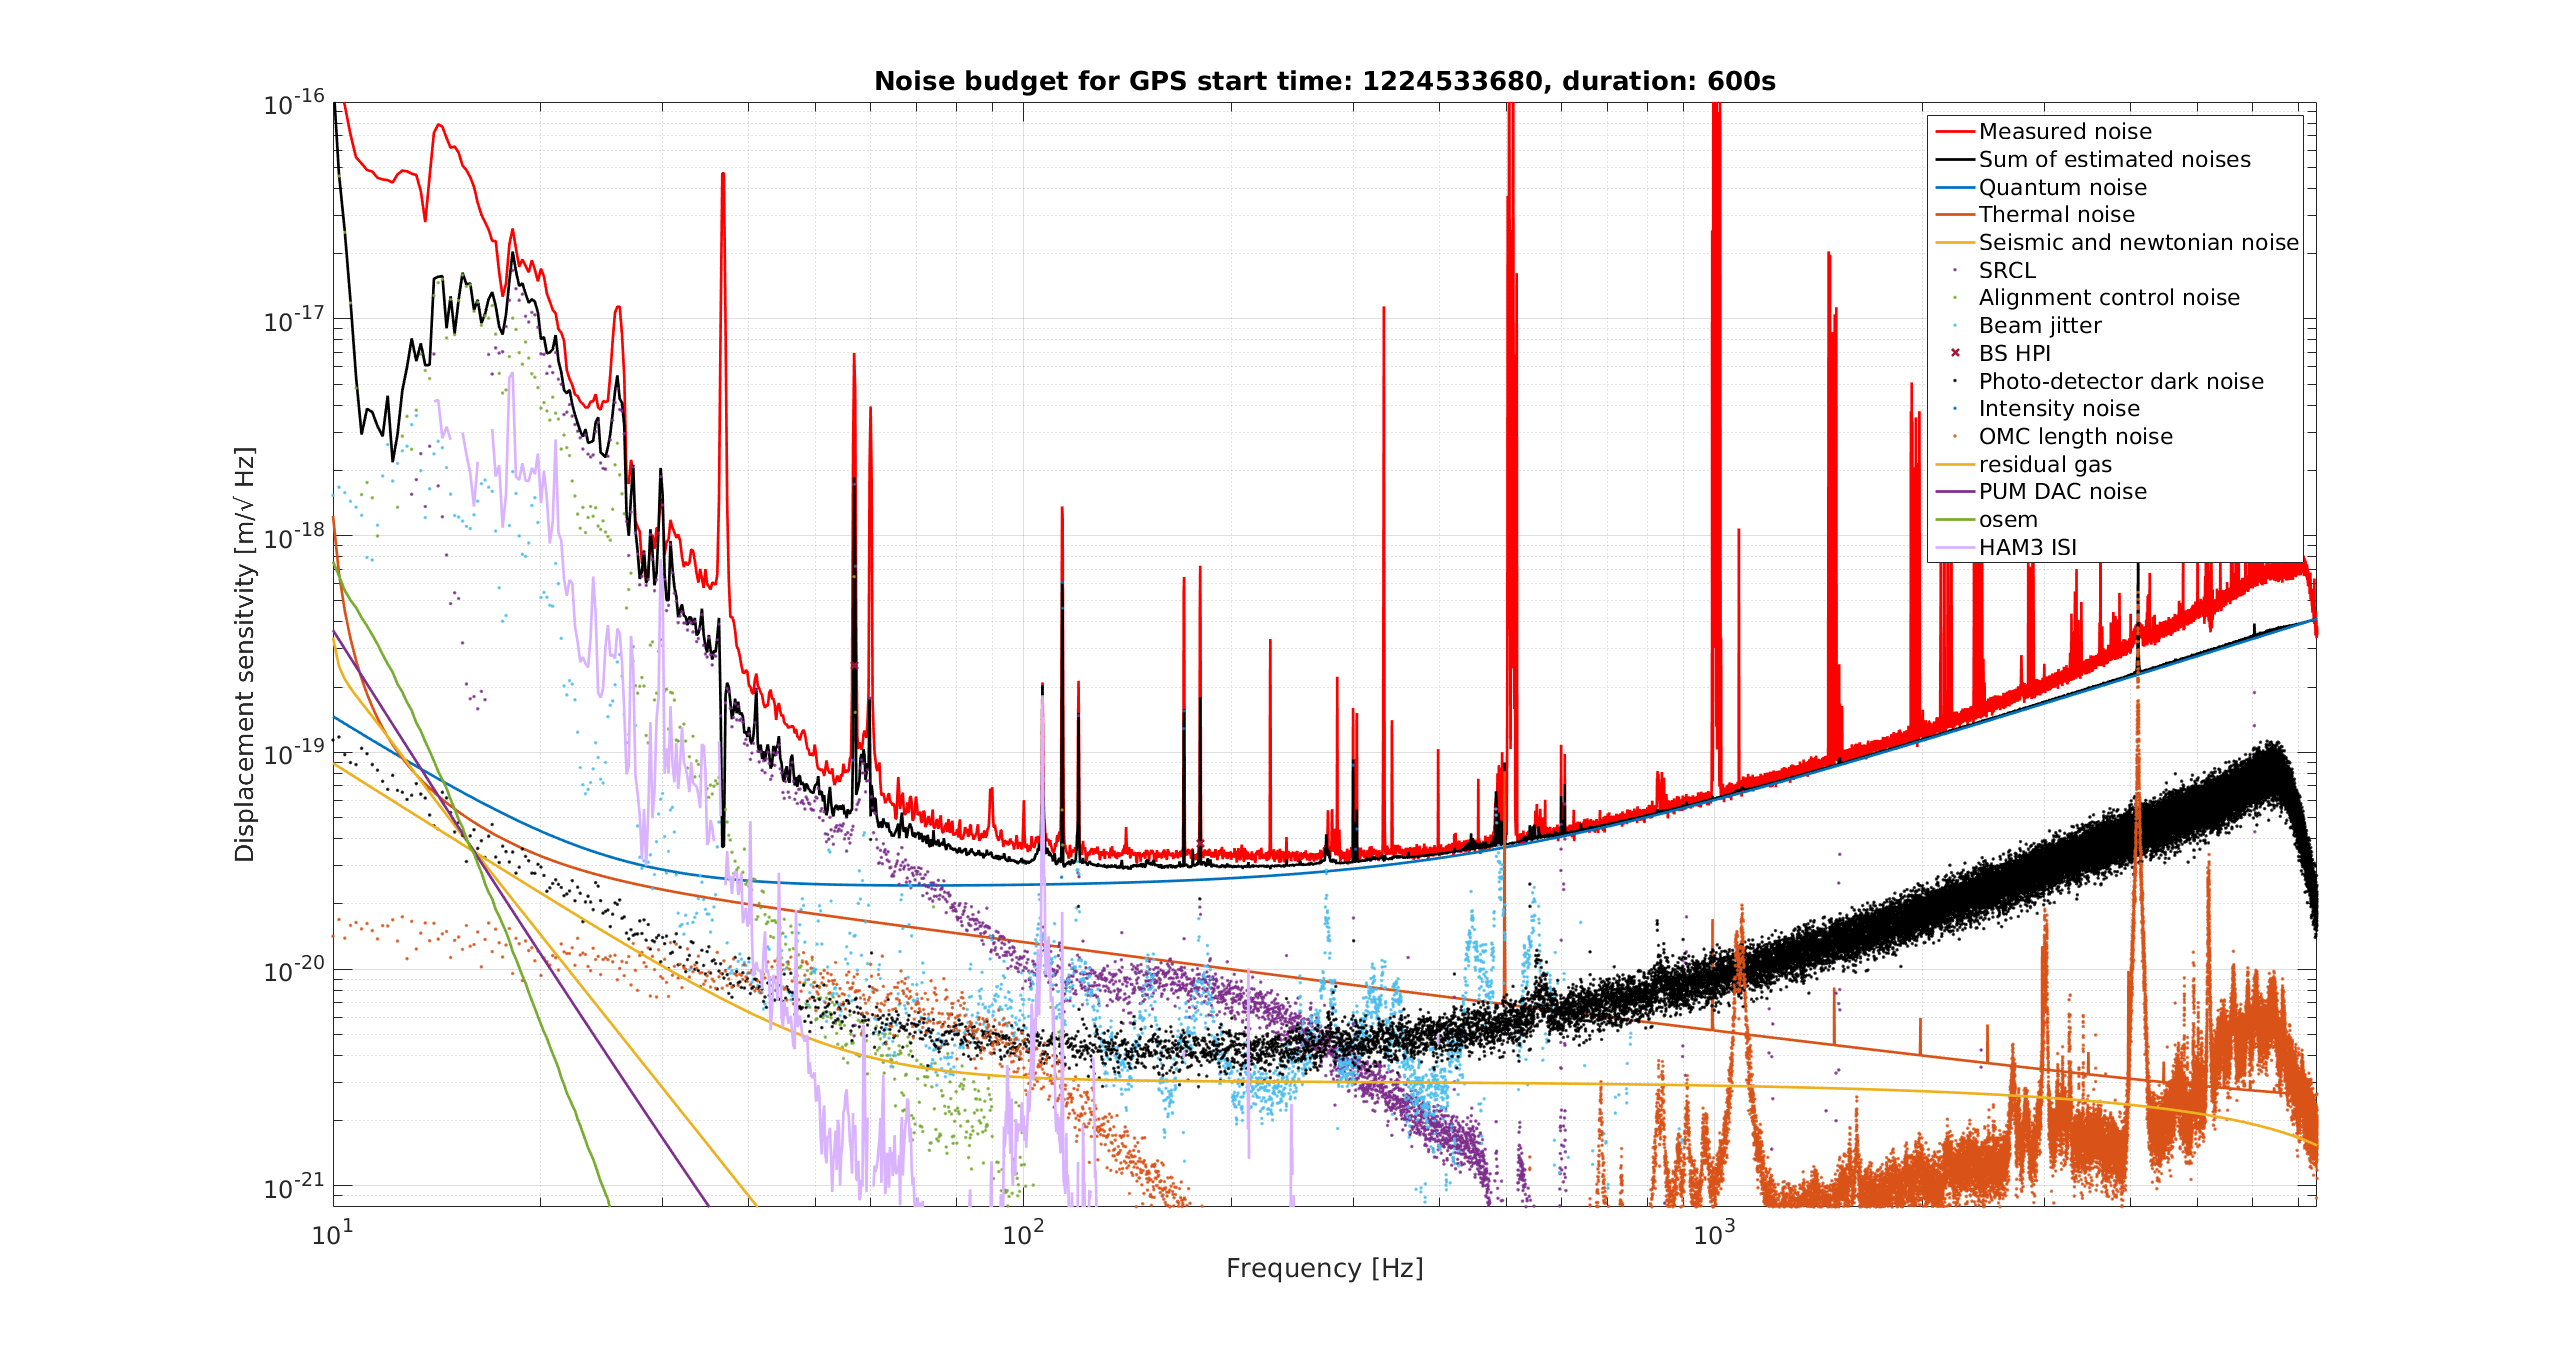
I used Sheila's noise projection script to project the ambient HAM3-ISI noise into DARM, SRCL, MICH, and PRCL, (attachment 2), the noise projected into PRCL is uncomfortably close to the actual PRCL noise. For fun we also added this to the noise budget (attachment 3).
Attachment 4 shows the result of similar drives to RX RY and RZ, with the coupling to DARM and PRCL, showing the largest coupling for RY.
We did a similar test on HAM2 ISI RX, and did not see significant coupling to DARM or PRCL, but we didn't try driving the other degrees of freedom.
Georgia, Sheila -
FWIW, there are some channels you can use which are probably simpler. You probably know this, already, but I'll put it here in case a Fellow or someone from Detchar is able to help you out. The Blend input calibration is useful for debugging control, but to look at the motion, it is simpler to use the Calibrated Cartesian channels:
H1:ISI-chamber_CAL_CART_dof_OUT_DQ,
eg, 'H1:ISI-HAM3_CAL_CART_X_OUT_DQ' or 'H1:ISI-HAM3_CAL_CART_RY_OUT_DQ'.
These are the same GS-13 signals, but are calibrated as 1 nm/count at frequencies above 10 mHz.
Details of the low frequency rolloff are in LHO aLog 4553.
These are used to make the Suspension point motions for each optic, eg 'H1:ISI-HAM3_SUSPOINT_PR2_EUL_L_DQ' (see T1100617)
These SusPoint channels are then used to make the IFO-basis version of the relative motion at the top of the suspensions (see T1500610),
eg. 'H1:OAF-SUSPOINT_PRCL_OUT_DQ'. In the ongoing OAF model cleaning/ reorg, these names may have been updated, Jeff K knows all, and put much of it into G18001962.
PS It's odd that Ham3 - RX has such a large coupling.
Associated with FRS Ticket 11740.
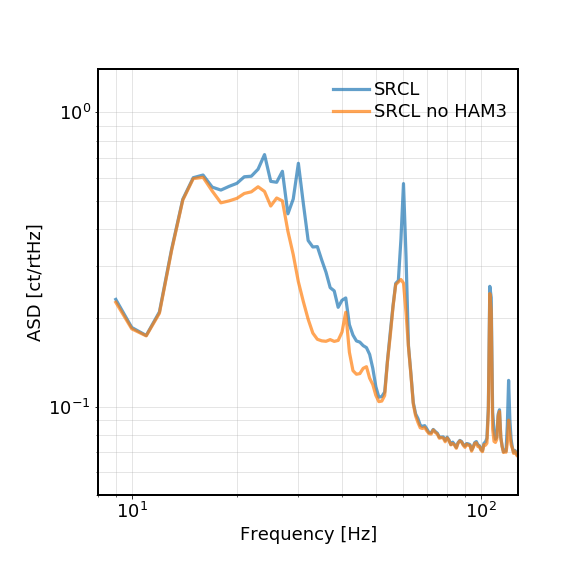
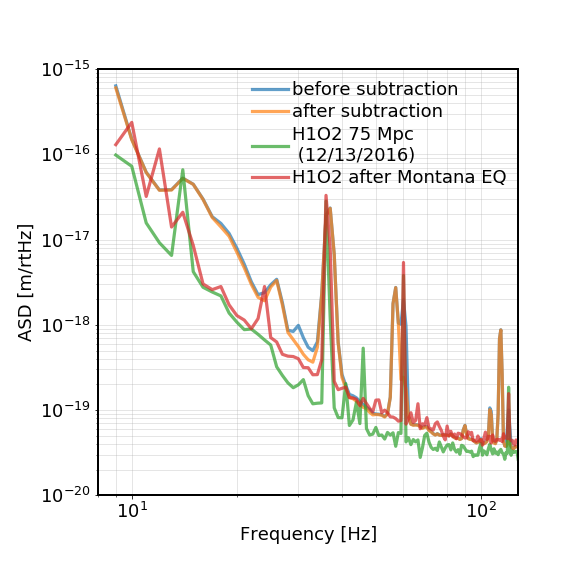
We also looked at the HAM3 coupling using the MISO coherence method. This method takes the correlations between different HAM3 channels into account when doing the projection and thus allows us to see the total HAM3 noise projection. On the other hand, the coherence only captures the linear part of the coupling. If the noise is mostly from scattering, and the relative motion is on the order of um, then we could not see the coherence due to the loss of linearity.
In the first plot we show how much does the HAM3 motion projects to SRCL. The blue trace was the total uncalibrated SRCL and the orange one is the HAM3 MISO coherence removed. This seemed to be consistent with the excess power projection that the HAM3 motion is mostly significant in the 20-50 Hz band but not much above 50 Hz.
In the second plot we show how different HAM3 dofs projects to SRCL.
In the third and forth plots is the HAM3 projection to DARM. We only saw a small amount of difference based on the linear coherence. However, if it is scattering we might not be able to capture a complete picture from linear analysis alone.