We turned off the vertical isolation loops and the line went away from the raw CPS signals. With the horizontal loops still on, the noise was low enough to believe that the line was reduced or gone, see attached.
We also power cycled all the CPS interface chassis which also power cycles the satellite racks; this action had no effect on the peak. There is still the possibility of the sync cable...just an idea that has caused a problem in the past.
Jim is seeing clear changes in the peak frequency with blend changes and continues to test theories with the GS13s.
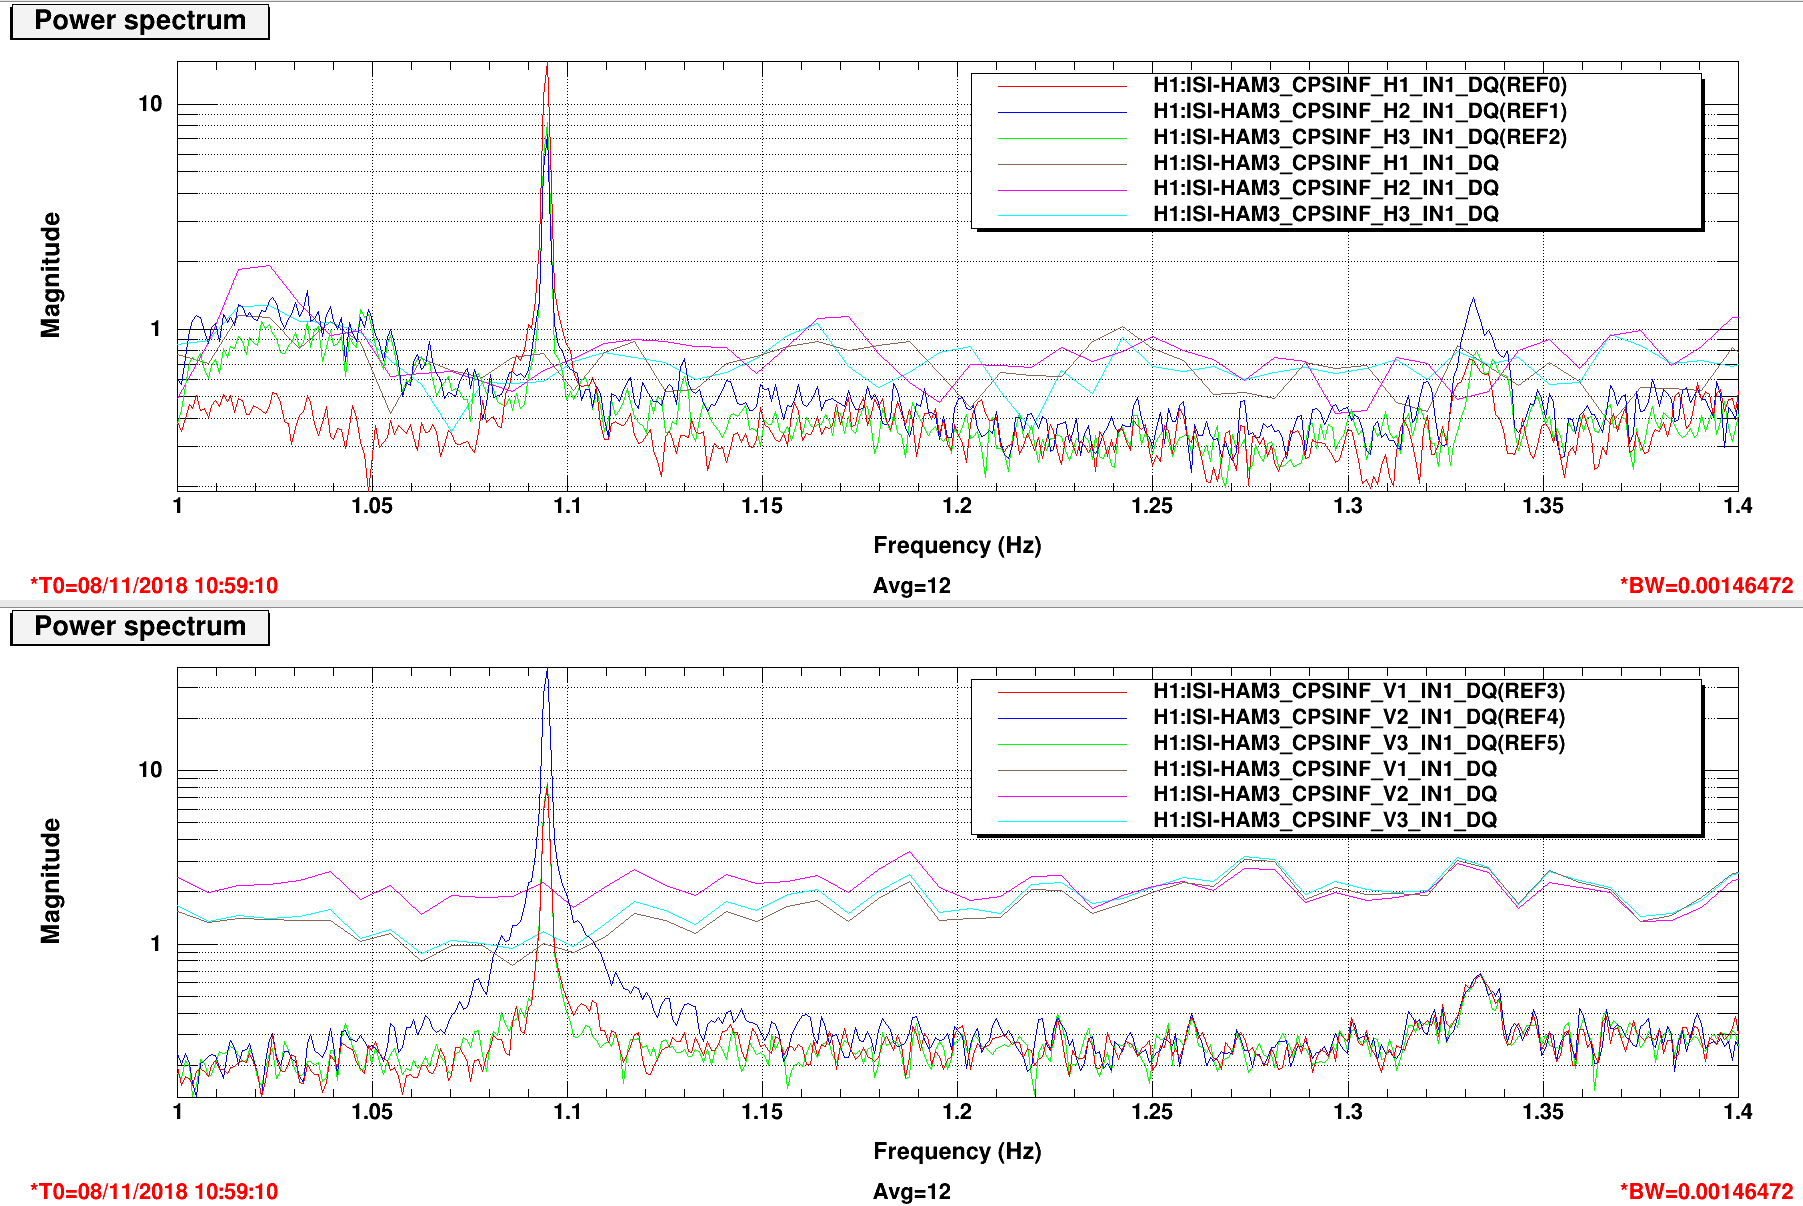
Jim also zero'd the vertical DC drive that amounted to 600 counts on the outputs and about 15um in computed position. This relief changed nothing either, as expected.
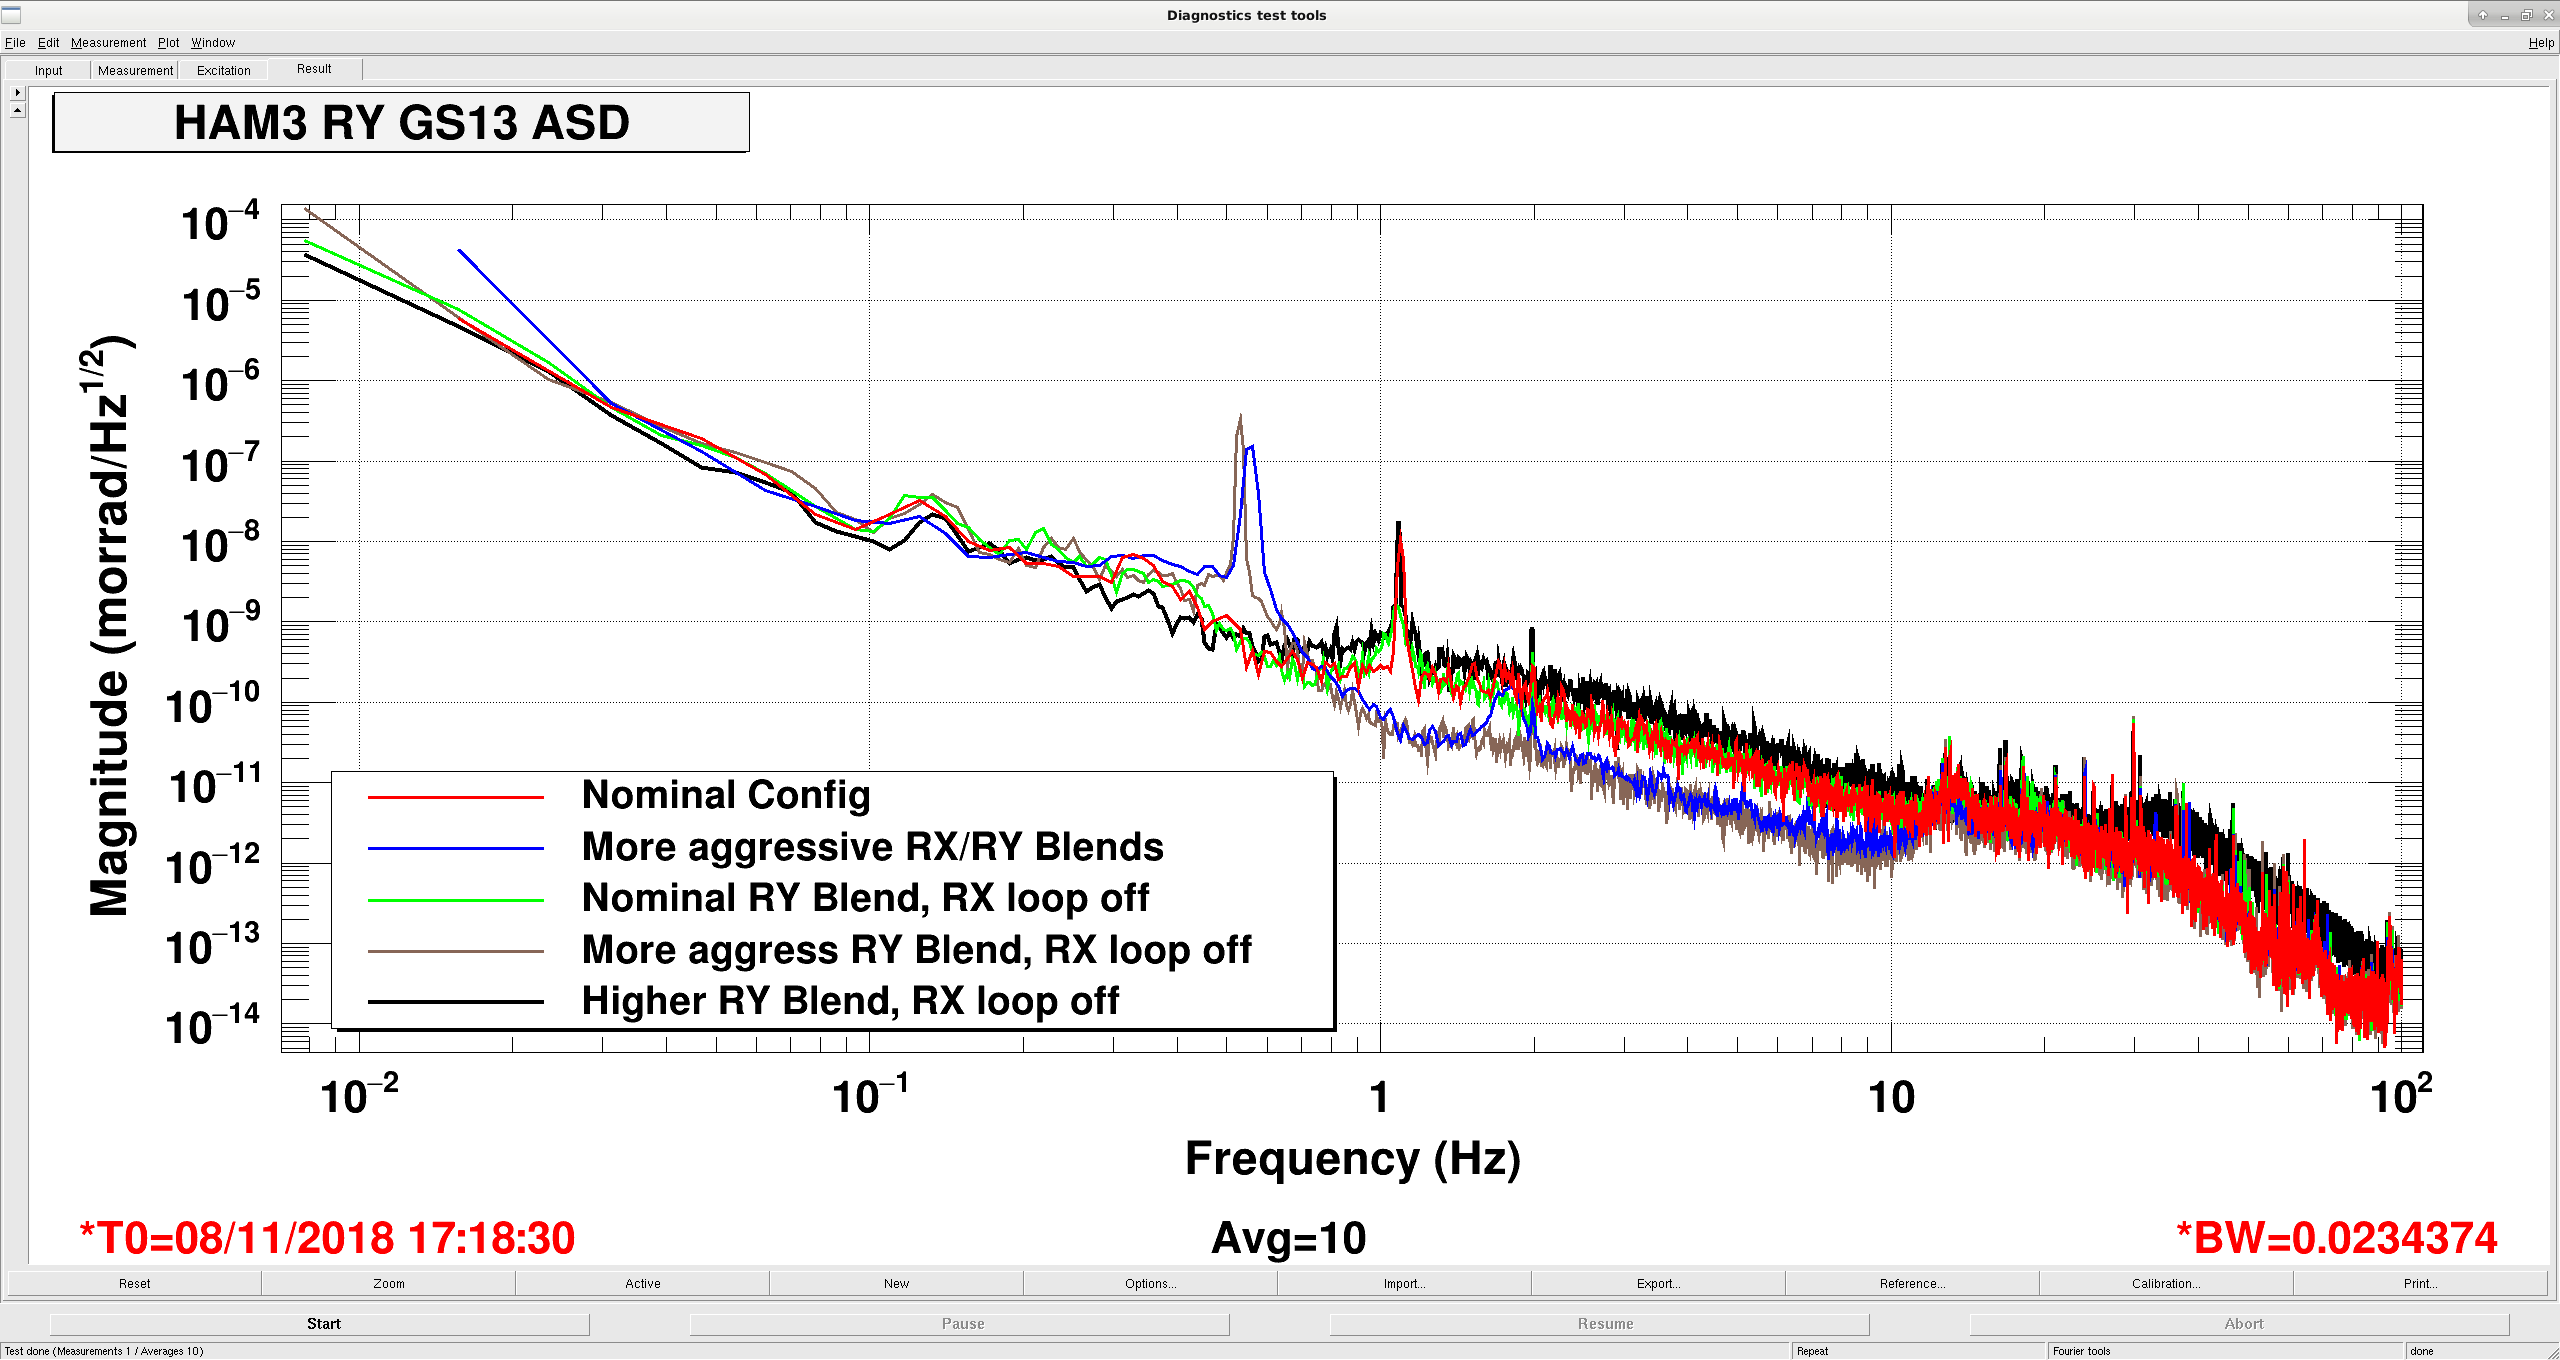
I'm attaching some plots of measurements done this morning. First attached asd compares the RY motion for different blend and loop configurations. At this point, the best fix I have seems to be turning off the RX loop, it makes the RY peak a little smaller. The nominal config is with ~250mhz blends on X/Y/Z/RZ and something a little higher on RX/RY, the more aggressive RX/RY blends actually have a little higher cross-over, but have more ~.5hz gain peaking and more high frequency roll off. Going from the nominal config, pushes the peak down to .6hz and increases it's amplitude. Pushing the RX/RY blend up to 750mhz keeps the peak at ~1.1hz but makes it taller. Turning off the RX loop makes the peak in RY smaller, but changing the blend to either more or less aggressive either pushes it back down to .6hz and makes it taller, or just makes the peak taller. I don't think this is a good way to run the table, as leaving the RX loop off means there is no DC control of that degree of freedom.
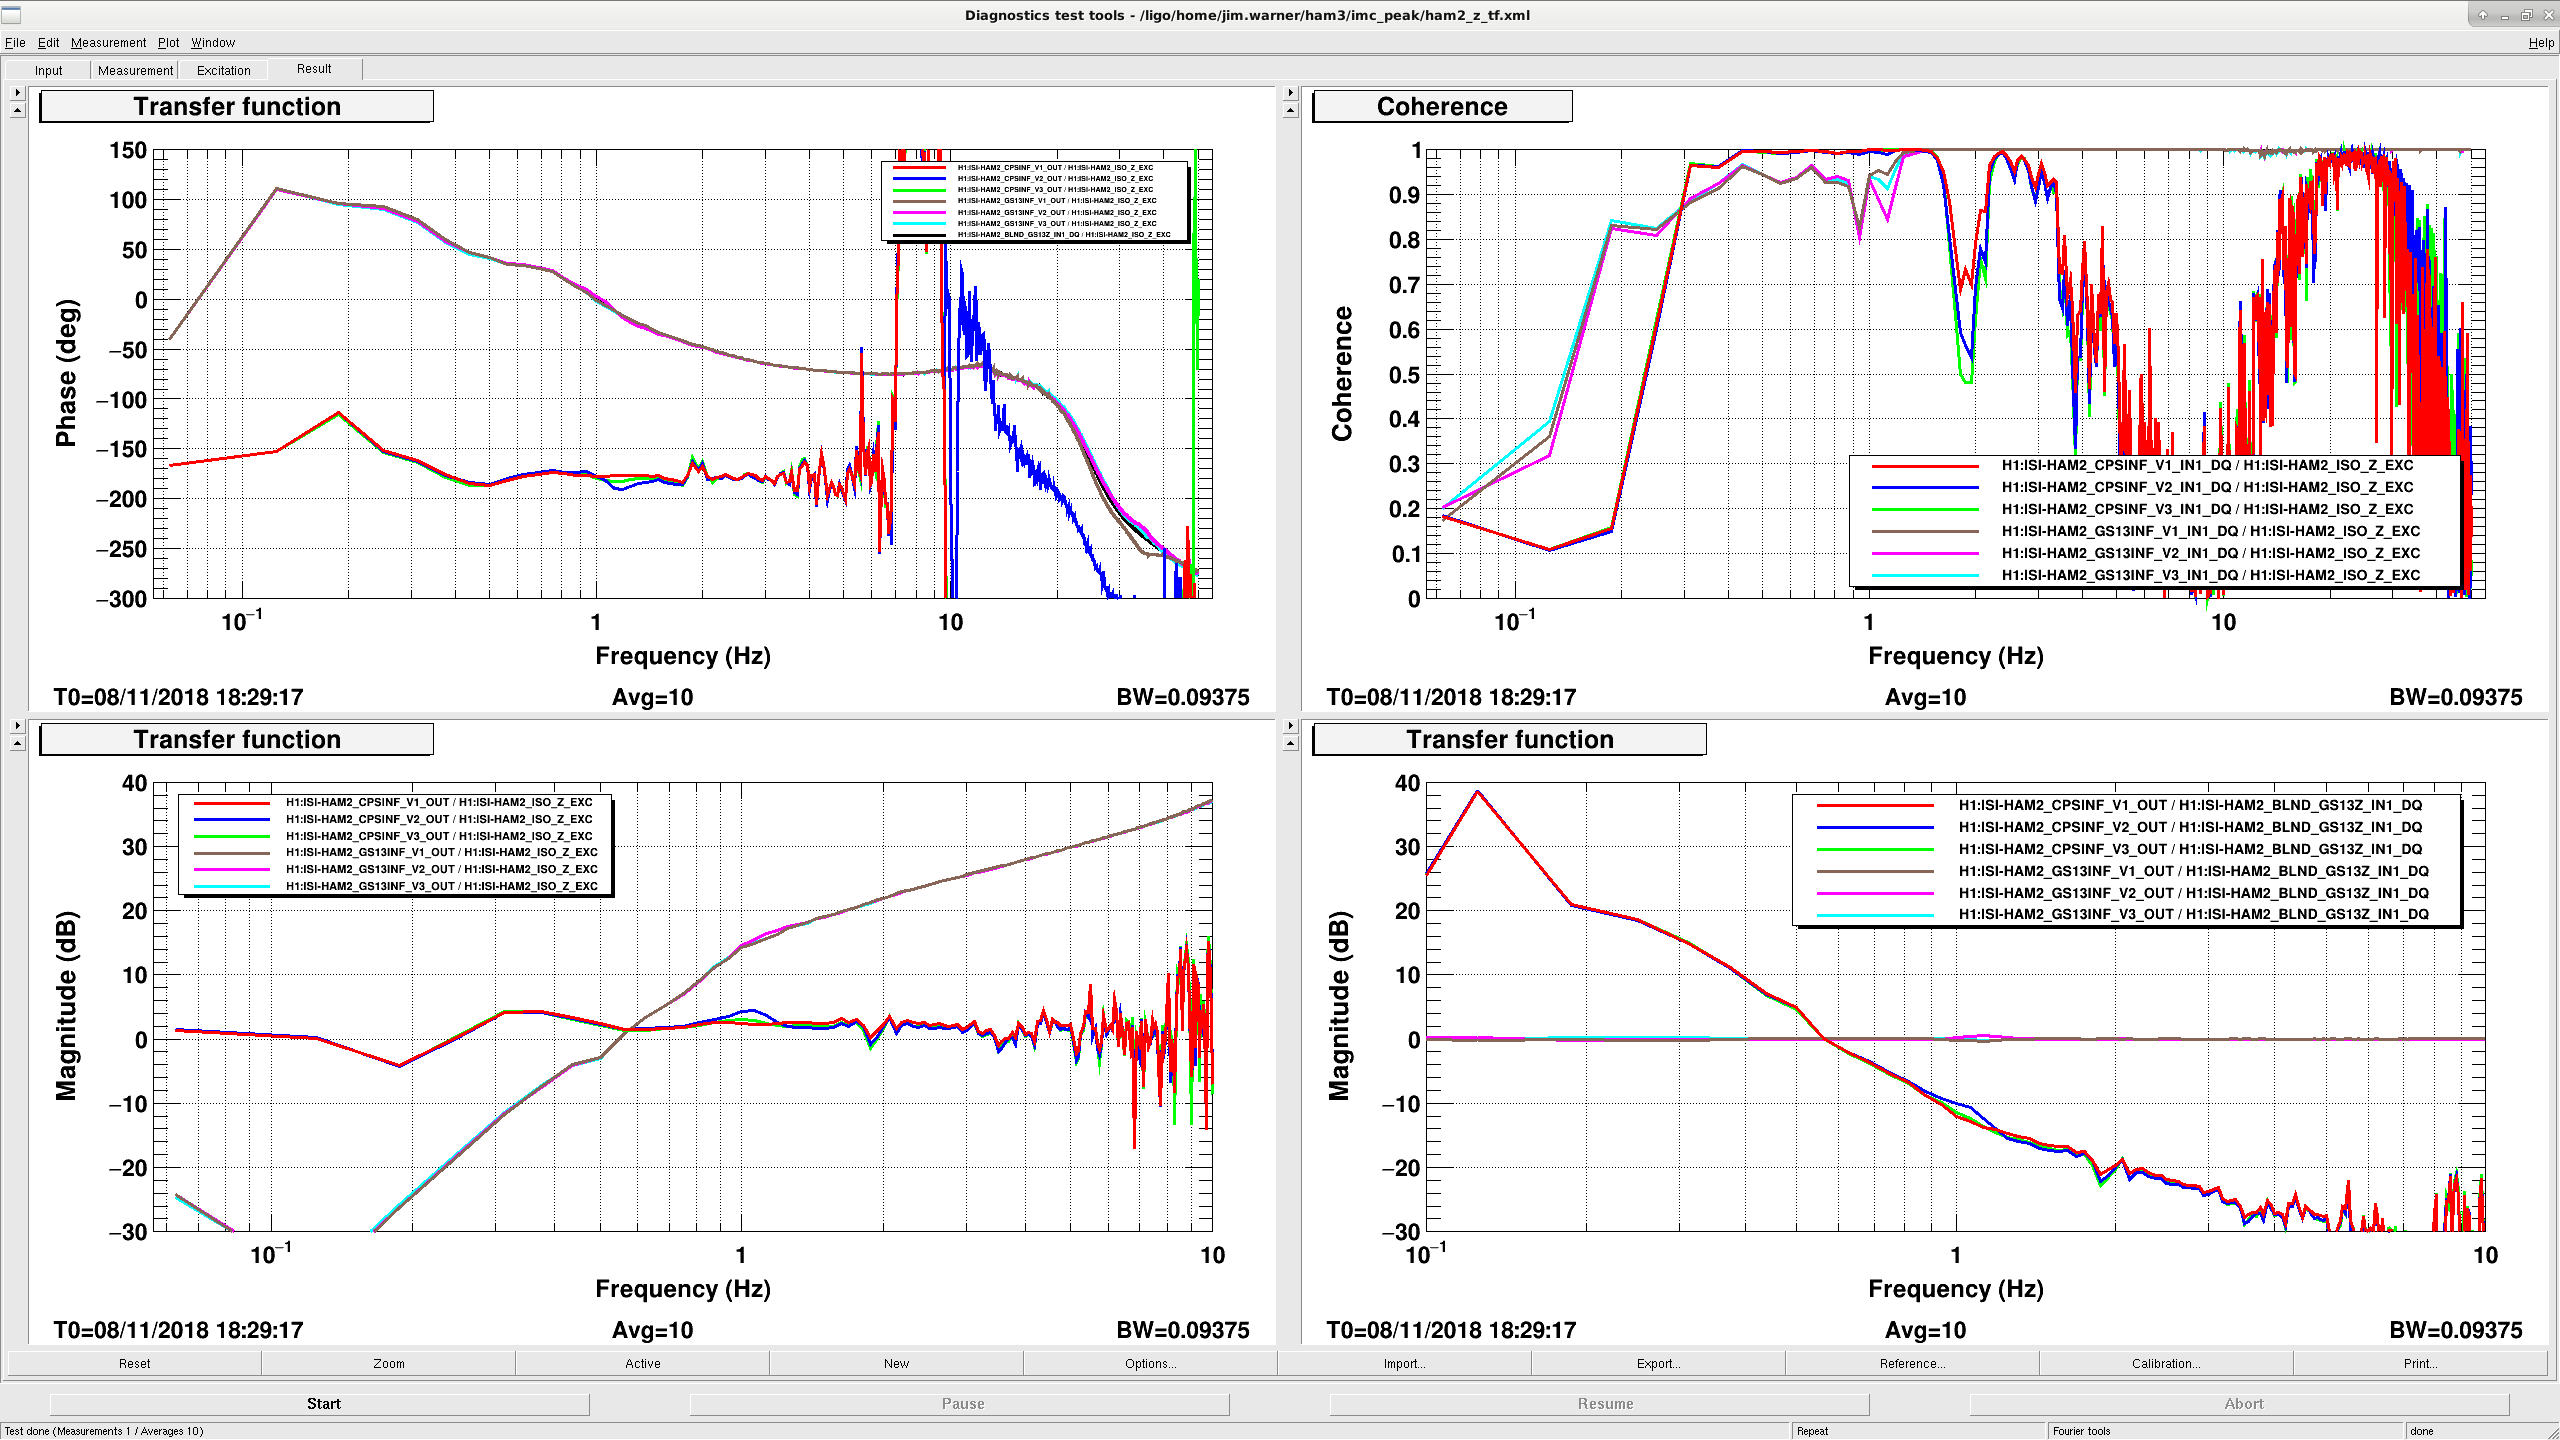
We also took measurements on HAM2 & 3, driving at the error point of the isolation loops while the tables were isolated, with nominal blends, sensor correction and HEPI feedforward. So far, both chambers don't show glaring differences. Attached plots are HAM2 (first) HAM3 (second). On each plot, top right plot is the coherence from the Z drive to the local CPS & GS13 INF OUTs, and so after all the calibrations have been applied to the individual sensors, but before they are summed and composed into cartesian coordinates.
Top left is the phase for the z drive to inf out, bottom left is the magnitude. Bottom right is the tf from GS13Z Blend in to each of the local sensor outs. The similarity between the all of these tfs seems to indicate that this is not a problem with the calibration of any of the sensors.