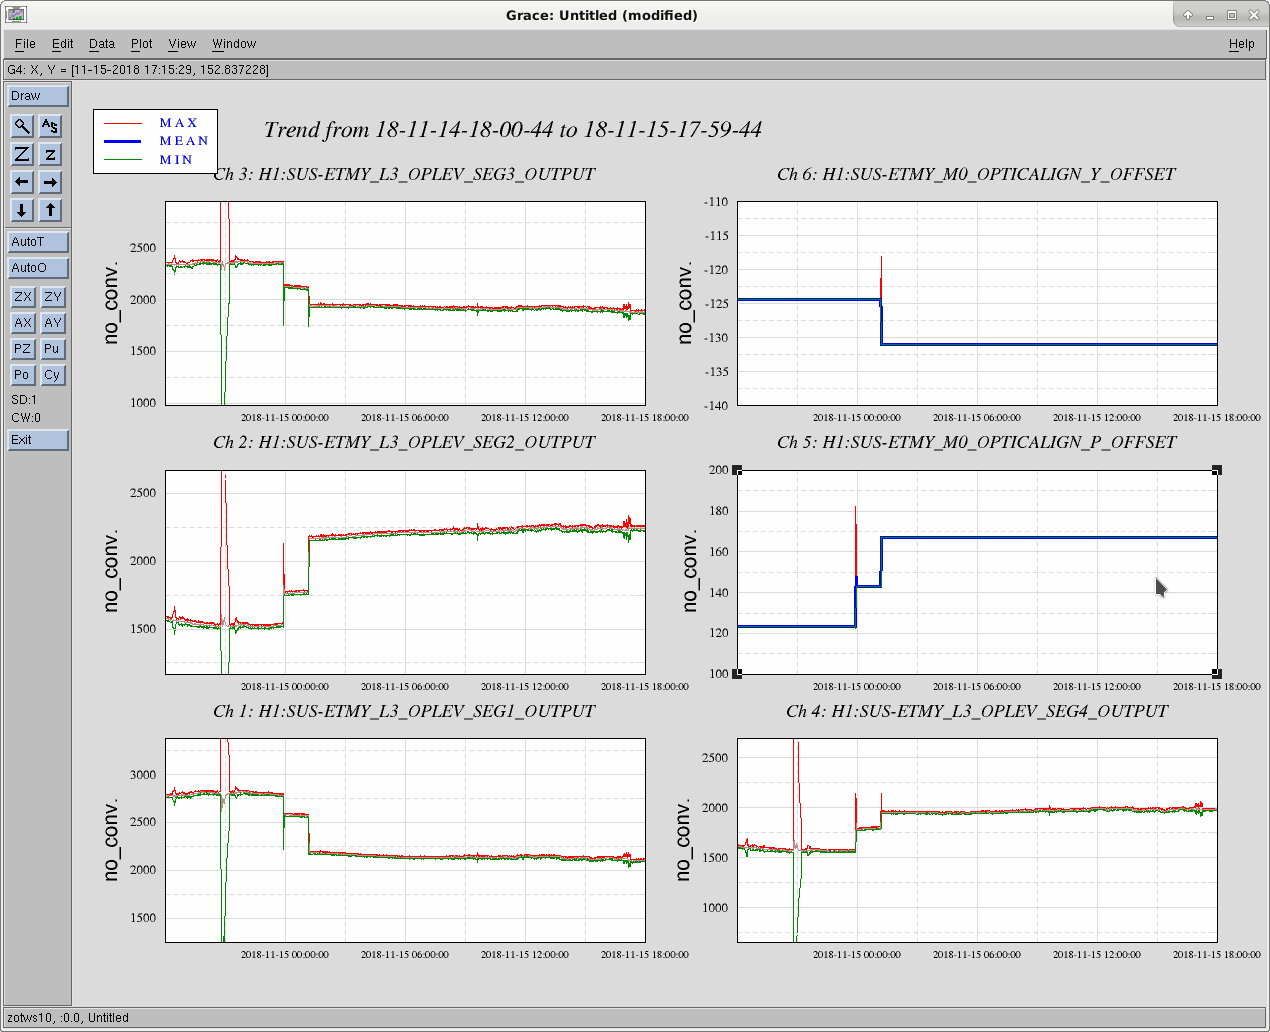
Following on from the EY ESD repair work: Once the pressure at End Y was low enough, Patrick T and I went out to turn on the high voltage and check that the ESD is operational.
We turned the HV supplies (outside the VEA) back on at 5:03pm local time, we then turned on the switches on the back of the low voltage ESD chassis (inside the VEA).
We did the same test that Fil and I ran in May - alog 41772 - driving the ESD quadrants at the OUTF stage (4.3 Hz, 30000 Cnts drive at the excitation point), and looking at the response on the optical lever. We didn't see a response to the LR quadrant drive, compare red trace to other traces in the attached screenshot, very perplexing. Could the problem be at the feedthrough?
We did no further tests this evening.

This is disheartening.  It is possible to tell pretty much exactly where the break is.  Look at T1800199 for a note I wrote detailing the method for finding the open circuit in a cable run.  You will certainly know where in the chain the flaw exists.  Richard and Fil are familiar with the technique.

All things are obvious in retrospect, but we should have done this analysis method prior to going into the chamber.  I was so taken by the possibility of the failure at the end of the cable nearest the optic, that I didn't think about alternative possibilities.
The feed through is tested when the continuity test is done. The pigtail that is in place is not removed so it is not the feed through.
The ETMY Oplev segments seem to be responding when I repoint the optic, so doesn't look like the Oplev readback signals are a problem.
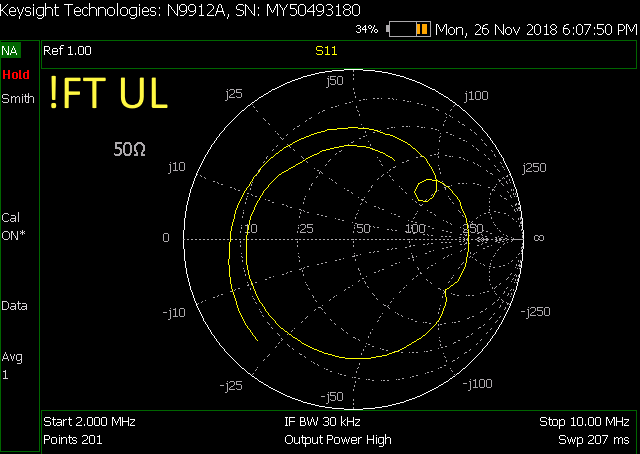
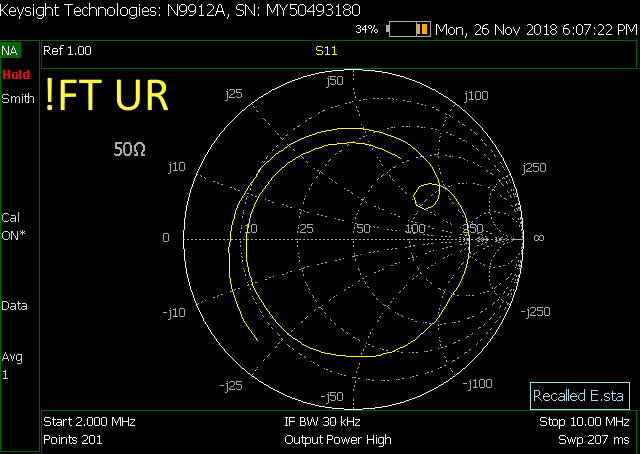
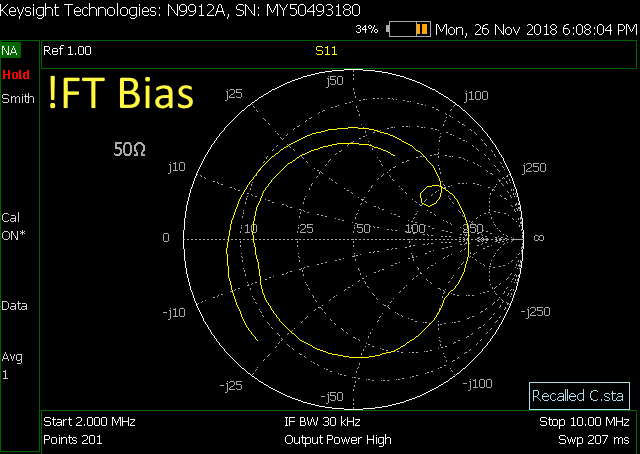
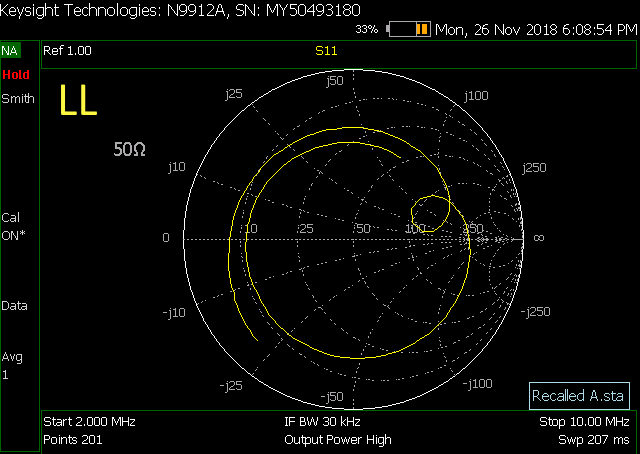
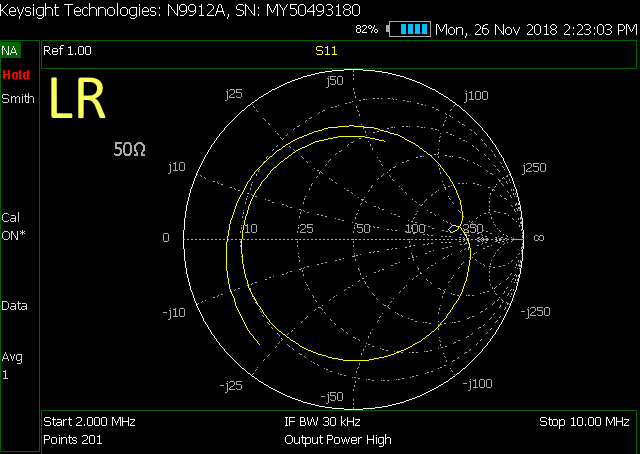
We looked at the cables using the FieldFox method recommended by Rich, T1800199 and here are the results. Our Field Fox is limited to 2MHz on the low end.
Bias cable ends at 64' from the ESD chassis
UR, LR, UL, and LL all end at 60' from the ESD chassis.
We noted a difference in the LR reflections so we took screen shots of each quadrant. I believe the length of the loop corresponds to the length of reflection on the test mass. The loop on the first reflection of the bias trace is quite large. The loop on the working quadrants are seemingly equal and smaller than the bias. The loop on the LR quadrant is very small.
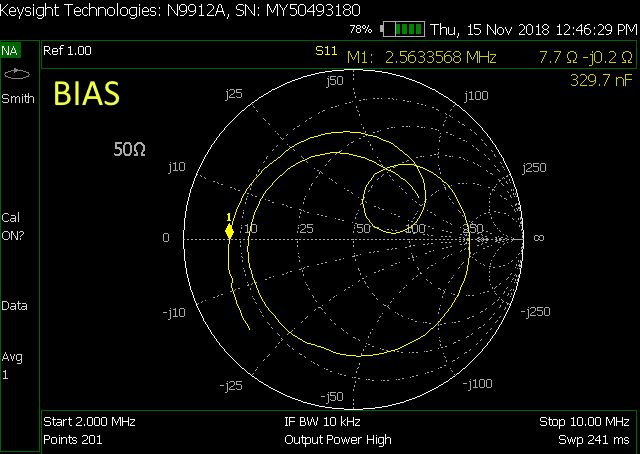
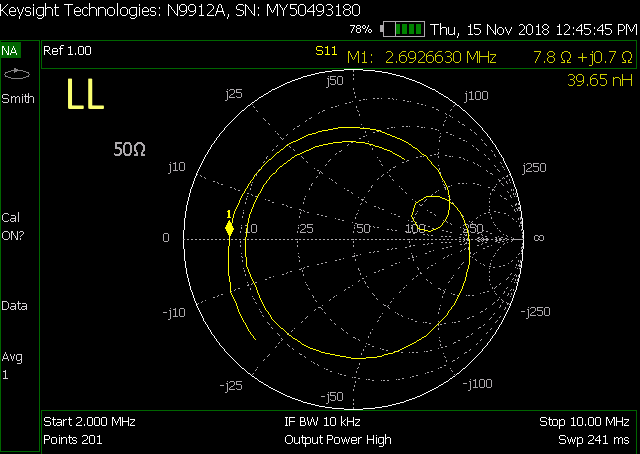
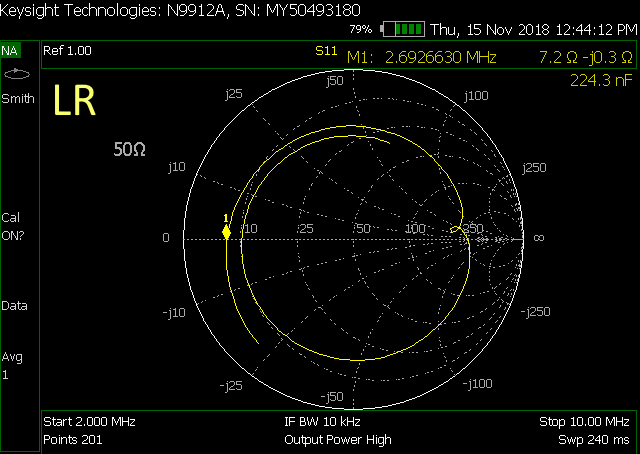
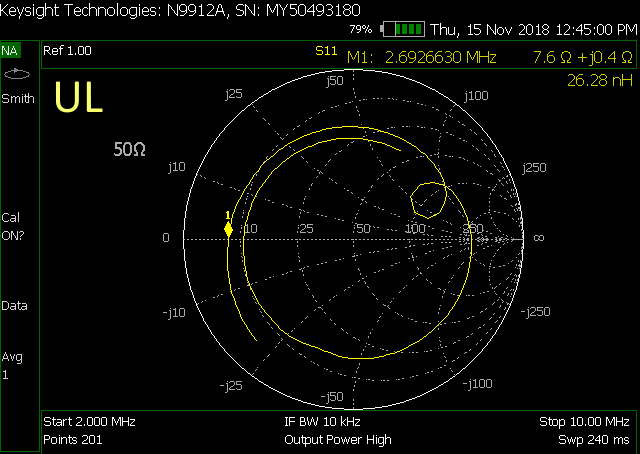
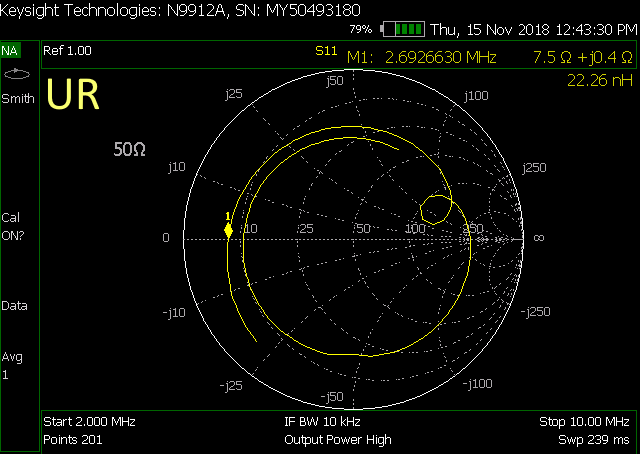
Note: Fil did the same open circuit test in May. The results of the electrode lengths are here, alog 41861.
It makes sense that LL is longer than the upper quadrant electrodes (UL and UR) given the extra length of electrode around the barrel of the AERM. LR being shorter seems to suggest a break close to the optic.
After speaking with some of the team, and reviewing Marc's data:

1.  It would be a good idea to take the transfer function at RF (say 2 to 10 MHz sweep) from the air-side coax leading to the bias, out to each of the 4 quadrants.  By examining these 4 transfer functions for symmetry, we can strengthen the case for there being a break in the gold mask on the LR quadrant of this optic.  The connection from the incoming wire to each of the 4 quadrants is made by little soldered gold tabs.  Were one of these tabs to break free, or if the pin that's soldered to the first tab on the top of the barrel of the reaction mass to come undone, it may account for the existing symptom.

2.  When closely examined, the RF data taken by Marc does have 2 asymmetries in the LR plot vs the other 3 quadrants.  The fact that the residual impedance at the first marker frequency (~2.69MHz) is different (capacitive for LR and slightly inductive for the others) is noteworthy, but not stunning.  The precision of this type of measurement relies on knowing the characteristic impedance of the entire cable assembly.  Given that these assemblies end in a single wire strung into space, it's not immediately compelling to see slight differences, and indeed there is variation in the other "good" quadrants.  However if you couple this observation with the funny looking loops seen on the right side of the plots, the story gets more interesting.  The funny loops are likely to be parasitic couplings to another resonant element (bias electrode?) in the cable/ESD system.  A smaller loop (as seen in LR) indicates less coupling.  This would fit the model of there being a break somewhere in the gold pattern distribution that exists on the reaction mass.  The coupling is likely to be a cross coupling to the bias element through parasitic electro-magnetic coupling.  when taking these transfer functions, it is likely that there will be enhanced coupling evident at the frequency of the loops as seen in Marc's data (manifesting in a lower loss in the RF transfer function).

3.  Continuity tests are done to the top electrodes on the reaction mass barrel at the 12 o-clock position.  If there was a break further down the chain (like the gold bond wires that are soldered on), then the continuity test would not catch that.  Calum thinks we used to examine the gold bond wires when we did incursions relating to ESD troubles.  I don't know if that was done during this vent cycle.

I ran a simulation of a coaxial cable with an open lossy resonant termination, and was able to mimic the loops and overall response seen in Marc's data.
Fil, Marc, Georgia
We went back down to End-Y to run some more tests on the ESD, including that mentioned in the first point of Rich's comment.
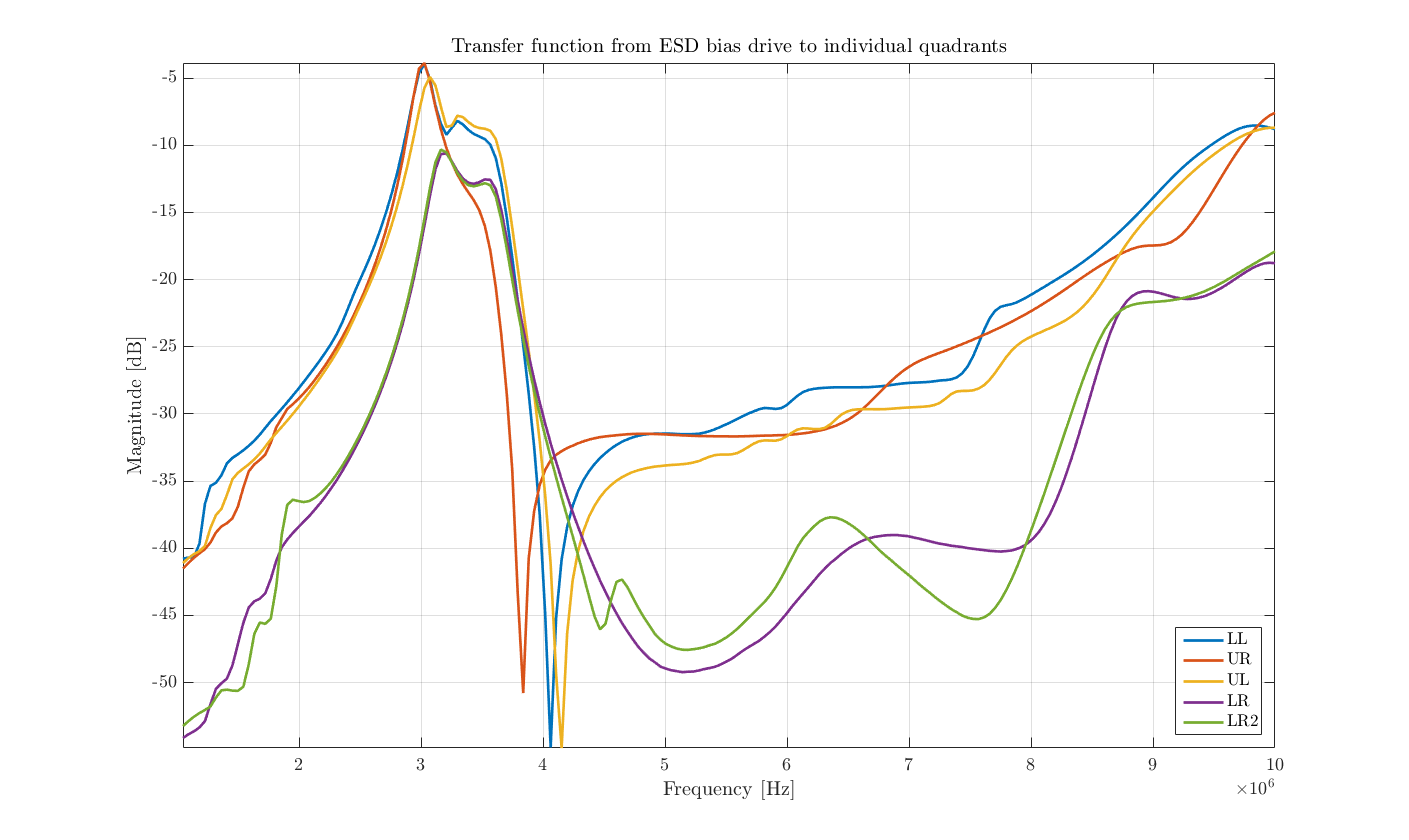
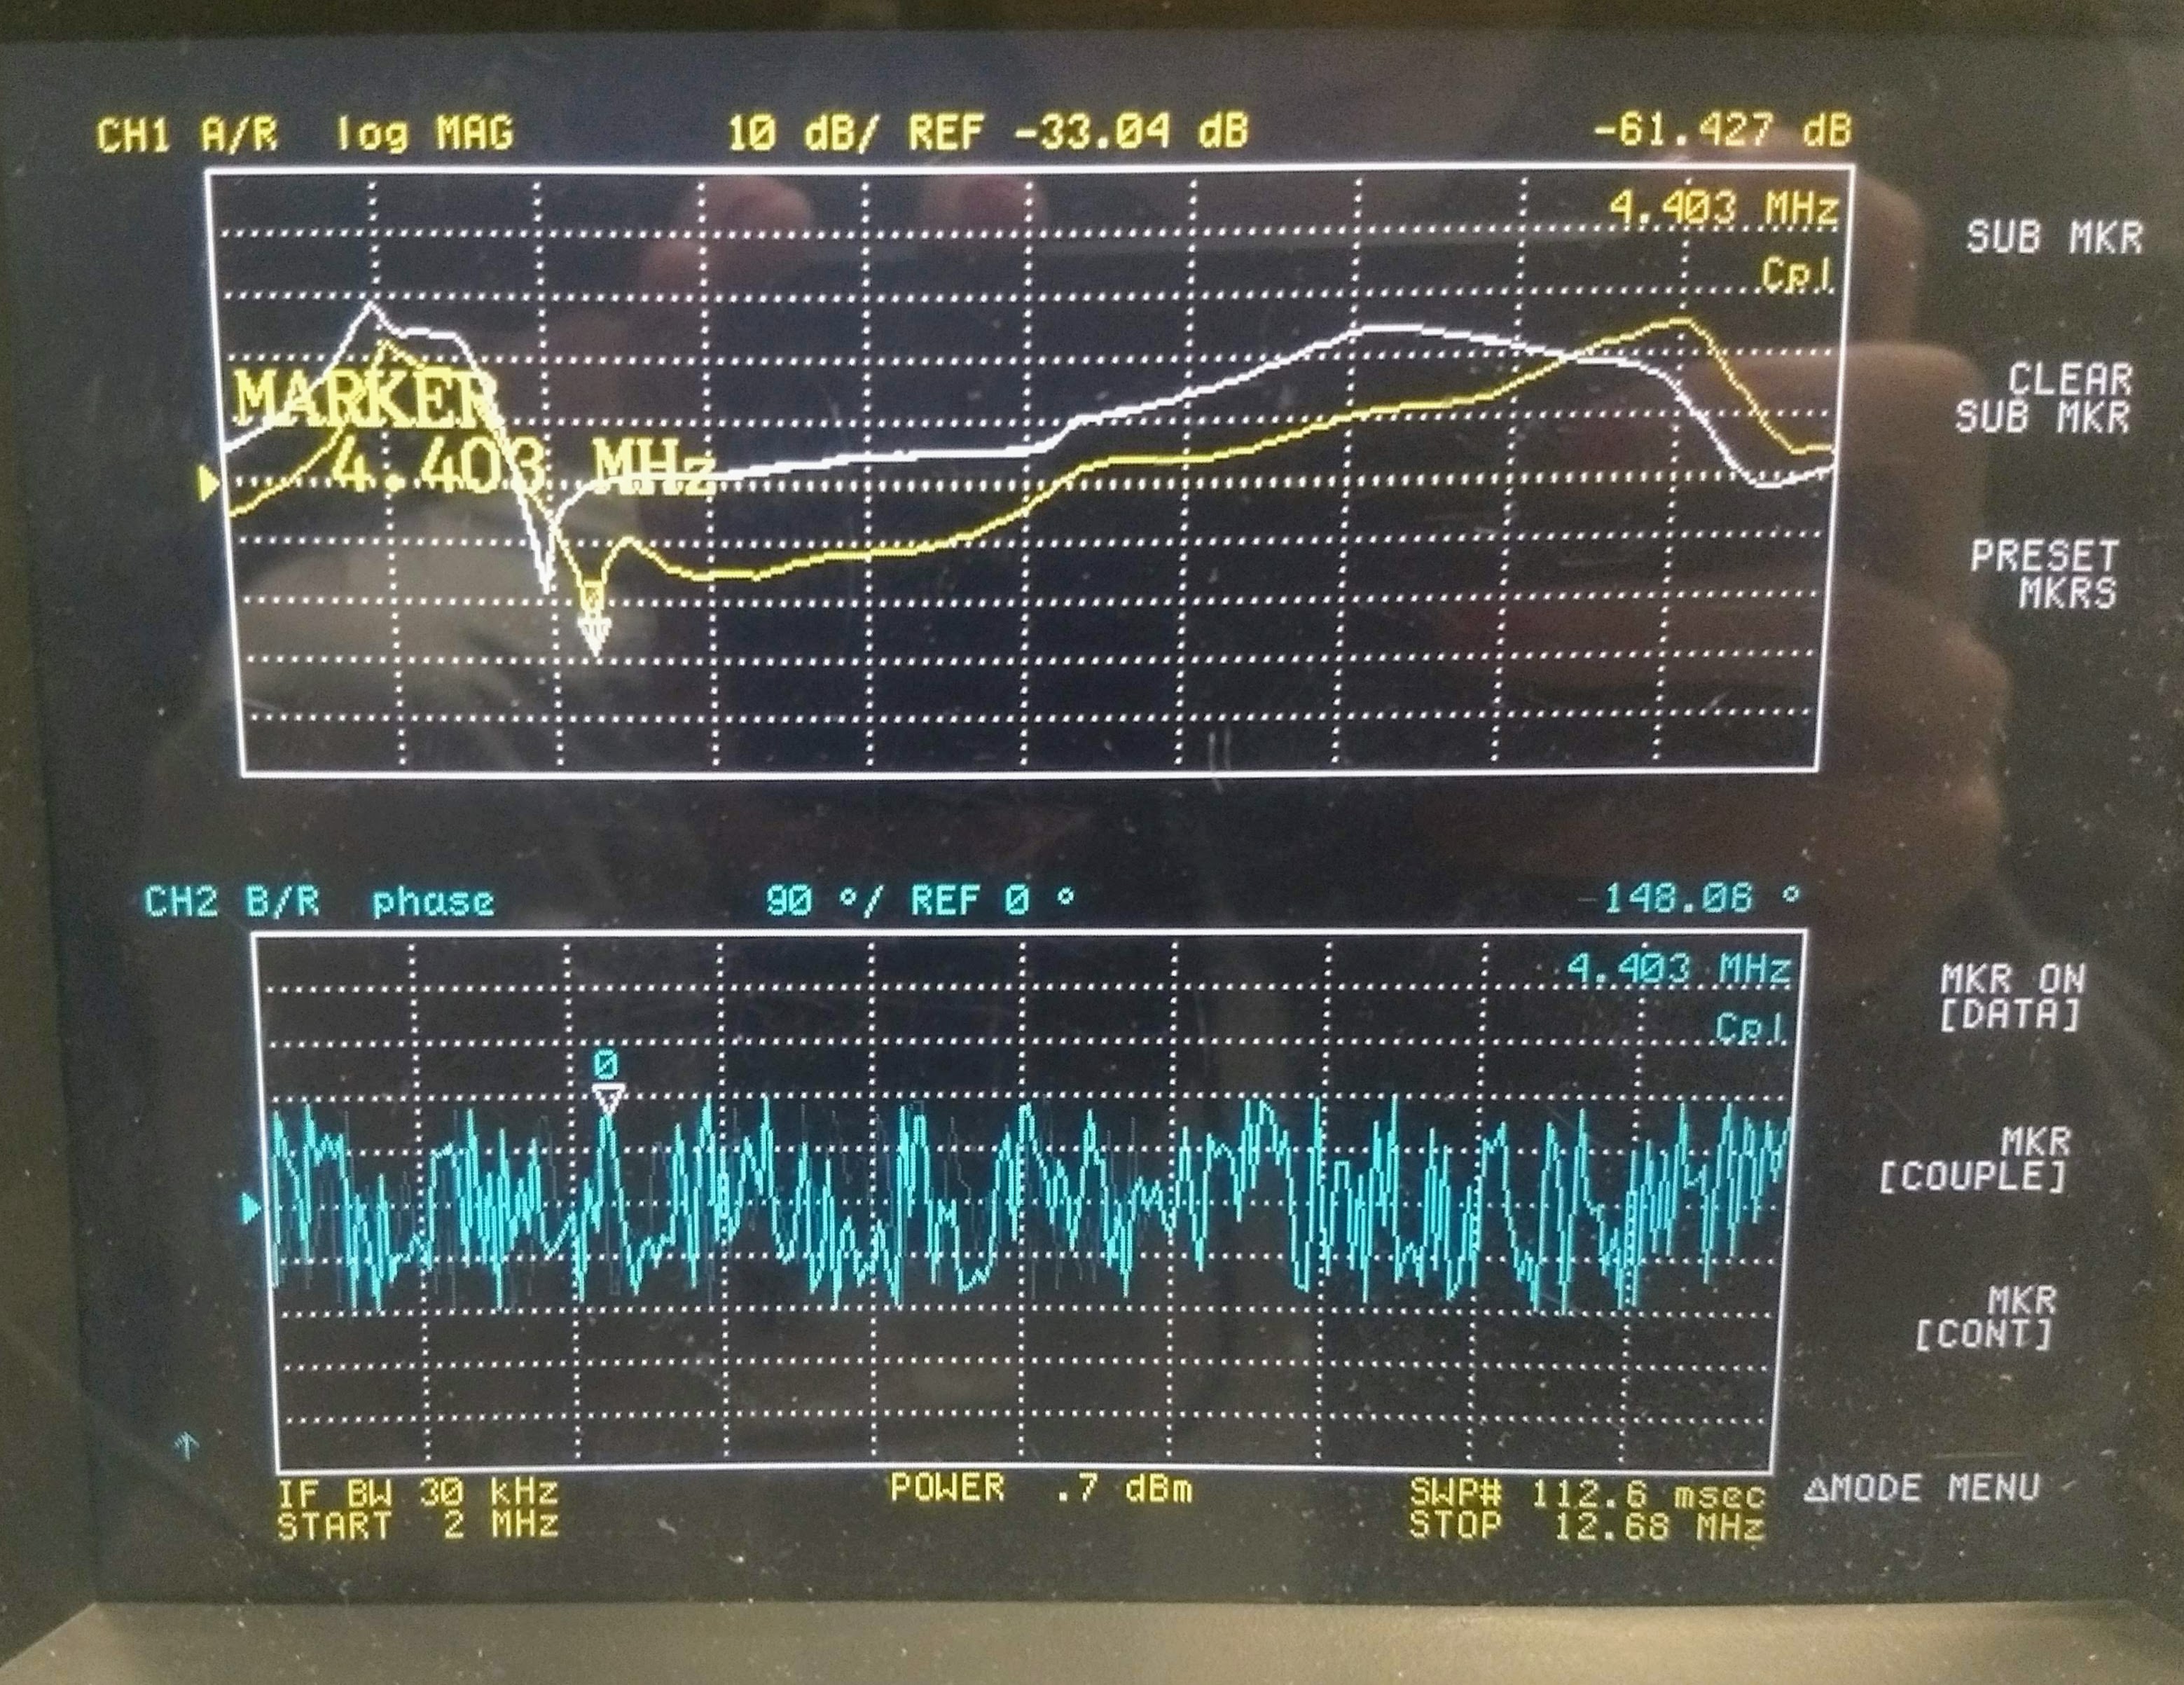
- We first ran RF transfer functions from the bias to the ESD quadrants, as suggested by Rich Calum and Garilynn. The drive to the bias should be picked up by the quadrant electrodes, like antenae, we used these electrodes as our sensors. Magnitude results shown in the first attached figure.
- Configuration: We used the HP 4395A network analyser. Fil connected the RF output of the analyser to the bias electrode at the pigtail (directly after the feedthrough, up in the cable tray), and to the R input of the analyser. He then connected the quadrant electrodes, also at the pigtail after the feedthrough, to the A channel of the analyser one at a time, and we measured the TF from R to A.
- Parameters:
- RF drive amplitude: 0.7 dBm (We turned this up to 2dBm and saw no change in the TF, so brought it back down).
- Frequency band: 1 - 10 MHz.
- Results:
- We weren't really sure what to expect. What we saw is a broadband response, with an anti-resonance around 4 MHz.
- The phase data of the transfer function didn't show anything so we didn't include it in the plots.
- On the first test we took the LR quadrant looked different to the others in that the resonant frequency was slightly higher frequency, we didn't store this data, only took a photo comparing UR and LR quadrants, shown in the second attachment.
- When we retook our measurements to store on a floppy disk which Marc brought down, the resonant feature was drifting in and out of existence. Jiggling the cables, even though they were isolated from each other, caused shifts in the TF, shown by the 2 LR curves in the first attached plot, which were taken a few minutes apart.
- We're not sure what these plots tell us, except that the LR quadrant is definitely different to the others.
- Fil redid some outside-the-chamber continuity checks that he also did back in May, checking for accidental shorts between the ESD pins to other ESD pins, grounds to grounds etc, and saw nothing strange.
- We switched the UR and LR quadrants at the output to the low voltage chassis (which actually does low and high voltage). In this configuration, an excitation to the "UR" quadrant would actually be delivered to the LR quadrant electrode and vice versa. I redid the tests that Patrick and I ran last night. Strangely, with a 4.3 Hz drive to the UR channel (i.e to the broken LR electrode), there was some additional noise from in the op lev pit signal at 2-4Hz (see third attachment). I want to repeat this test tomorrow with the optical lever centred (it was 5 urad off in pitch), since this piece of information doesn't fit with the other clues we have so far. [edit: updated the plot of this data since the legend entries were wrong and the titles were also wrong, sorry for any confusion].

Following tests were redone yesterday afternoon.
Looking at feedthrough with pigtail connector attached checked for shorts across:
1. Pin to Shield on each individual SHV connector
2. Pin to Pin on all SHV connectors
3. Shield to Shield on all SHV connectors
4. Pin to Chamber GND on each individual SHV connector
5. Shield to Chamber GND on each individual SHV connector
All tests passed.
Place a T adapter in line with the LR segment and monitored voltage going into chamber. Same voltage was observed when connected to chamber vs not connected to chamber.
The AERM solder joints at the optic were intact in Jan 2018 during the install (alog 40336) - although this picture doesn't show the side shot for the LR.
It's hard to image that the solder joints (large and look very good in picture) have come undone. I know for a fact that upon my inspection of the top 5 pins while in-chamber this last Tuesday, the pins were still landed well and the solder/pin joint look the same as in this picture from Jan. It is very difficult to inspect the "bridges" that connect the barrel gold traces to the face traces, and I did not look specifically at those on Tuesday.

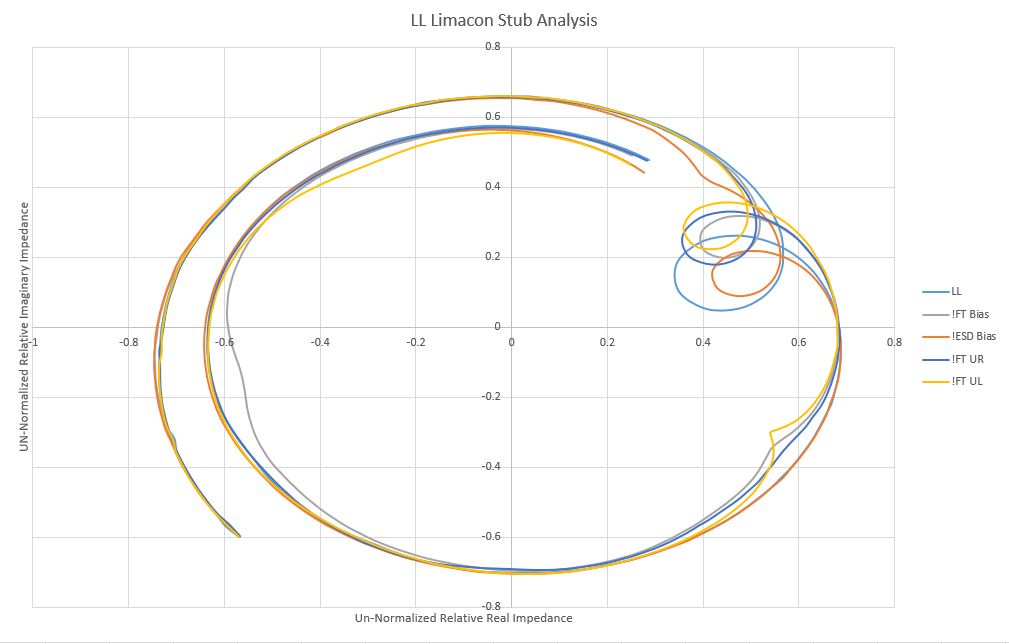
We have some new scans from ETMY Annular End Reaction Mass (AERM), LR quadrant. We tried scanning the LR quadrant while changing the other cable configurations to determine where the coupling is strongest. On the plot we can see the LR signal as it was in prior scans. We then disconnected the Bias at the ESD which shifted the trace slightly but not significantly. Next we disconnected the Bias at the feed through and saw a much larger shift. Next we reconnected the Bias at the feed-through, and disconnected the UR signal. This made the most difference to our trace which leads me to believe that there is more coupling between LR and UR, than there is between LR and Bias, which should be the case if we are disconnected at the joint on the side of the AERM. Disconnecting the UL signal made little difference to the coupling.
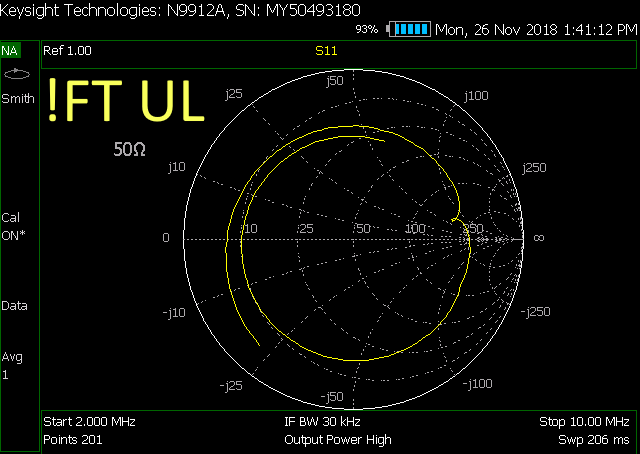
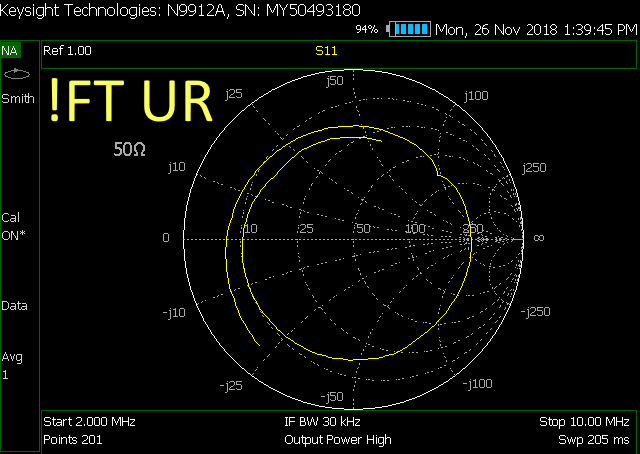
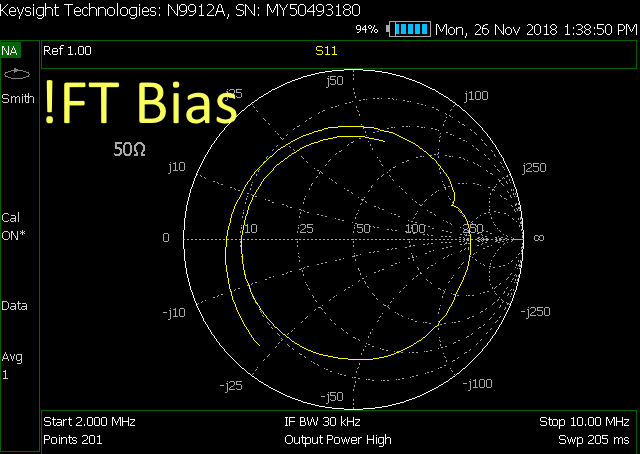

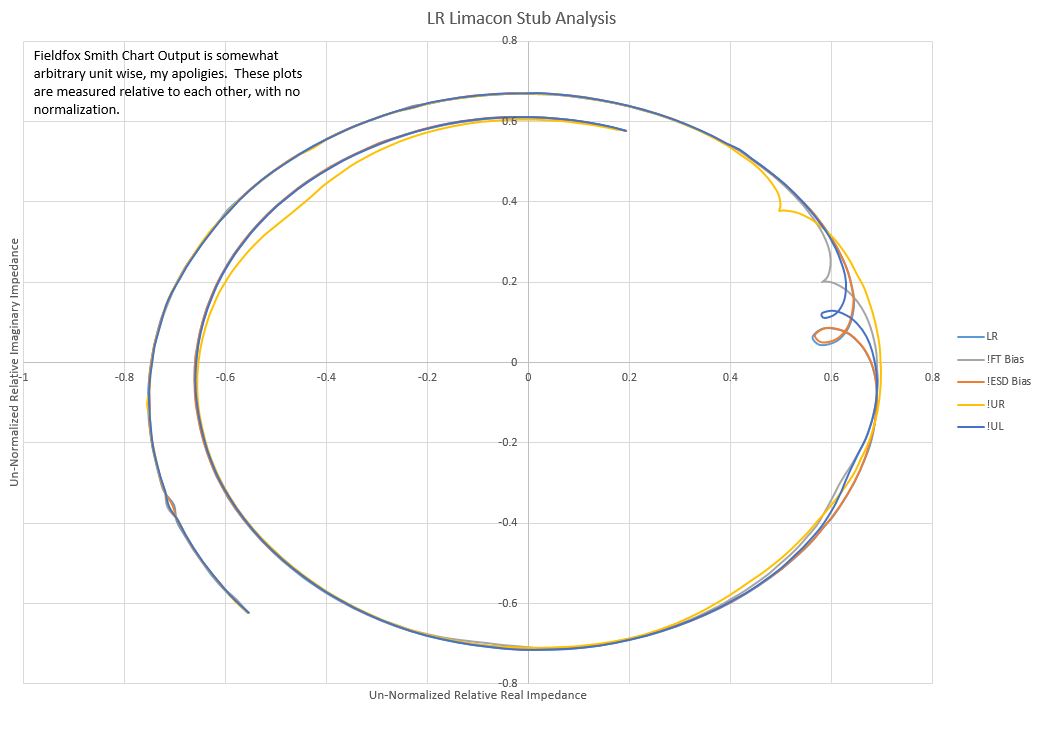
We scanned the LL quadrant in the same way we scanned the LR quadrant, I will post it here as a way to compare the known good lower quadrant with the sketchy lower quadrant.