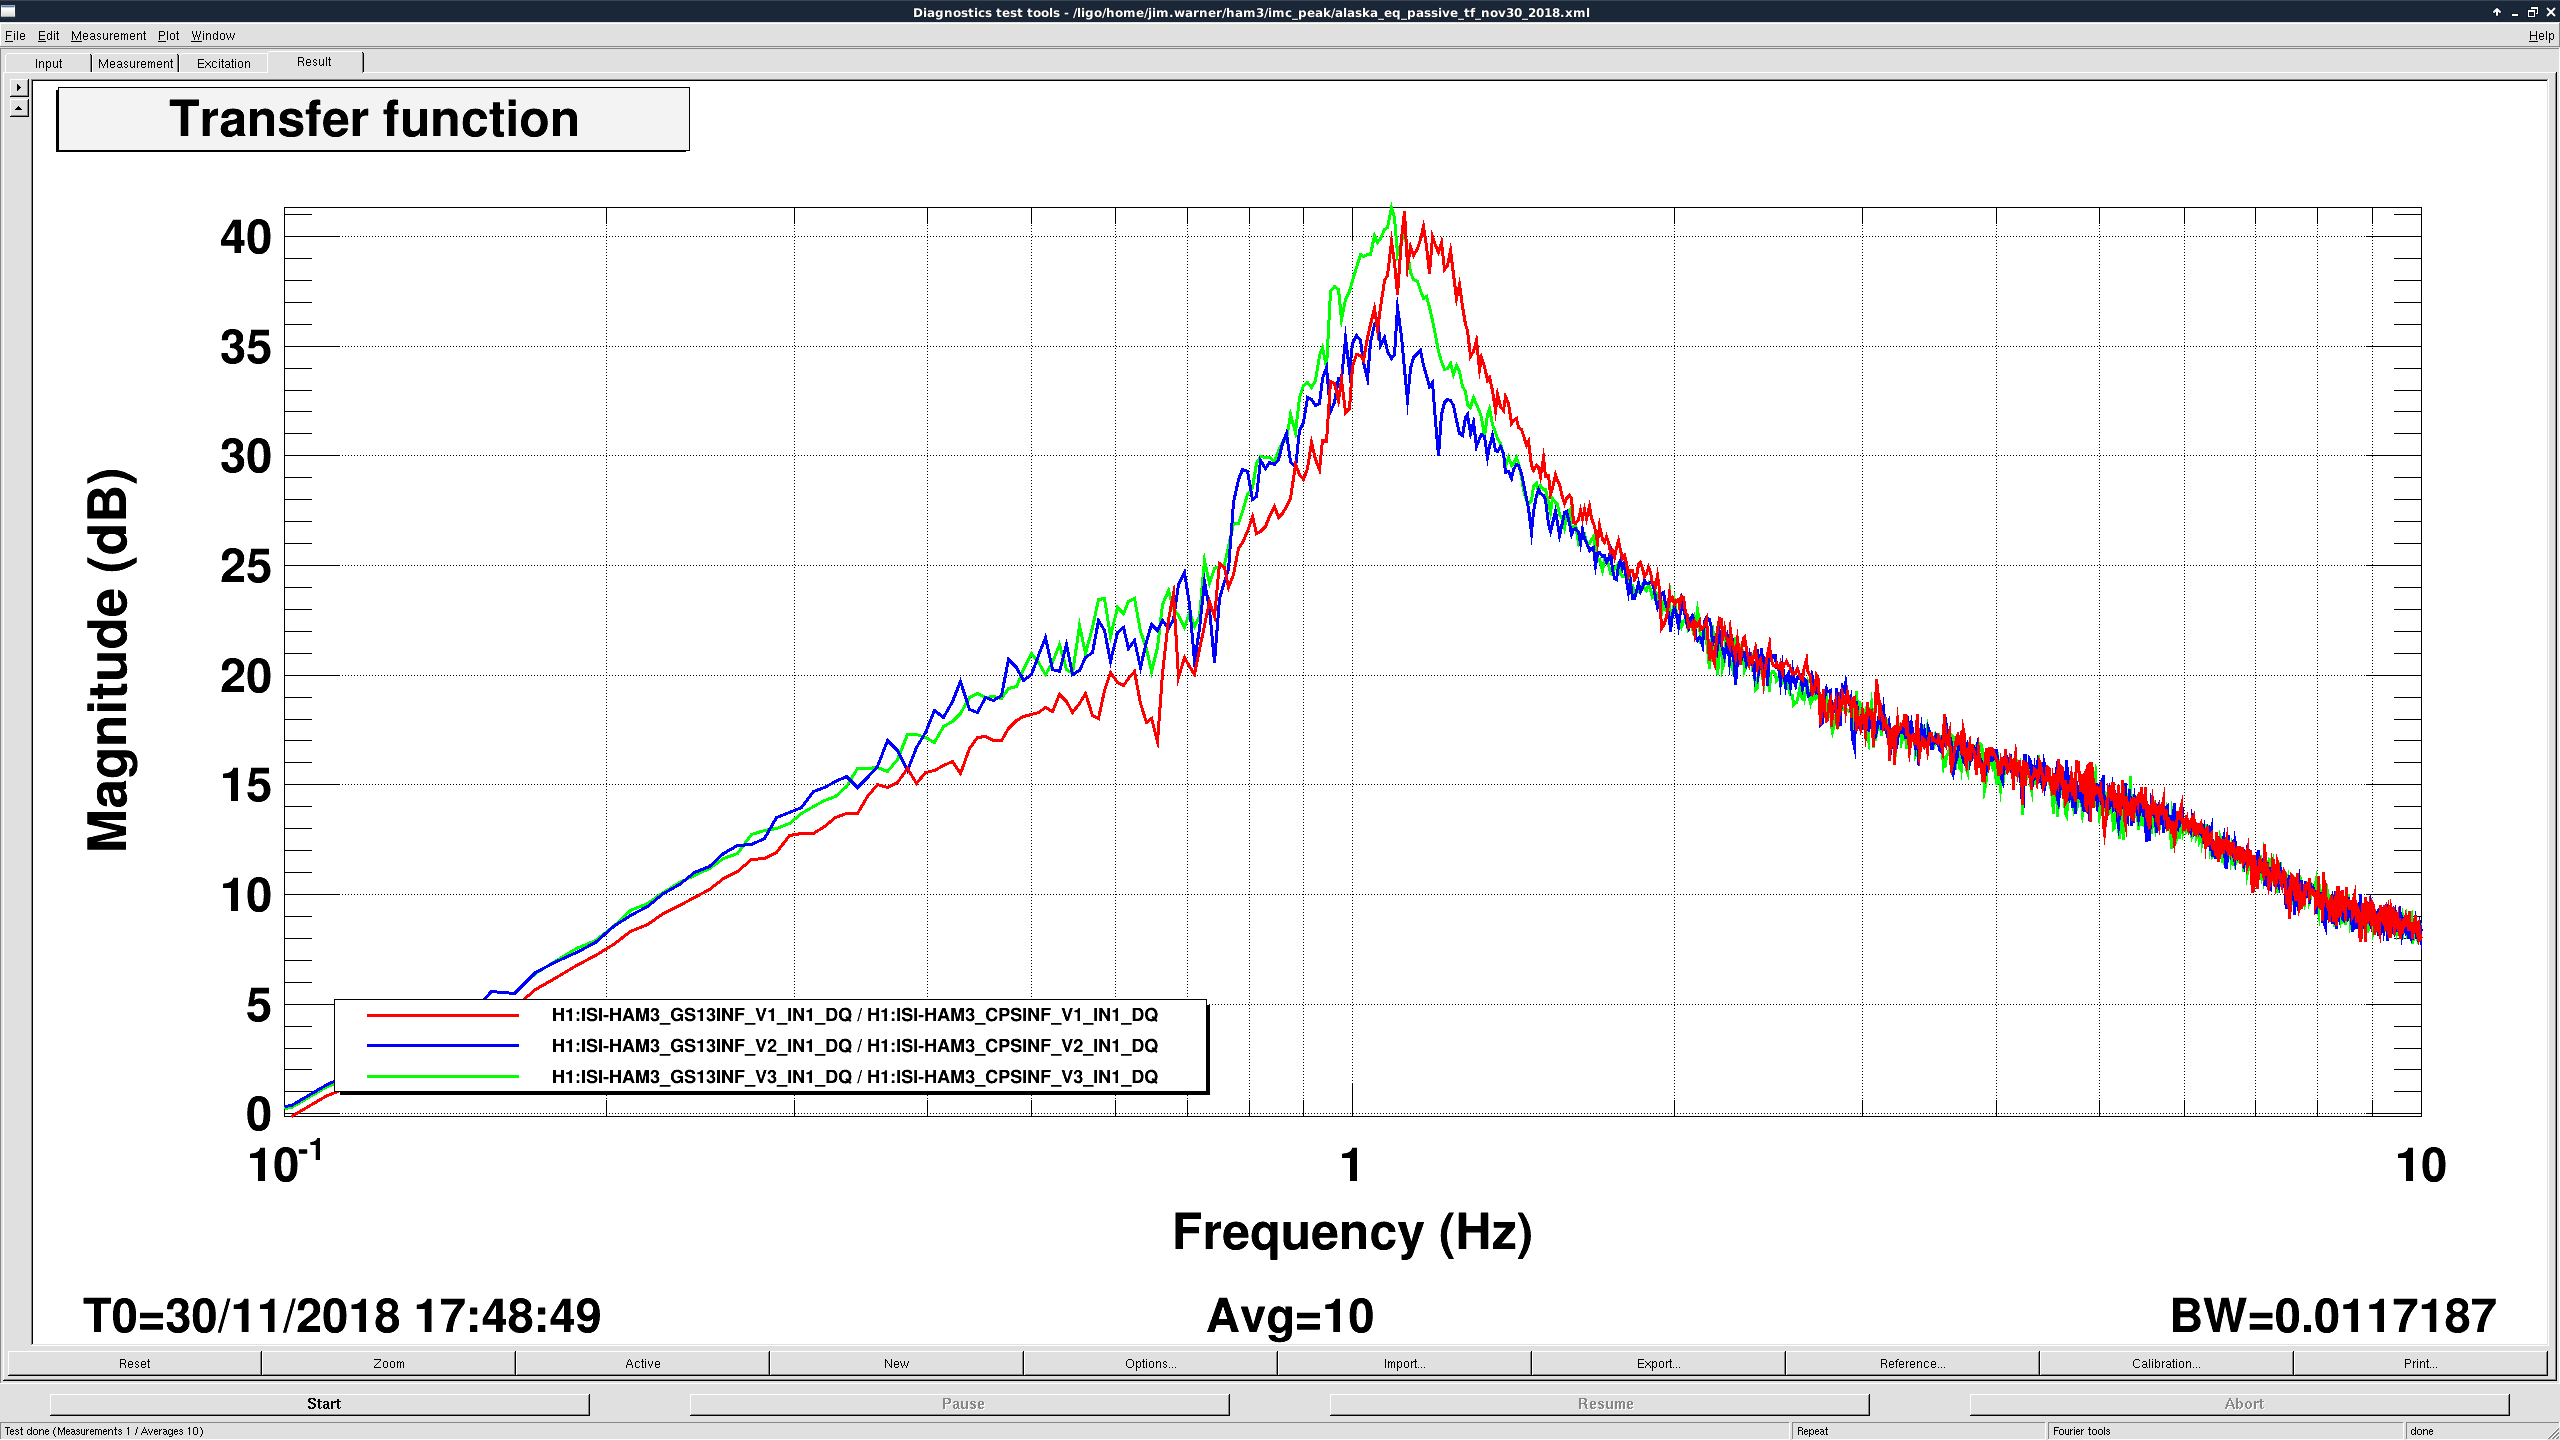
I've been asked about about the 1.1hz peak on HAM3 a couple times today, so I should post about what I have done. To start, the peak is still there. A couple weeks ago, I tried swapping around the ISI interface chassis and AA chassis to see if this changed anything. There are 2 of each of these chassises, all of the corner 1 & 2 sensors are plugged into the first interface chassis, which is plugged in the the AA chassis, while corner 3 is plugged into the second interface chassis, then the second AA. I had hoped that this would show one of the channels on the interface chassis was bad, but no luck. I could try swapping other rack components, but it quickly starts getting much harder to do the swaps.
Separately, this morning during the Alaska earthquake, I did a repeat of Keita's measurement from alog 45182. This was a much bigger earthquake than the one from Keita's alog, and after talking with him, it seems like this matters. In the bottom left of his first plot , the peak frequency and Q are a bit different for the v2 cps to v2 gs13 transfer function than for the other 2 corners, I've blown this tf up in my first atttached plot. In my second image, the same transfer functions larger Alaska earthquake this morning don't show the same difference. The Q is a little lower for the blue V2-V2 trace, but the frequency of the peak and Q are more similar to the other 2 corners. Keita suggests that this means the difference depends on the amplitude of the drive, which is why my earlier driven transfer functions didn't show anything, too get good coherence I had to drive hard enough that it buried whatever is allegedly causing the V2 GS13 to behave differently.
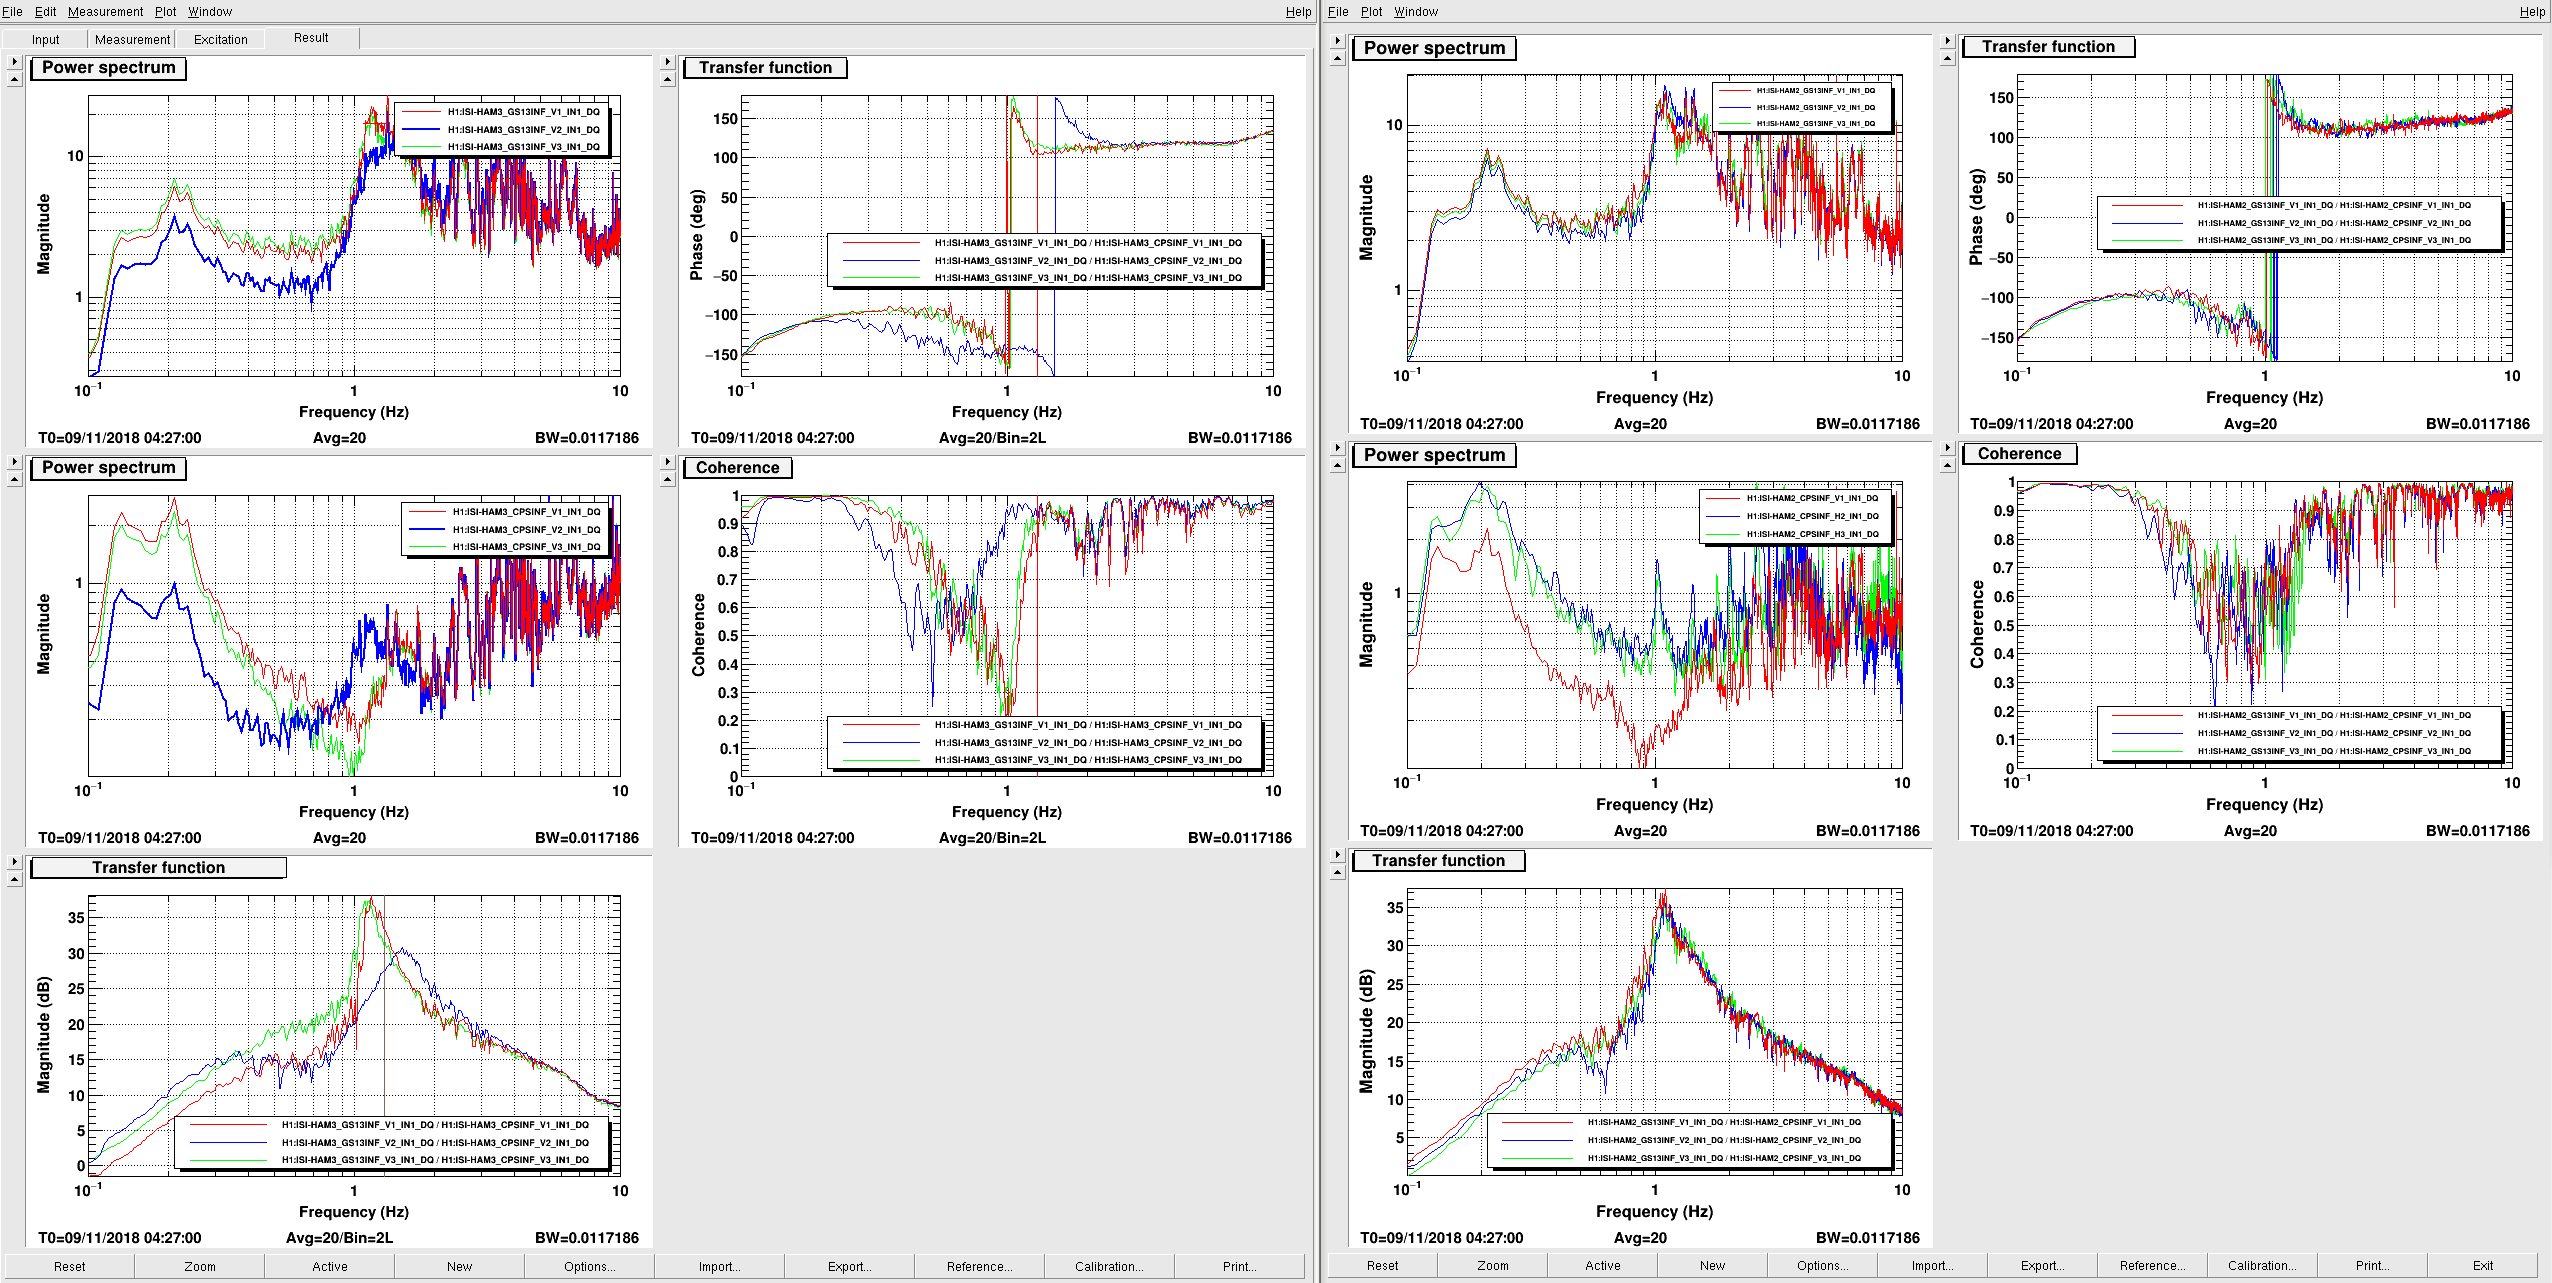
I didn't catch it from Keita's plot before, but I think the fact that the resonance frequency and Q change with input motion makes me kind of suspicious that this is a bad GS13, either sticky or a weak flexure. I don't really know how to confirm this, yet.