corey.gray@LIGO.ORG - posted 10:26, Wednesday 05 December 2018 (45674)
Charge Measurement on Dec 4 (before Maintenance)
Came in a little early to run ETM Charge Measurements before Maintenance & followed the usual procedure.
Log: (Times in PDT)
- 7:20 Begin prep work for measurement
- 7:40 Began measurement (& went out to transition LVEA to SAFE)
- 8:22 Canceled out of measurements due to conflicting Maintenance activity. So basically acquired 3-full data files (and a 4th data file was bad because I canceled out of it.)
Notes on the procedure/measurements:
- Step 1c: (HV values) For both ETMs, the HV values remained less than 5V (vs the ~200V mentioned in procedure). This is with multiple toggles of the HV ON/OFF button. (NOTE: ETMx actually did eventually get up to ~175V.)
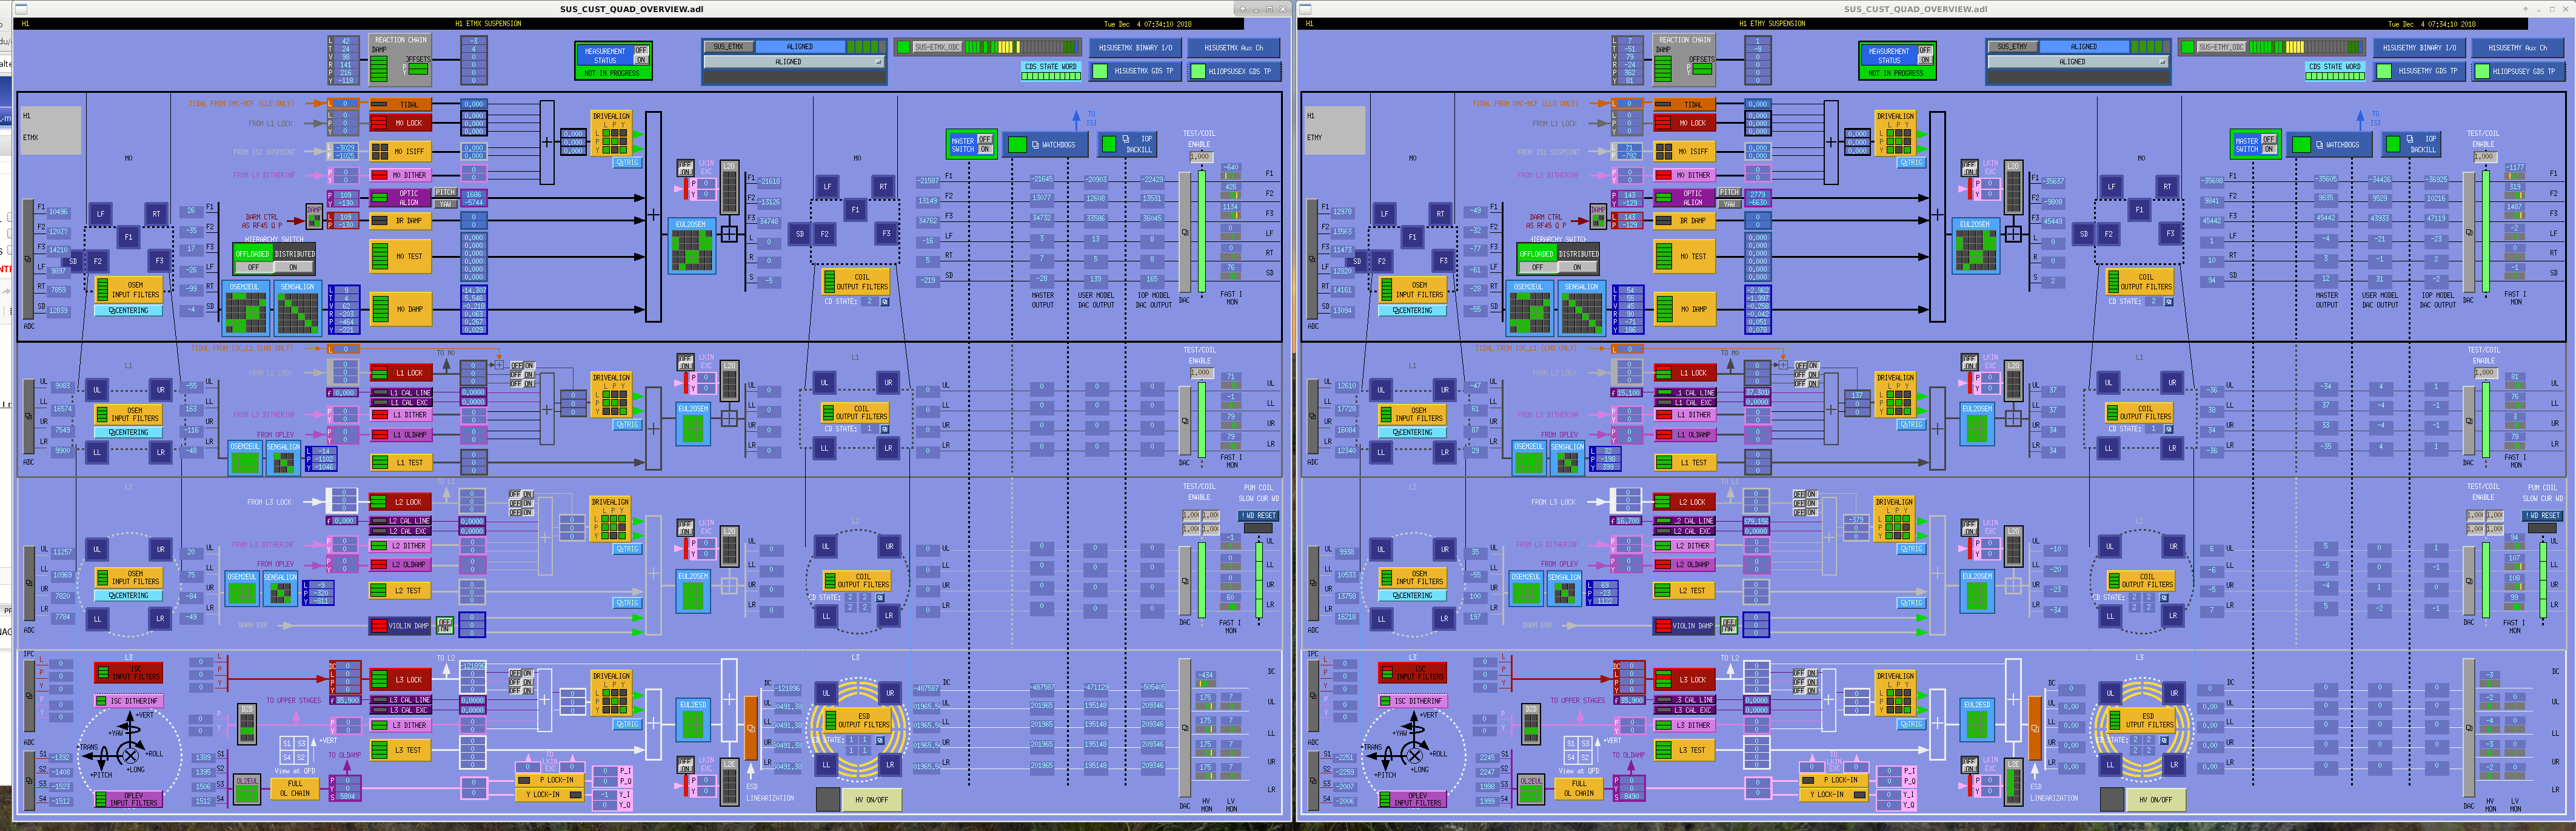
- General Prep Note: ETMx & ETMy look different. ETMx ESD Coil outputs all have values, on order of 50k (vs. ETMy whose similar channels are all zero). I don't look at these screens enough, but maybe this is due to how we use the ESD on ETMx and how ETMy continues to have a bad ESD (i.e. the LR). I've attached a screenshot of both ETMs to show what I observe. Again, this just may be normal, but for someone who doesn't put an eye on these screens often, it was just something I noticed.
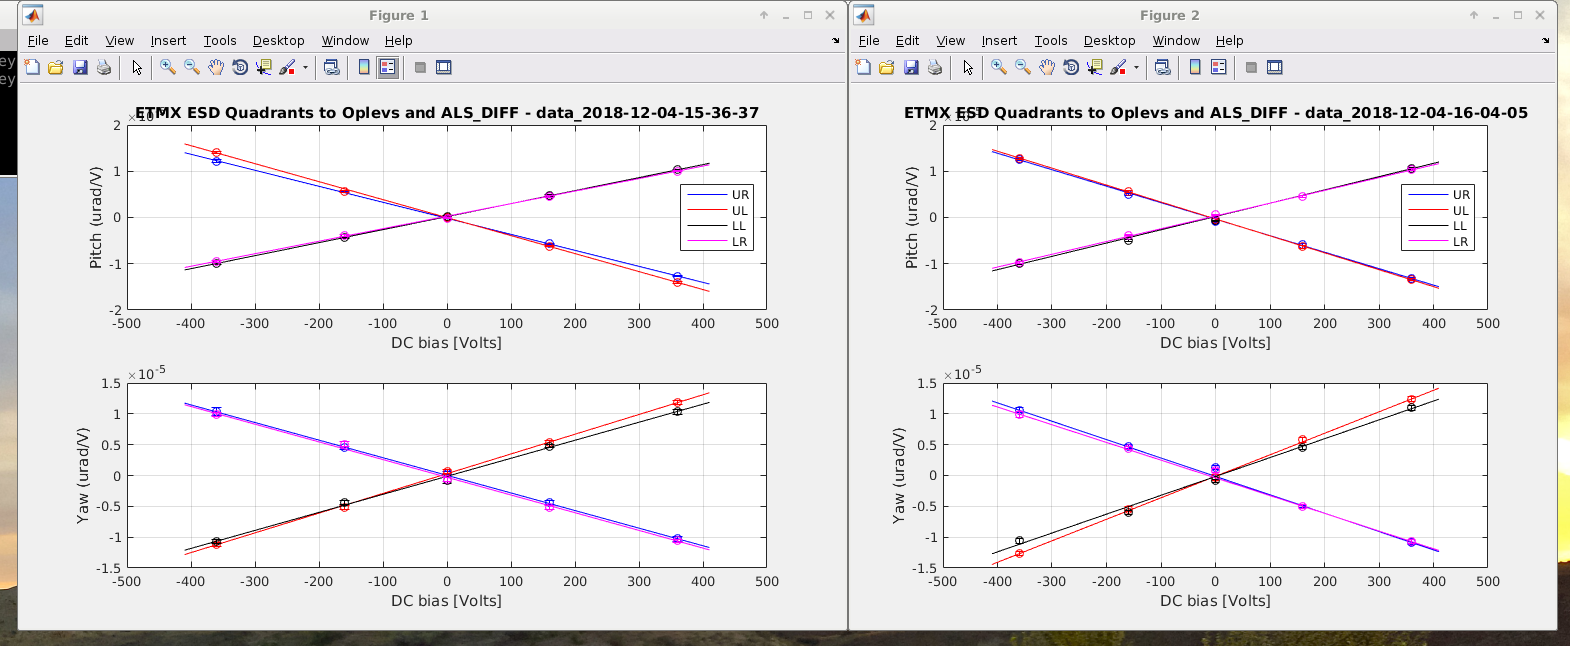
- For ETMx measurement (see attached), the 2nd data file had errors, so I only had (2) good measurements.
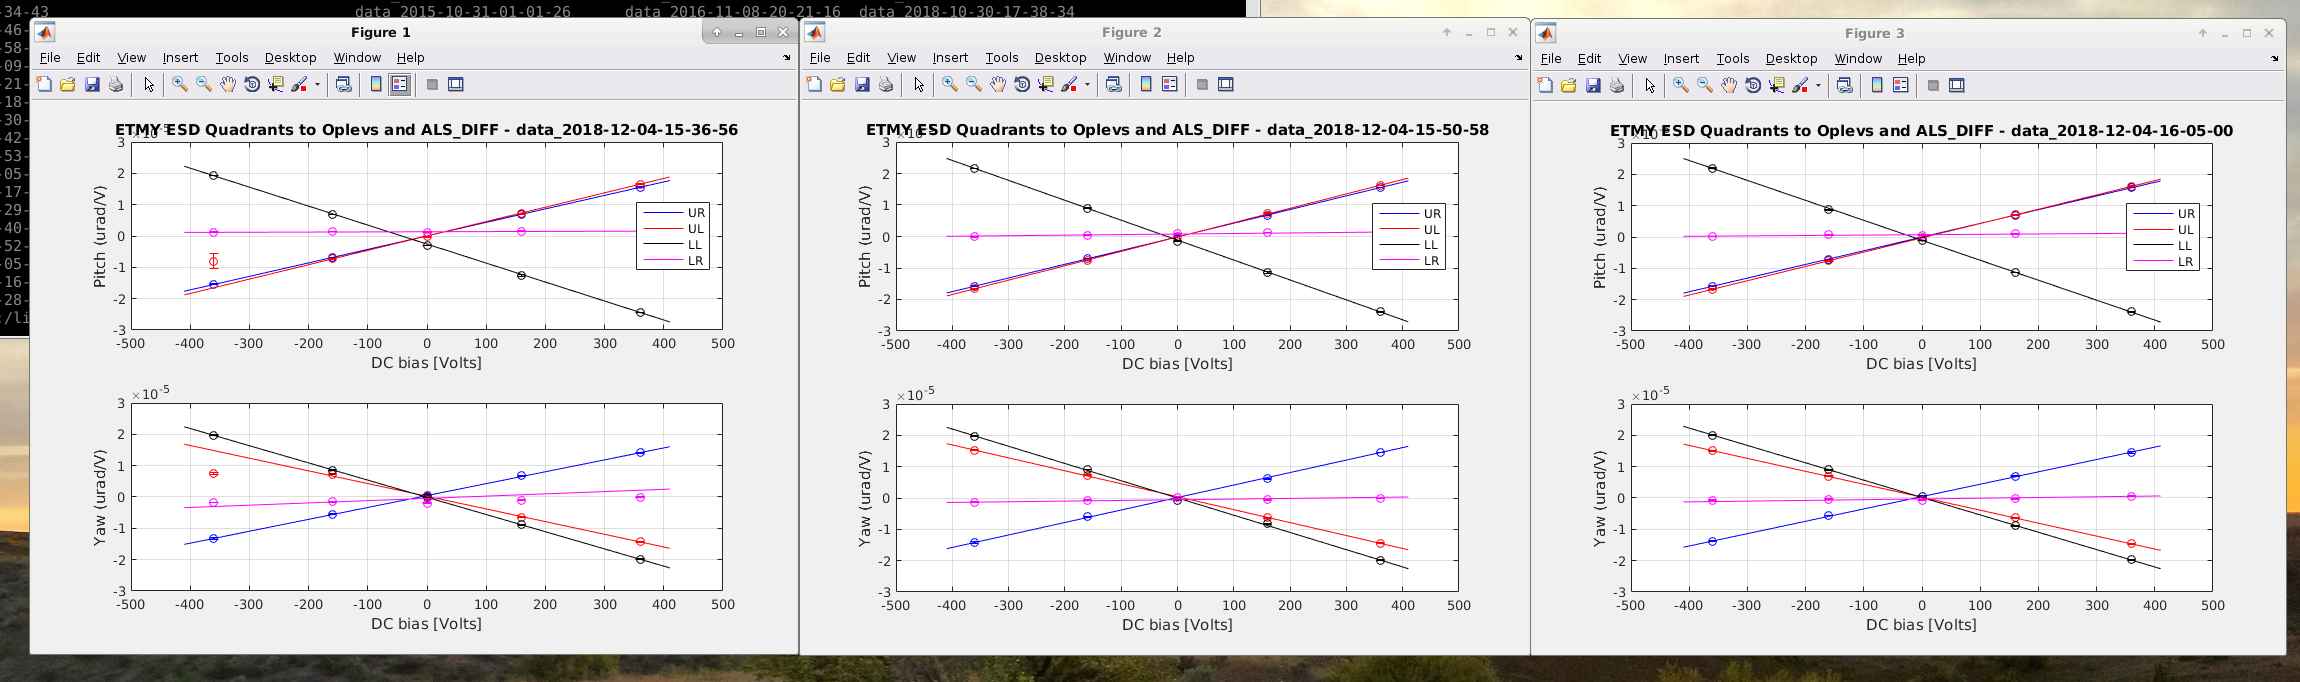
- For ETMy measurement (see attached), had 3 good measurements (all with a "flat" LR which is due to our ill ESD).
- Matlab note: Since I run this from my account, whenever I run the ESD_Analyse measurement, I select to "Change Folder" vs "Add to Path" when Matlab asks.
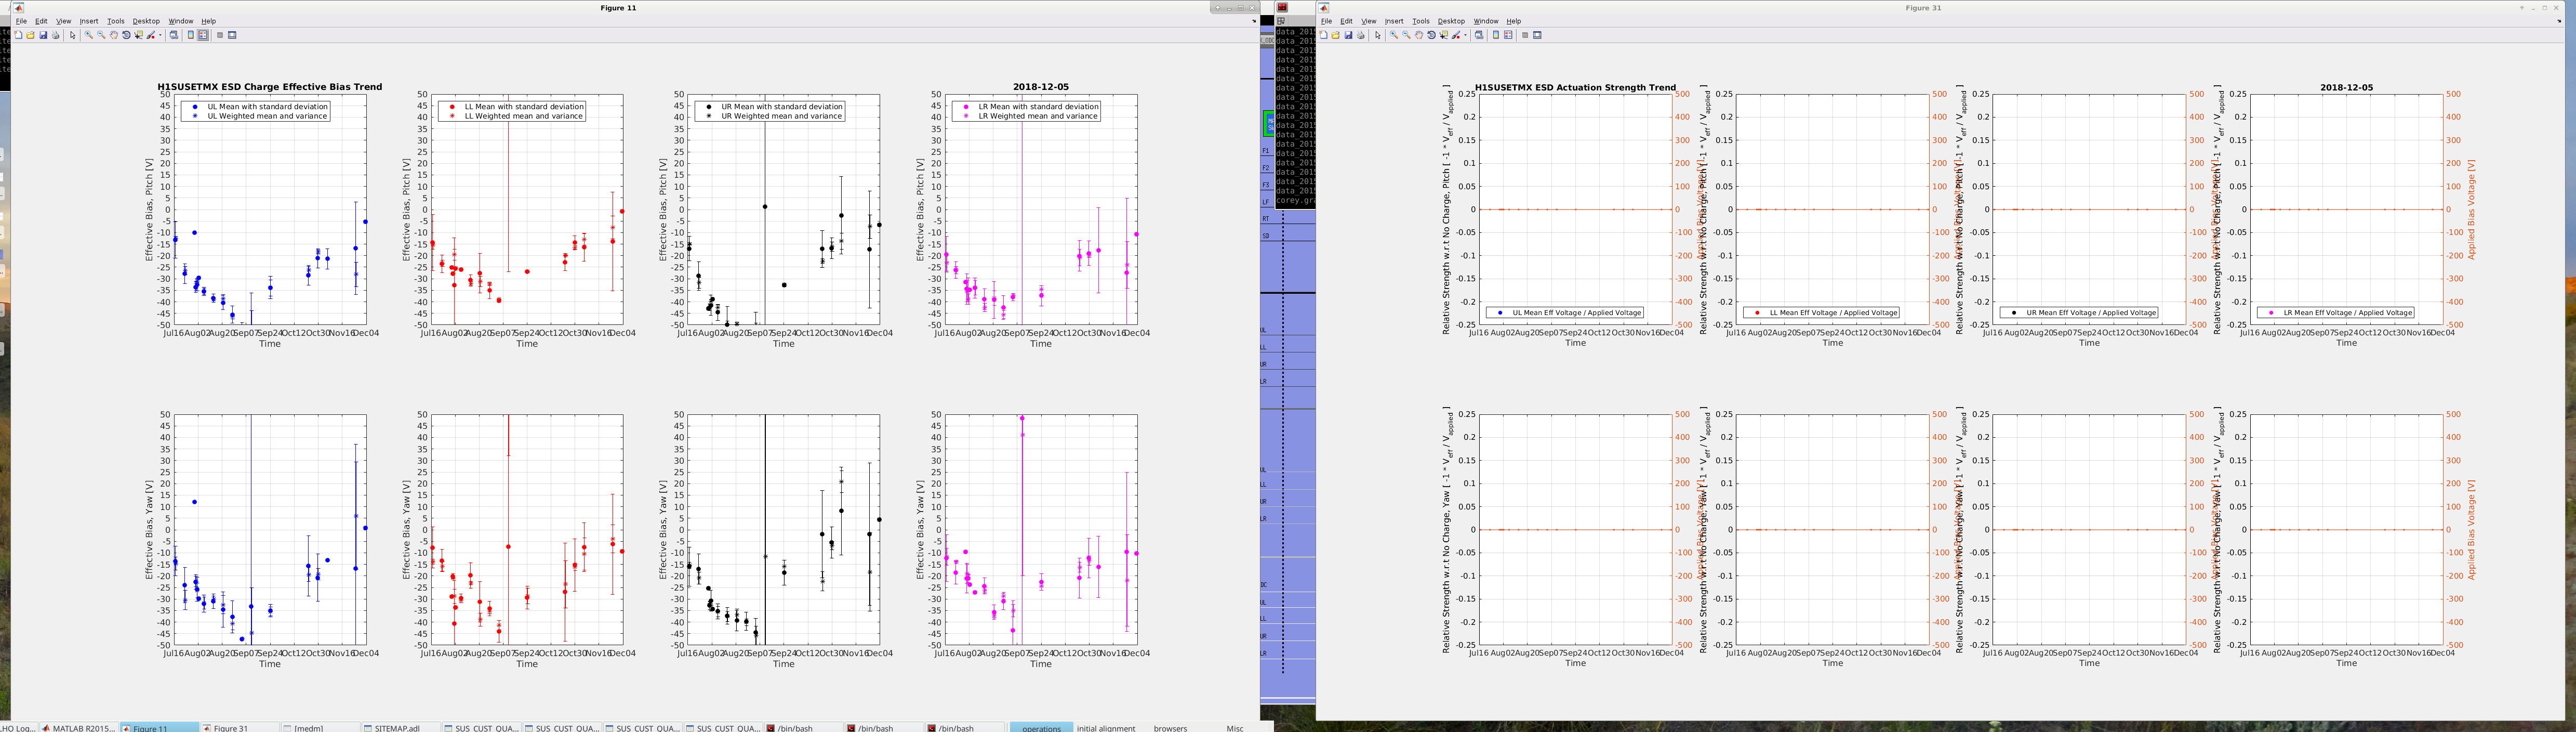
- Long Tred Plot (see attached) note: made stop time: 2018,12,04,18,00,0
- This gave me only plots for ETMx (see attached).
- ETMx ESD Charge Eff Bias Trend showed only the Mean data point for my measurement.
- ETMX ESD Actuatioon Strength Trend showed all the data points at 0.
Here are the original Slider Values (which I returned to after the measurement):
ETMx:
- Pit: 102.2
- Yaw: -128.4
ETMy:
- Pit: 136.3
- Yaw: -124.0
Images attached to this report