Josh, Jeff B., Guillermo
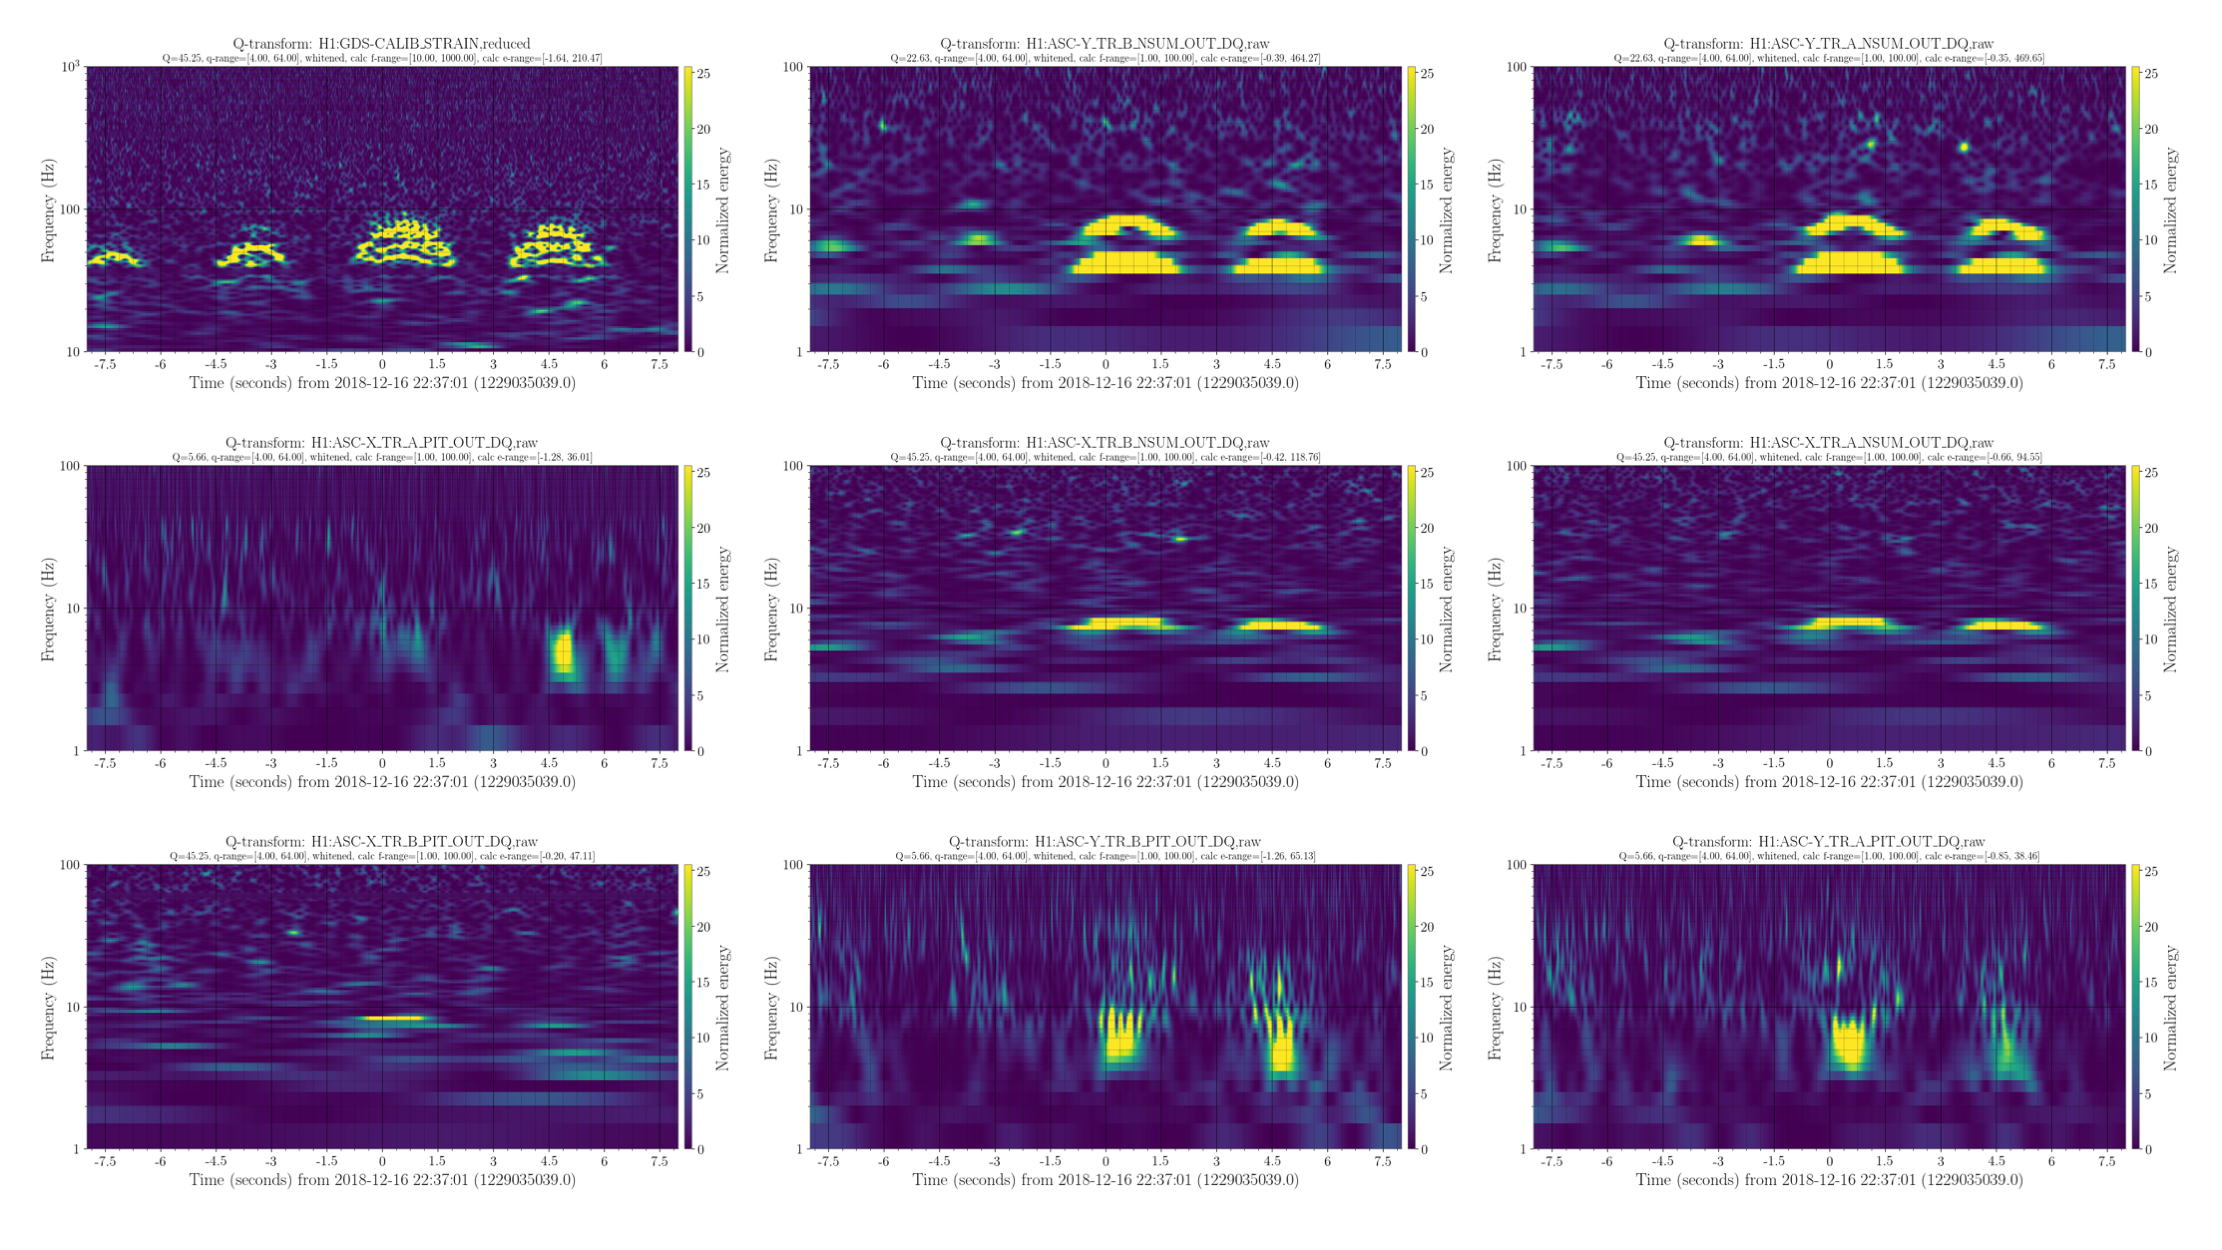
Scattering arches in DARM between 40 Hz – 100 Hz are coincident with scattering arches in the ASC TR A and B photodiodes at frequencies between 3 Hz – 10 Hz.
Summary:
- We found loud scattering arches in DARM for some of the Hveto winners on Dec 10, Dec 15, and Dec 16.
- While looking at the omega scans, we found that these arches are showing up in ASC Y transmitted light too.
- At L1, we were seeing scattering in the ASC Y (alog 41960), and more recently in the ASC X transmitted light (alog 42402).
- We did two things:
- We searched, using the HHT tool, for surfaces that could be generating the scattering.
- We generated Q-scans to check where does the scattering arches manifest with the highest amplitude.
Results:
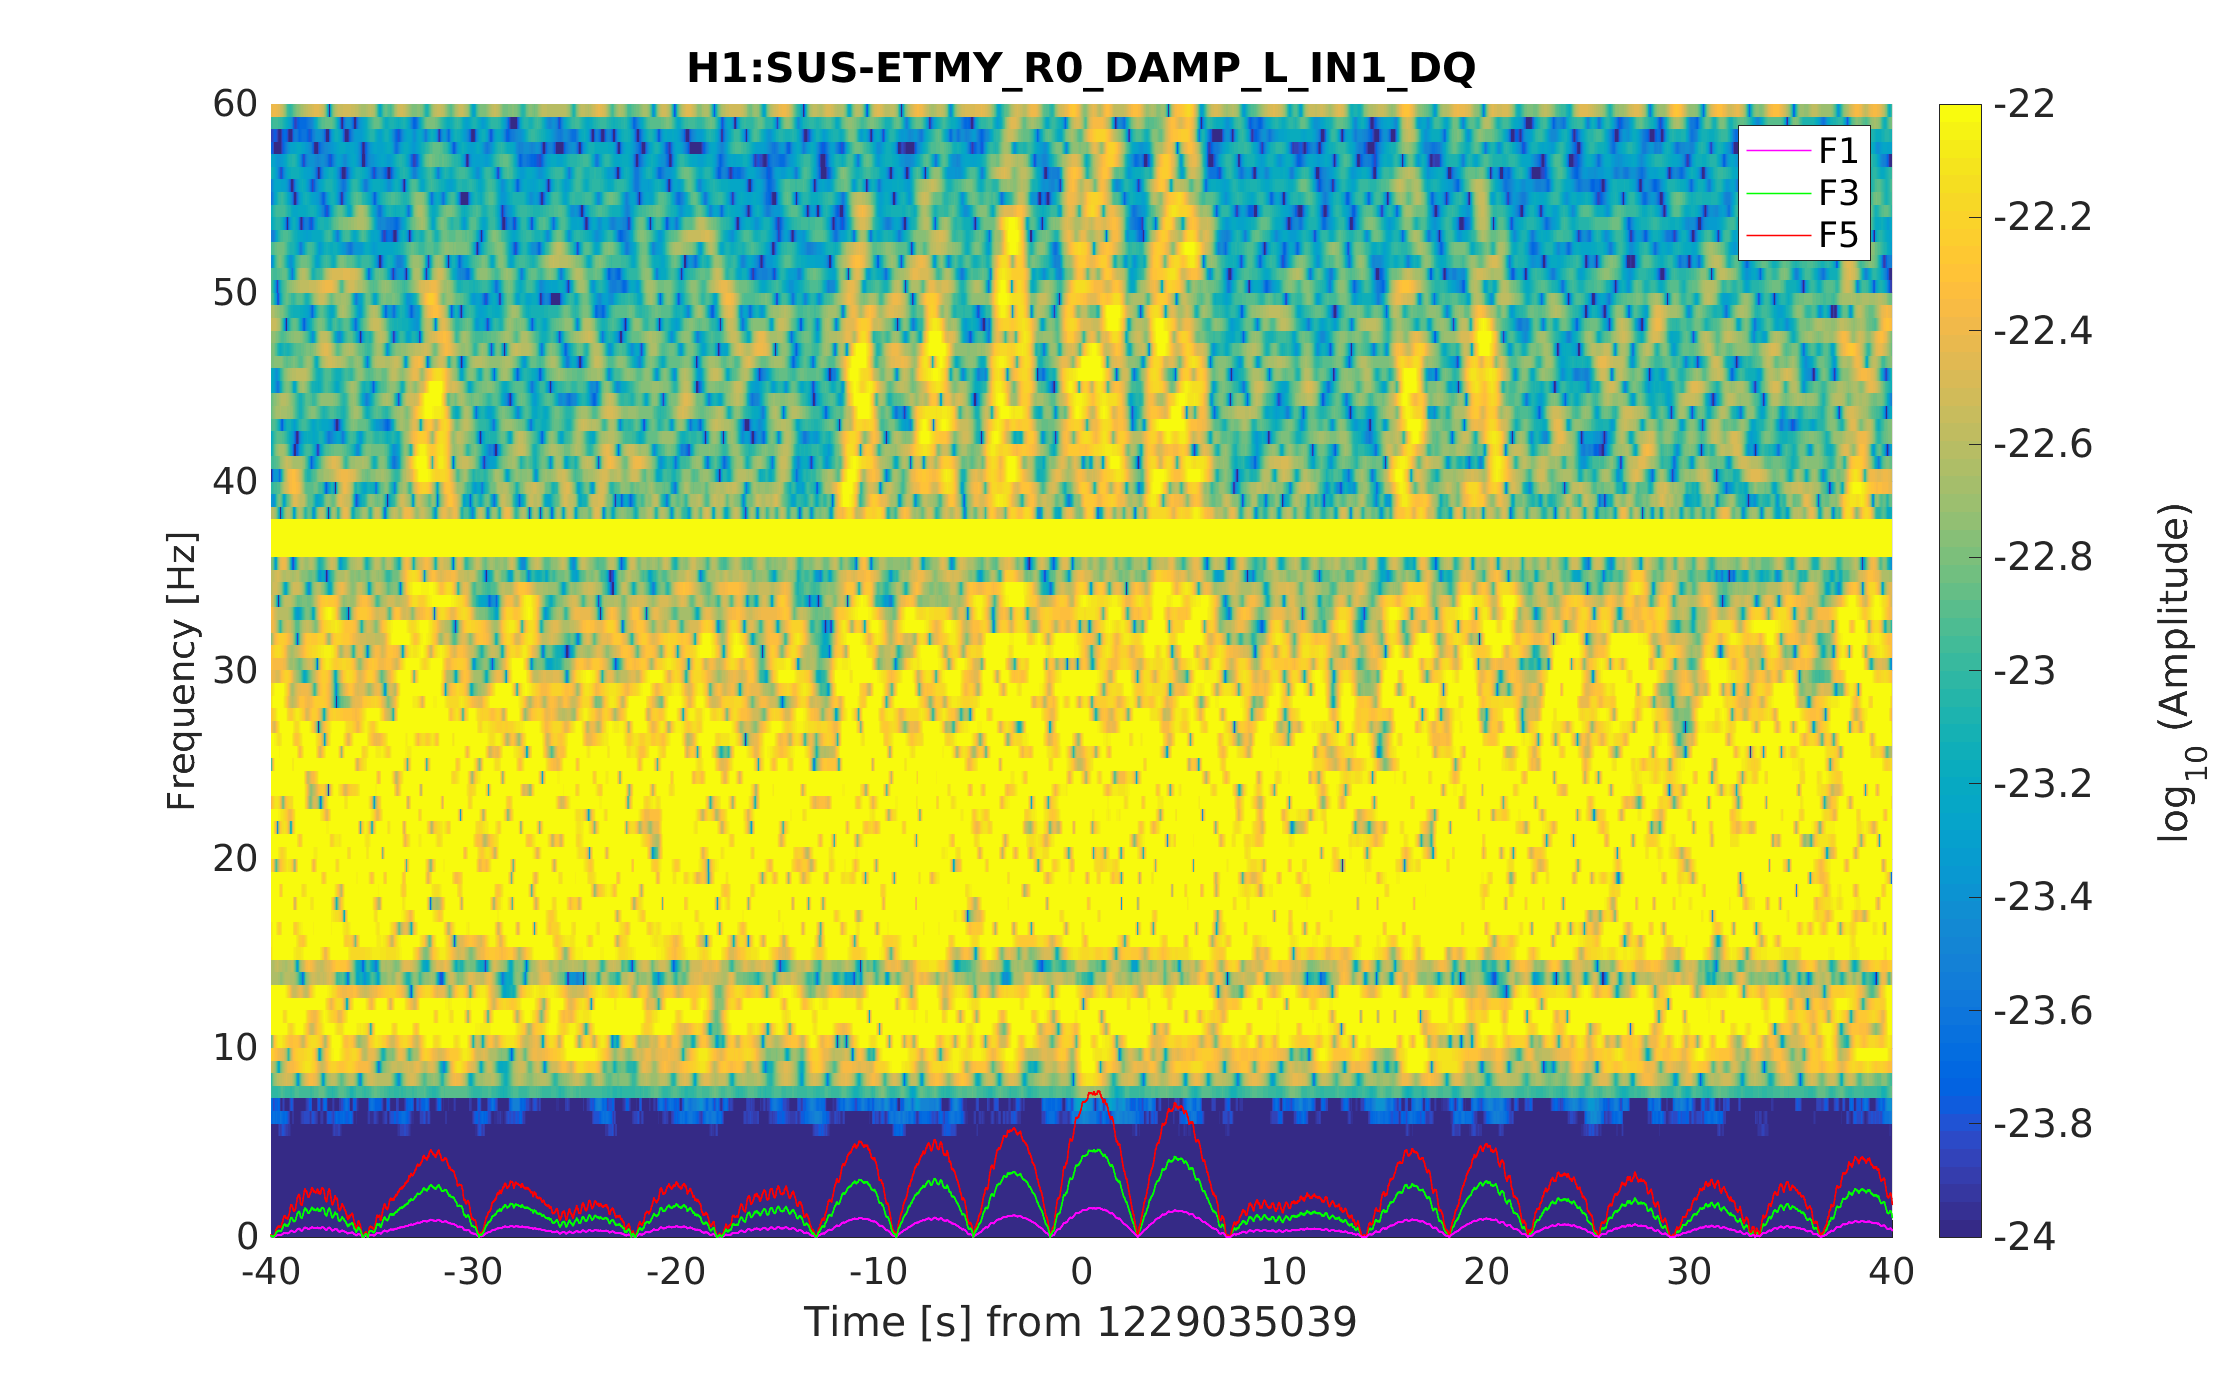
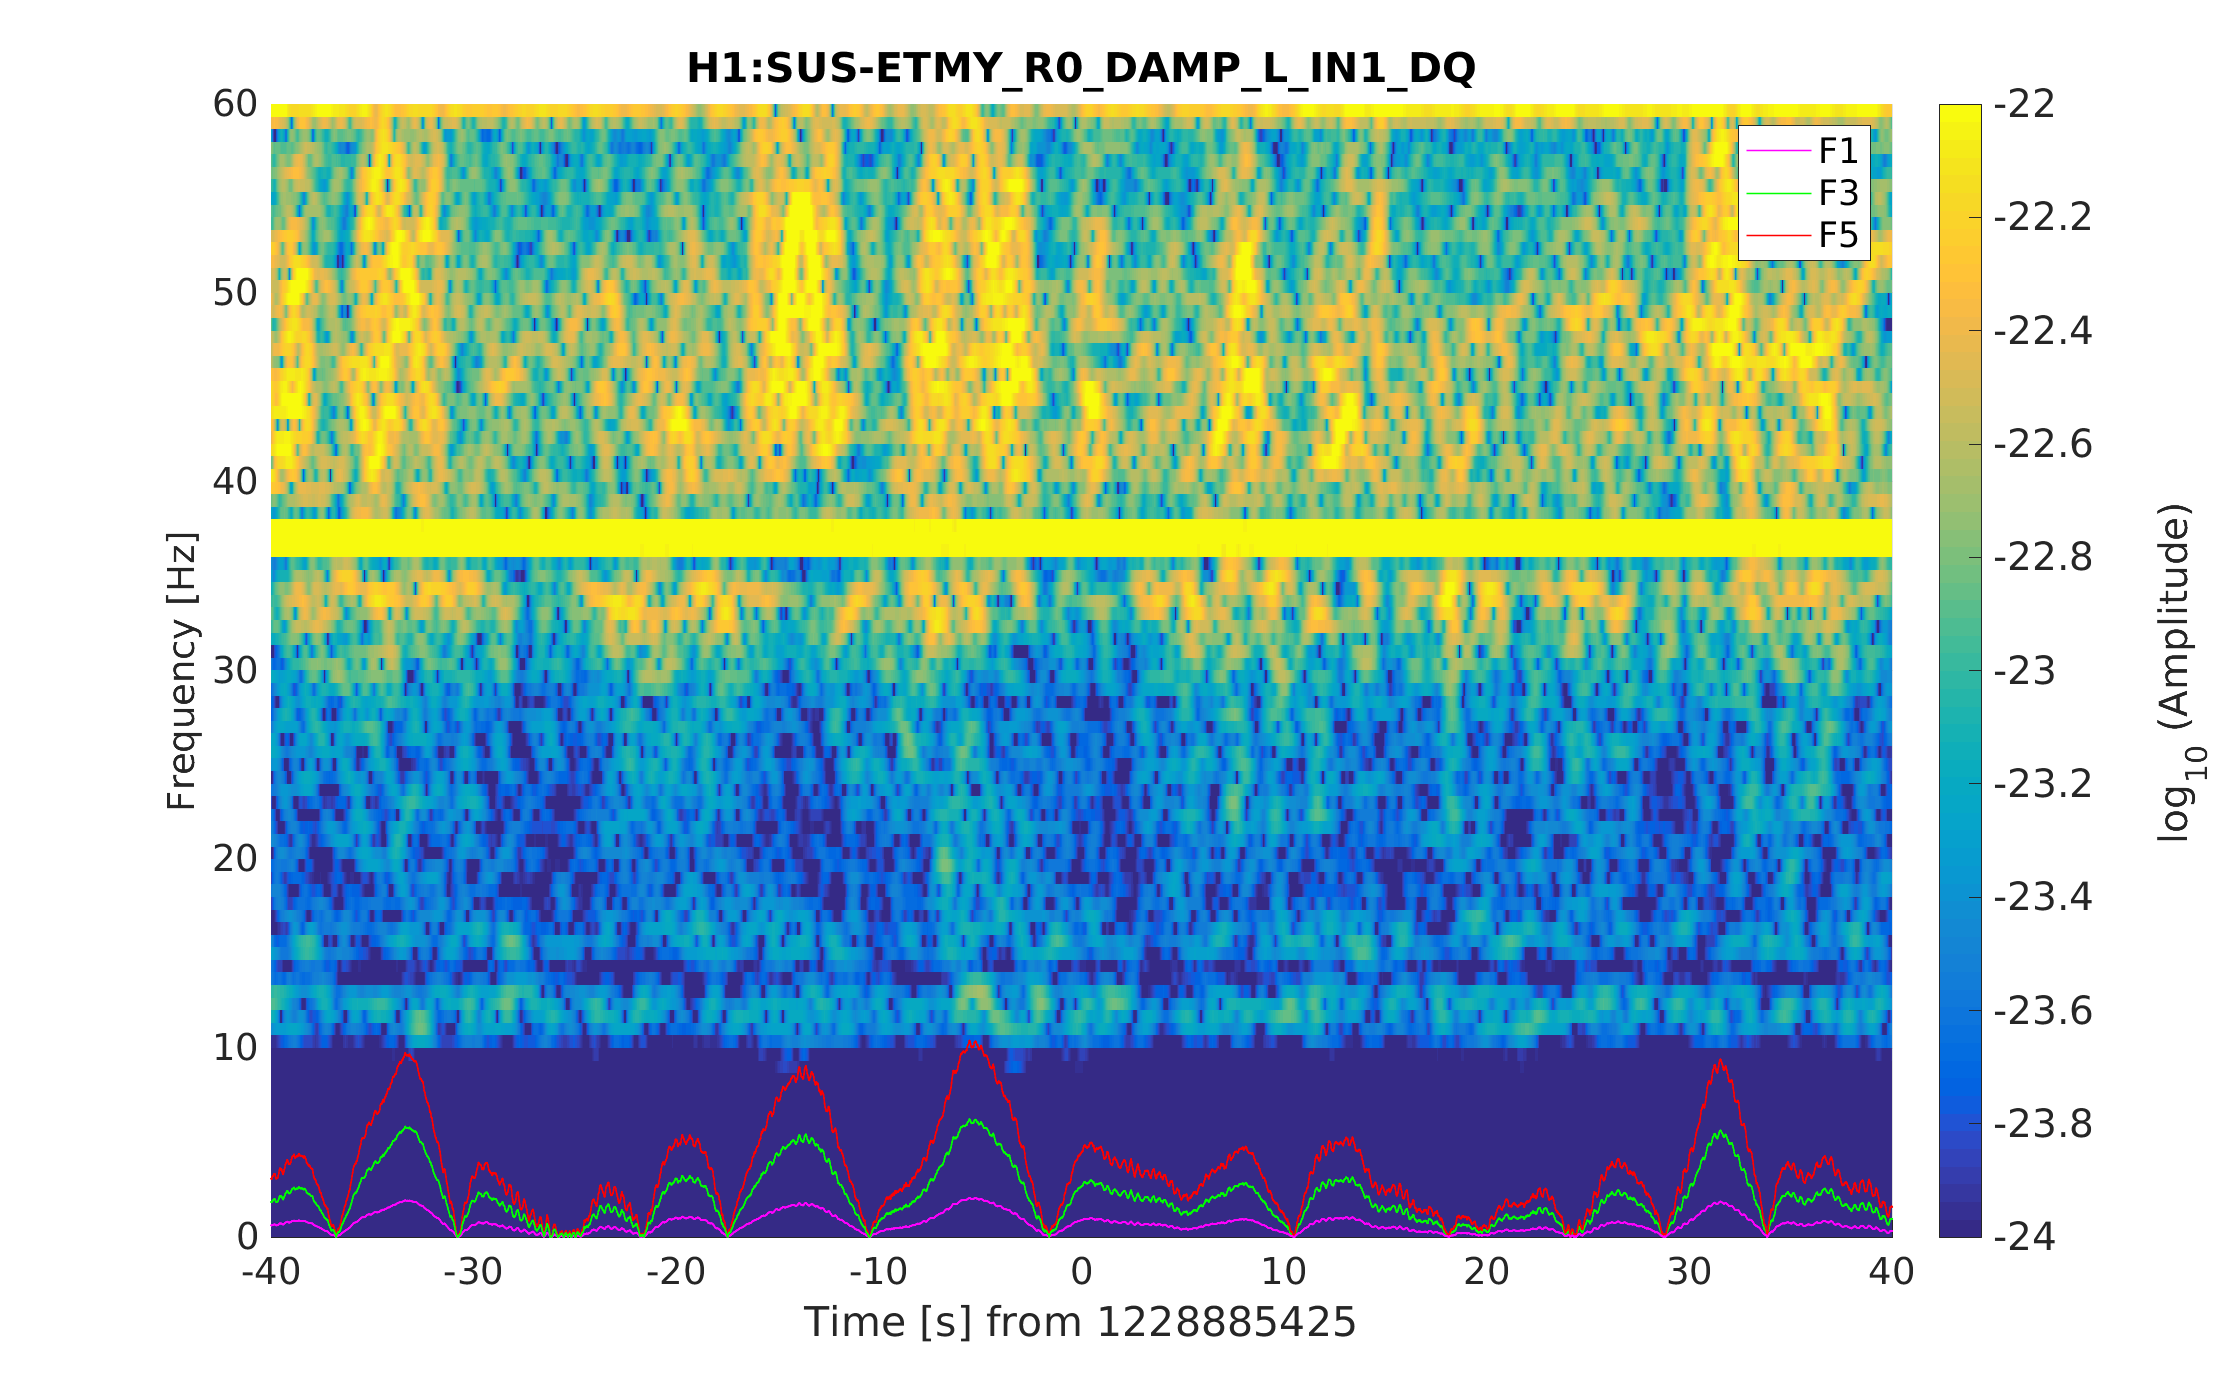
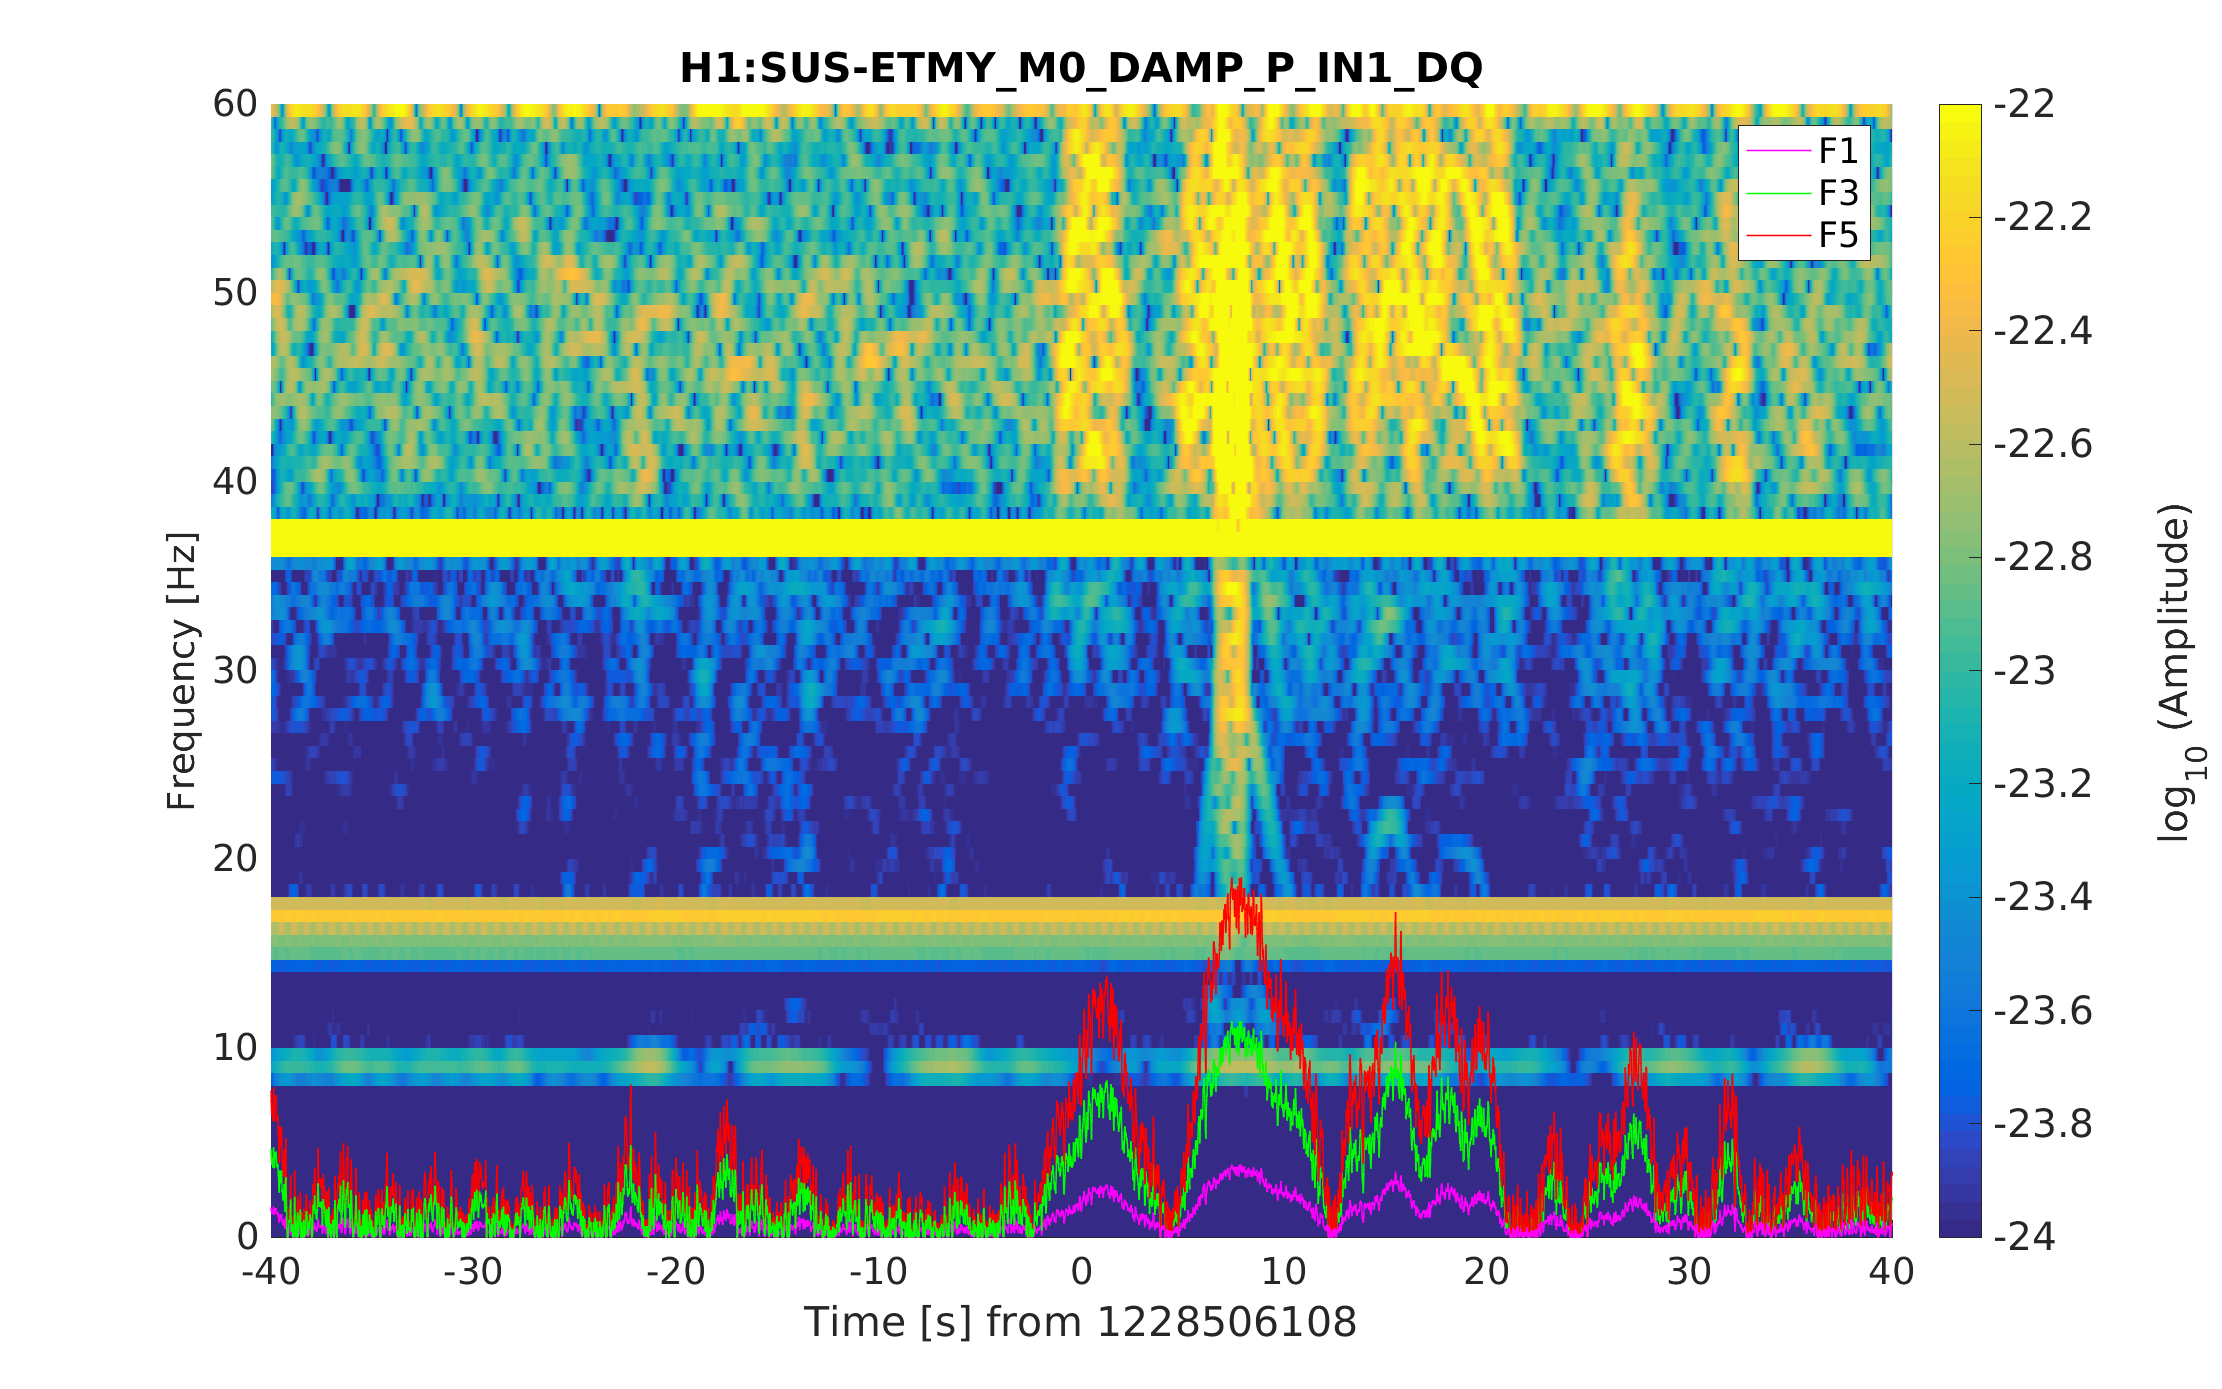
- As expected, the HHT tool points the Y end as the culprit. The tool points the ETMY M0 and ETMY R0 as the surfaces generating the scattering. The first 5 scattering harmonics of the scattering predictor do not reach the frequency band 40 Hz – 100 Hz but they reach the 3 Hz – 10 Hz frequency band. See figures Scattering_LHO_1.png, Scattering_LHO_2.png, and Scattering_LHO_3.png. In the plots, F1, F3, and F5 are the first, third and fifth scattering harmonics. We intentionally omitted F2 and F4.
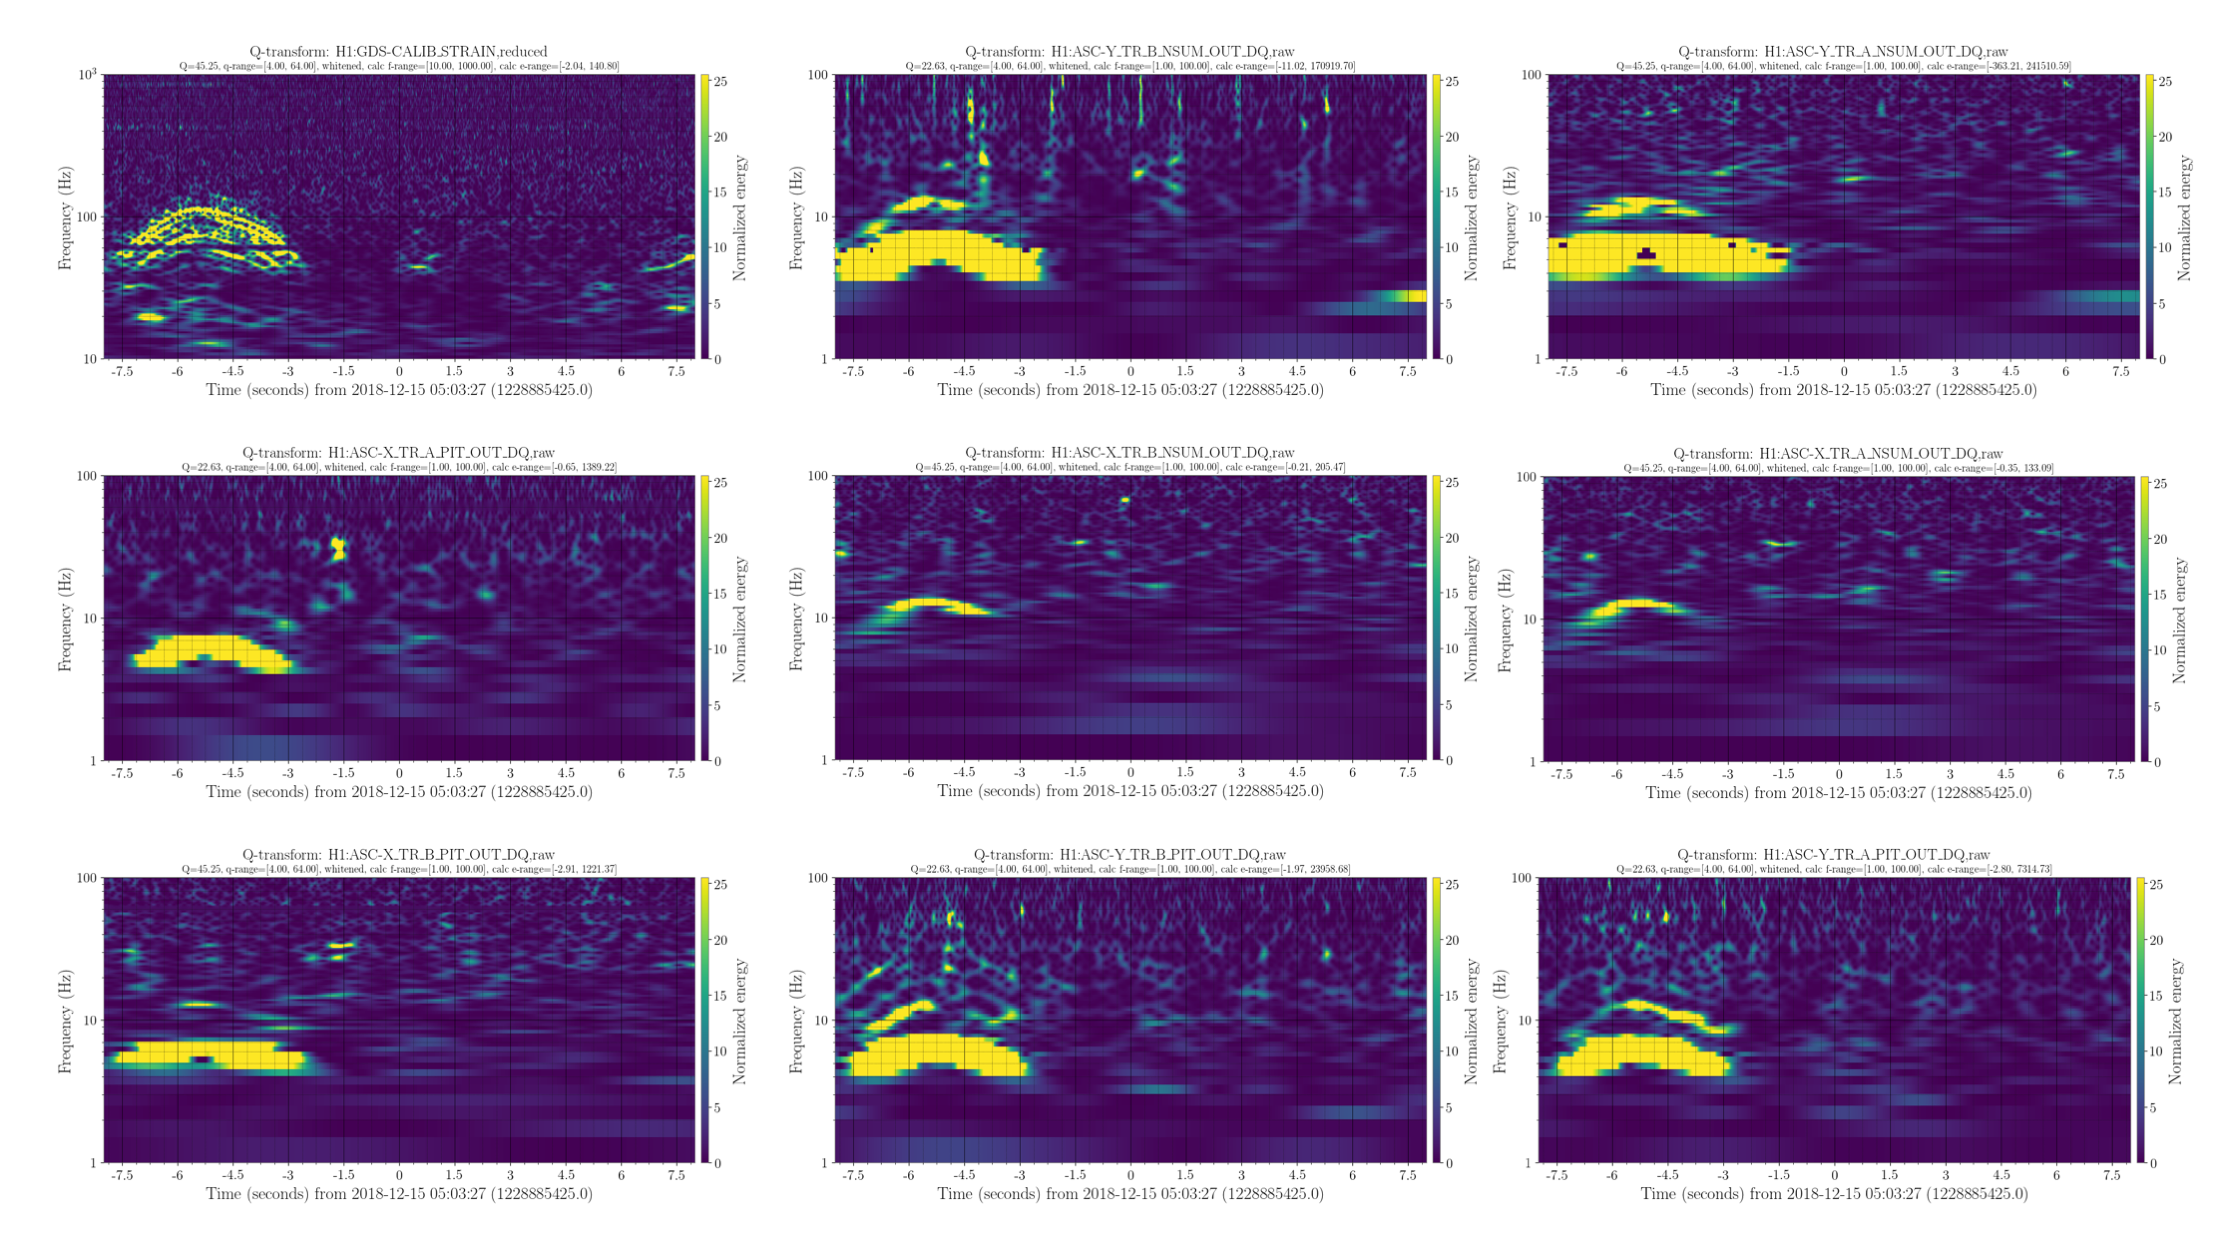
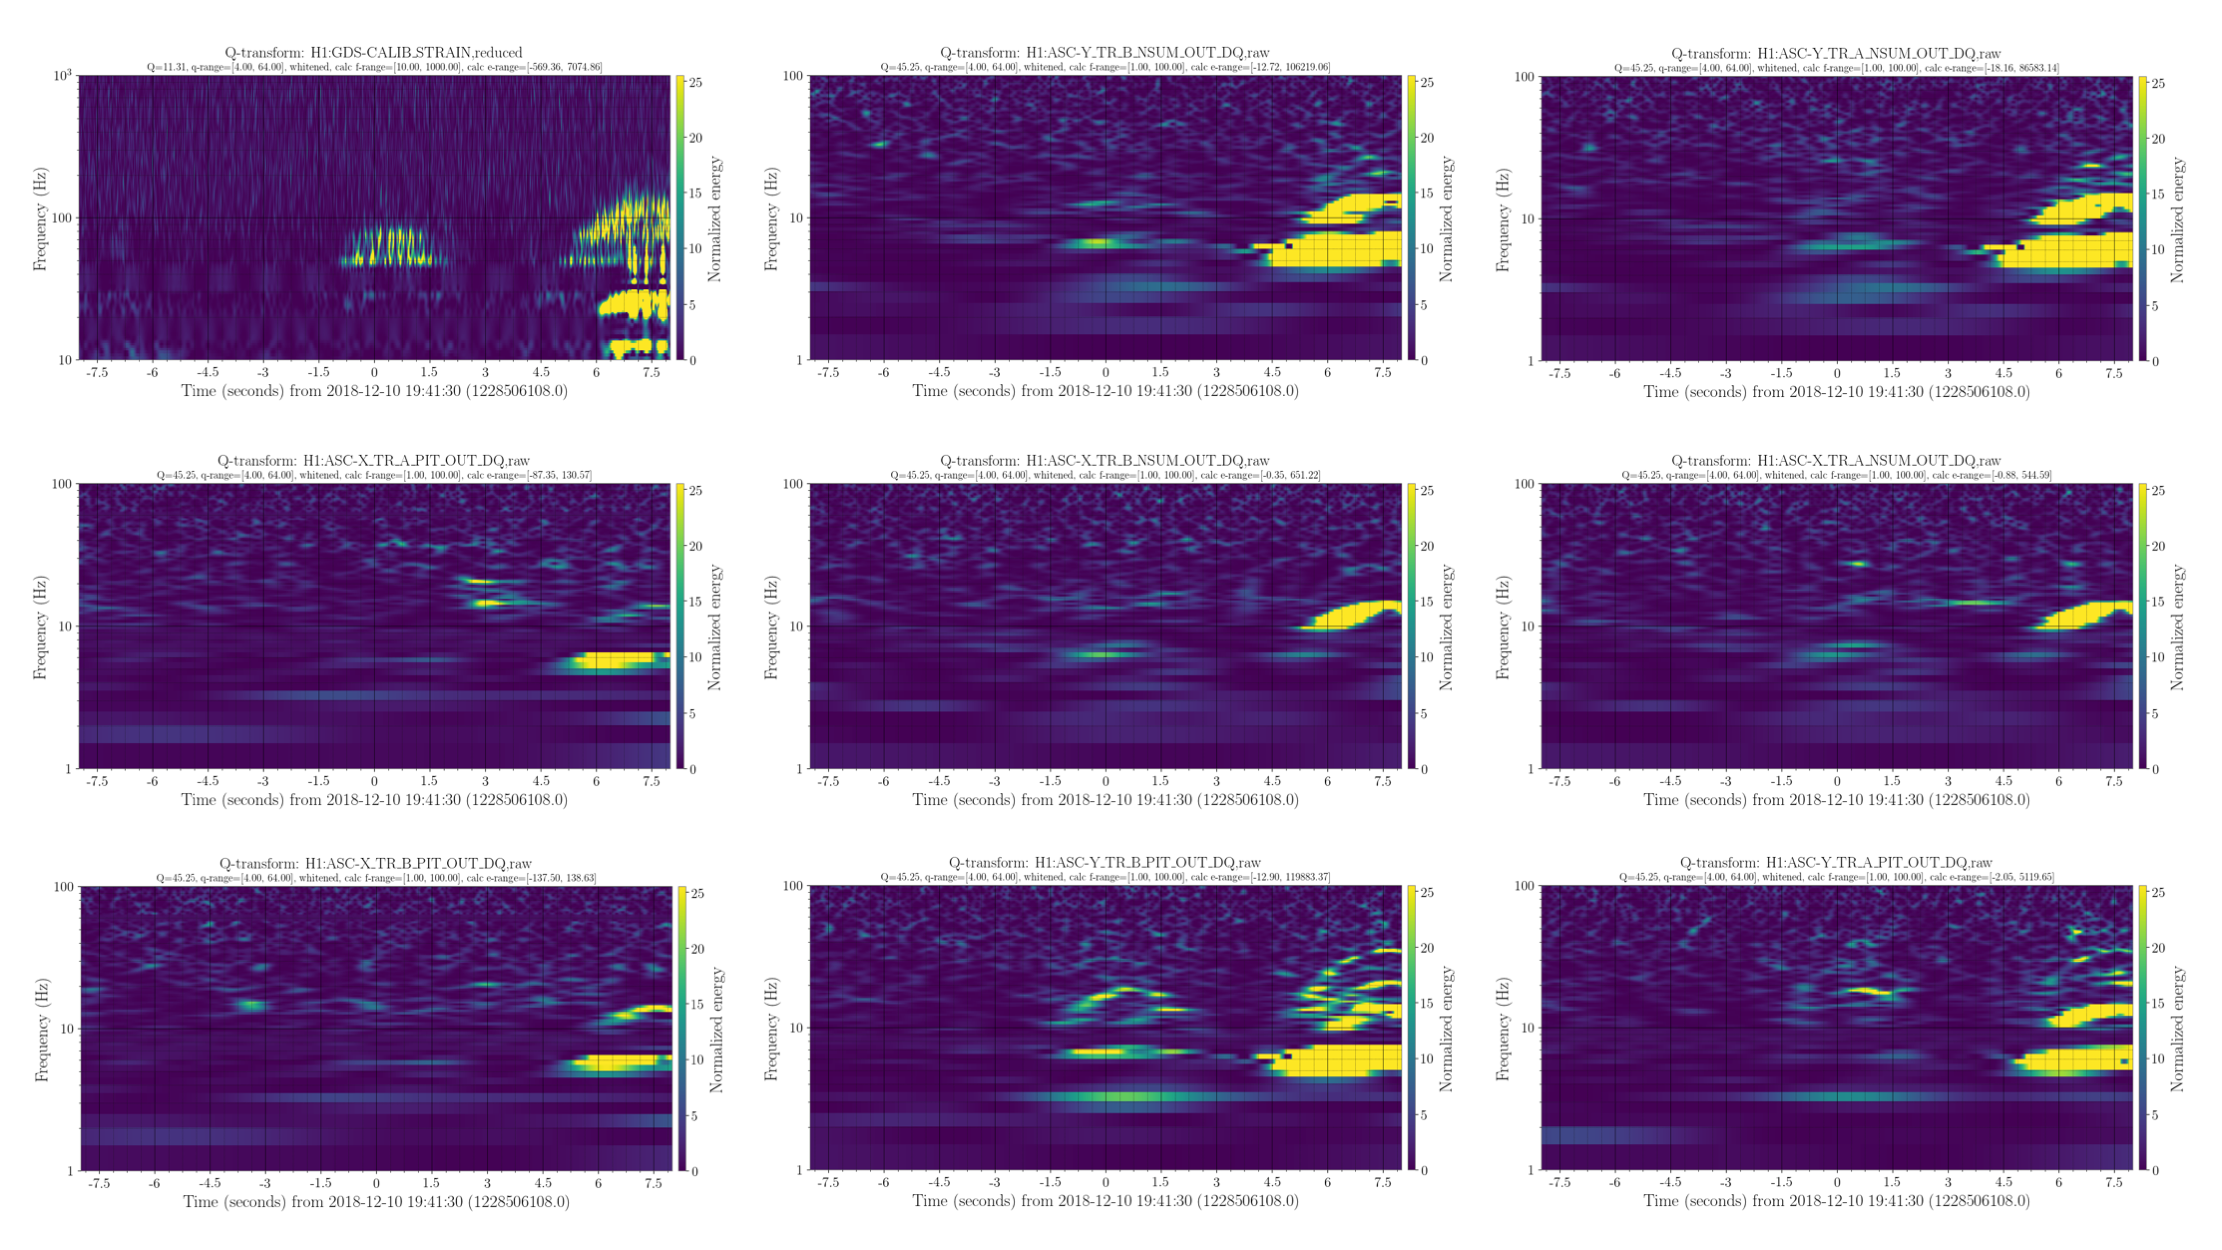
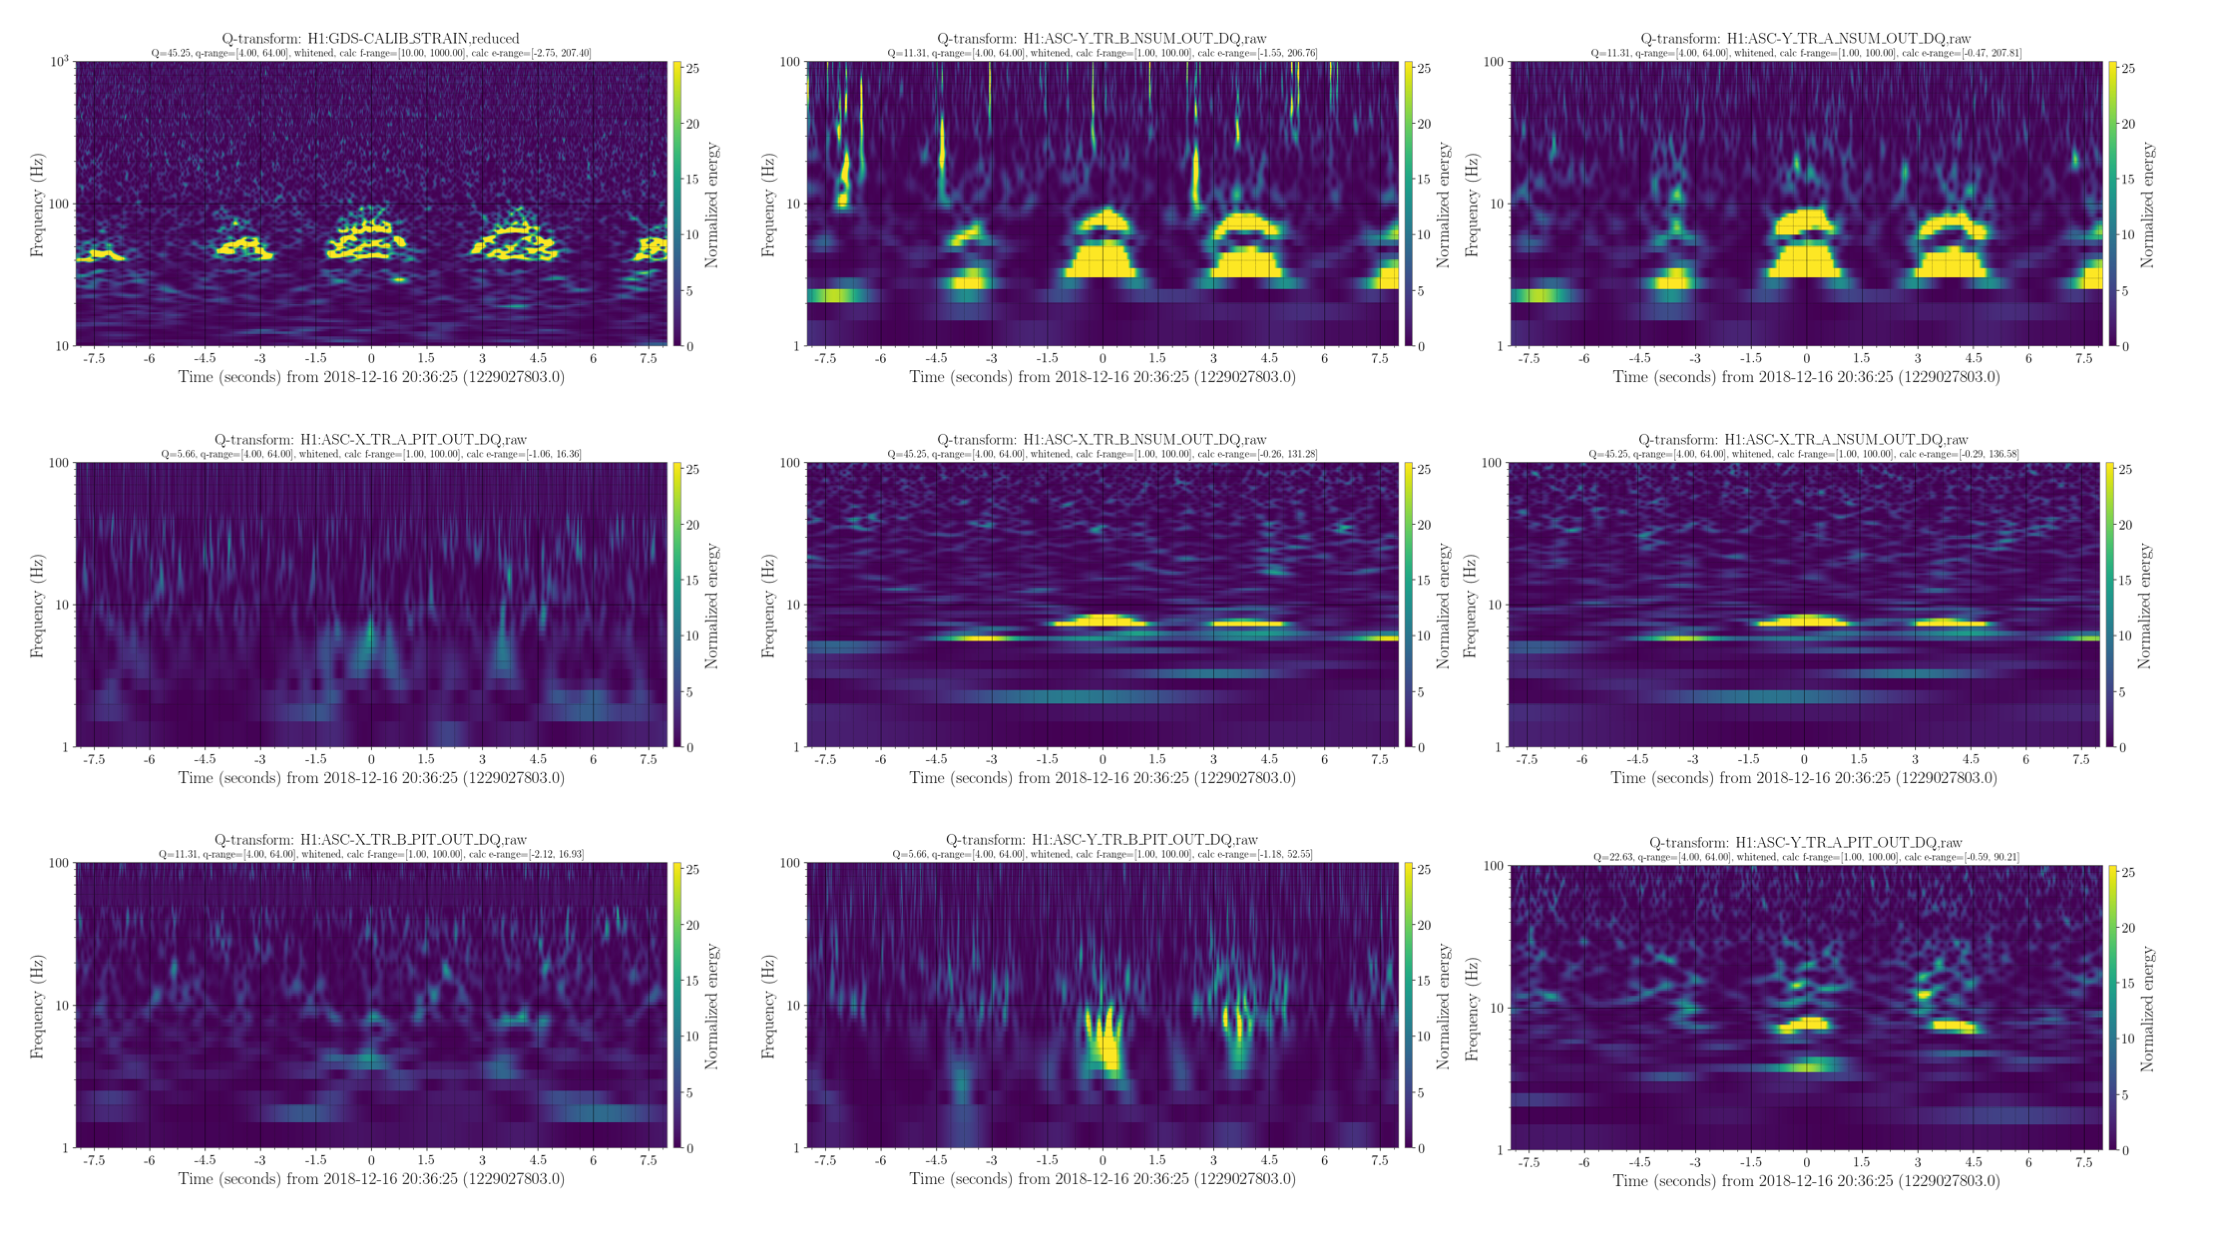
- In the Q-scans, of all the scattering instances we found, we see that the arches are shown with more energy in H1:ASC-Y_TR_B_NSUM_OUT_DQ and H1:ASC-Y_TR_A_NSUM_OUT_DQ, see the top row of Figure_1, Figure_2, Figure_3, and Figure_4. The scattering features show with less energy in the ASC_X_TR.
Note: scattering predictor in Hz is defined as F_fringe = 2*abs(v_surface)/lambda and the scattering harmonics are the fringes or arches generated after the scattered light hit more than once the perturbed surfaced; see Noise from scattered light in Virgo's second science run data.
there's no laser beam up near M0 or R0, so that's not likely. But perhaps the tool should be reconfigured to consider the difference between the motion of different surfaces. That may point more directly to the scattering path (e.g. between the mirror and the vacuum viewport, or between the mirror and the primary mirror of the transmon, or even a three way interaction)